Lowest Measurement of the Reaction: Probing the Pionic Contribution
Abstract
To determine nonspherical angular momentum amplitudes in hadrons at long ranges (low ), data were taken for the reaction in the region at (GeV/c)2 utilizing the magnetic spectrometers of the A1 Collaboration at MAMI. The results for the dominant transition magnetic dipole amplitude and the quadrupole to dipole ratios at MeV are: , Re()%, and Re()%. These disagree with predictions of constituent quark models but are in reasonable agreement with lattice calculations with non-linear (chiral) pion mass extrapolations, with chiral effective field theory, and with dynamical models with pion cloud effects. These results confirm the dominance, and general variation, of the pionic contribution at large distances.
pacs:
13.60.Le, 13.40.Gp, 14.20.GkExperimental confirmation of the presence of nonspherical hadron amplitudes (i.e. d states in quark models or p wave -N states) is fundamental and has been the subject of intense experimental and theoretical interest (for reviews see nstar2001 ; cnp ; amb ). This effort has focused on the measurement of the electric and Coulomb quadrupole amplitudes (E2, C2) in the predominantly M1 (magnetic dipole-quark spin flip) transition. Measurements of the E2 amplitude from photopion reaction experiments with polarized photons have been reported beck ; blanpied . Electroproduction experiments at JLab joo ; frolov for from 0.4 to 4.0 (GeV/c)2, at Bates warren ; mertz ; kunz ; sparveris at (GeV/c)2 and Mainz pospischil ; bartsch ; elsner at (GeV/c)2 have been published. The present result at (GeV/c)2 is the lowest value probed to date in modern, precision electroproduction. It adds a very important point to determine the physical basis of long range nucleon and nonspherical amplitudes and is a test of the region where pionic effects are predicted to be dominant and appreciably changing.
Since the proton has spin 1/2, no quadrupole moment can be measured. However, the has spin 3/2 so the reaction can be studied for quadrupole amplitudes in the nucleon and . Due to spin and parity conservation in the reaction, only three multipoles can contribute to the transition: the magnetic dipole (M1), the electric quadrupole (E2), and the Coulomb quadrupole (C2) photon absorption multipoles. The corresponding resonant pion production multipoles are , , and . The relative quadrupole to dipole ratios are and . In the quark model, the nonspherical amplitudes in the nucleon and are caused by the non-central, tensor interaction between quarks glashow . However, the magnitudes of this effect for the predicted E2 and C2 amplitudescapstick_karl are at least an order of magnitude too small to explain the experimental results (see Fig. 3 below) and even the dominant M1 matrix element is 30% low amb ; capstick_karl . A likely cause of these dynamical shortcomings is that the quark model does not respect chiral symmetry, whose spontaneous breaking leads to strong emission of virtual pions (Nambu-Goldstone Bosons)amb . These couple to nucleons as where is the nucleon spin, and is the pion momentum. The coupling is strong in the p wave and mixes in non-zero angular momentum components. Based on this, it is physically reasonable to expect that the pionic contributions increase the M1 and dominate the E2 and C2 transition matrix elements in the low (large distance) domain. This was first indicated by adding pionic effects to quark modelsquark_pion , subsequently shown in pion cloud model calculationssato_lee ; dmt , and recently demonstrated in chiral effective field theory calculationsgail_hemmert ; pasc .
The five-fold differential cross section for the reaction is written as five two-fold differential cross sections with an explicit dependence as drechsel_tiator
| (1) | |||||
where is the transverse polarization of the virtual photon, , , is the virtual photon flux, is the pion center of mass azimuthal angle with respect to the electron scattering plane, is the electron helicity, and is the magnitude of the electron longitudinal polarization. The virtual photon differential cross sections () are all functions of the center of mass energy , the four momentum transfer squared , and the pion center of mass polar angle (measured from the momentum transfer direction). They are bilinear combinations of the multipoles drechsel_tiator .
The measurements were performed using the A1 spectrometers at the Mainz Microtronblom . Electrons were detected in Spectrometer A and protons in Spectrometer B. Timing and missing mass cuts were sufficient to eliminate the background. Spectrometer B has the ability to measure at up to 10 degrees out-of-plane in the lab. Due to the Lorentz boost this is significantly larger in the center of mass frame. The Mainz Microtron delivers a longitudinally polarized, continuous, 855 MeV beam. Beam polarization was measured periodically with a Møller polarimeter to be . The beam of up to 25 A was scattered from a liquid hydrogen cryogenic target. Sequential measurements were made at MeV, GeV2/c2, and . For non-parallel measurements (), the proton arm was moved through three settings while keeping the value constant. The spectrometers were aligned in the lab with a precision of 0.6 mm and 0.1 mrad with a central momentum resolution of 0.01% and angular resolution at the target of 3 mrad blom . The beam energy has an absolute uncertainty of keV and a spread of 30 keV (FWHM) blom . The effects of these uncertainties and the various kinematic cuts were studied to estimate an overall systematic error for the cross sections of 3 to 4%. This was tested with elastic electron-proton scattering and the data agree with a fit to the world data mergell at the 3% level.
With measurements at three values at a fixed and using a polarized electron beam, the cross sections , and can be extracted from the and beam helicity dependence of the cross section. Care was taken to ensure good kinematic overlap between the different angular settings. Typically the phase space overlaps were MeV, GeV2/c2, , and . Since the cross sections vary across the spectrometer acceptance, the shape of the cross section given by several models was used to refer all of the points to the center of the acceptance. This is a small correction (typically 3%) and depends only on the relative cross sections across the spectrometer acceptance. Several models were used for the collapse and each gives results consistent at the 0.5% level stave_thesis .
The measured partial cross sections are plotted in Figs. 1 and 2. Figure 1 shows and with the chiral effective field theory (EFT) predictions pasc which have uncertainties which reflect an estimate of the neglected higher order terms in the chiral expansion. The other models are the phenomenological model MAID 2003maid1 , the pion cloud dynamical models of Sato and Leesato_lee and of DMTdmt (Dubna, Mainz, and Taipei), and the SAID multipole analysissaid . There is a significant spread in these model calculations due to differences in the resonant and background amplitudes. However it is impressive that the four model curves almost fall on top of each other when the three resonant amplitudes () are varied to fit the data as shown in the lower panel of Fig. 1. In addition, this panel shows the “spherical” calculated curves when the resonant quadrupole amplitudes ( in and in ) are set equal to zero. The difference between the spherical and full curves shows the sensitivity of these cross sections to the quadrupole amplitudes and demonstrates the basis of the present measurement. The small spread in the spherical curves indicates their sensitivity to the model dependence of the background amplitudes.
Figure 2 shows the measured cross sections for and with the same model curves as in Fig. 1. It is seen that within the relatively large estimated uncertainties the chiral effective field theory calculationspasc are consistent with experiment. For the four model calculationsmaid1 ; sato_lee ; dmt ; said are in good agreement with each other and with the data. However for this is not the case and only the Sato-Lee model agrees with experiment.
It is instructive to examine why is sensitive to the Coulomb quadrupole amplitude, , and is primarily sensitive to the background. The time reversal even observable contains the interference amplitude which is primarily sensitive to where the latter is the dominant multipole amplitude. By contrast the time reversal odd observable contains . This is primarily sensitive to and therefore does not measure the Coulomb quadrupole amplitude but rather is sensitive to a background term times the dominant magnetic dipole term. The details will be presented in a future publicationstave_etal .
On the other hand, the other cross sections show a minimum of model dependence and can be used to accurately extract the three resonant amplitudes as will be discussed below. The model curves after fitting for and are almost identical to those before and so have been suppressed. is insensitive to the resonant parameters, as mentioned above, and while sensitive to , is dominated by the term.
As has been discussed above, we have obtained the values of the three resonance amplitudes () using fits with four reaction modelsmaid1 ; sato_lee ; dmt ; said . Correlations between the fitting parameters were taken into account in the errors estimated by the fitting routine stave_thesis ; minuit . The fits were performed using the spectrometer cross sections and were the same (within the errors) whether or not the data were included. In addition, the fits used the entire amplitude so that the unitarity of each model was preserved. At resonance, these amplitudes are purely imaginary due to the Fermi-Watson theorem drechsel_tiator . The fits were performed at the same value of at which the data were taken. The models were then used to extrapolate the value of the multipoles at MeV. Following our previous workcnp ; sparveris we took the final results to be the average of these model determinations and estimated the model dependent error in the resonance amplitudes by taking the RMS deviation of the values stave_thesis . We believe that this is reasonable since the chosen models represent state of the art calculations and also a variety of different approaches. The results of the fits for the resonant multipoles along with the EFT predictions are presented in Table 1 along with the original values for several models. We also present the average fitted values for the four reaction models considered here. The differences between these values represent the model dependence due to the different background multipoles. The effect of background amplitudes on the resonant amplitudes was studied and determined to have an effect approximately the same size as the model to model RMS deviation. This study is detailed in Refs. stave_thesis and stave_etal . For the result of this experiment we take the average values of the fitted multipoles using each model along with both the experimental and model error. It can be seen that the model and experimental errors are approximately the same magnitude. There is generally good agreement between the EFT predictions and our experimental results. This also indicates the importance of the pion contribution to these amplitudes. It can also be seen from Table 1 that the dispersion between the original model calculations for the quadrupole amplitudes has been considerably reduced by the fitting. For the EMR the RMS deviation in the original models is reduced from 0.56% to 0.20%. For the CMR the RMS deviation in the original models is reduced even more, from 0.82% to 0.26%.
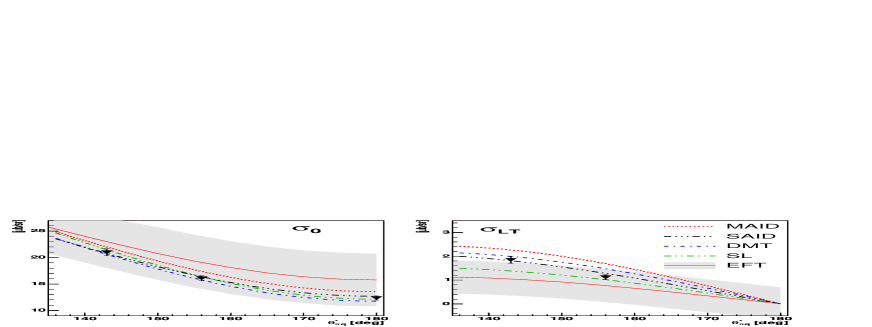
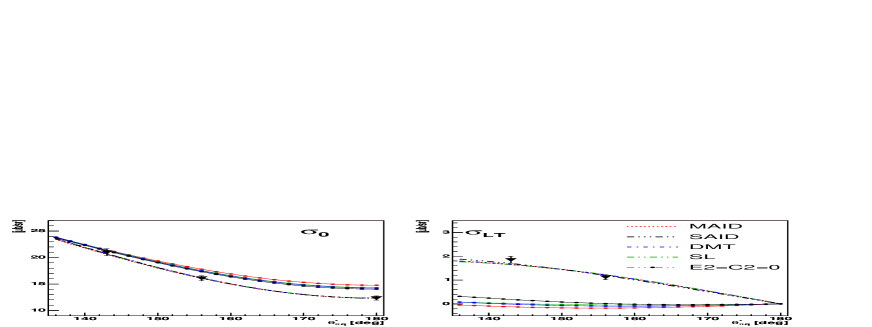
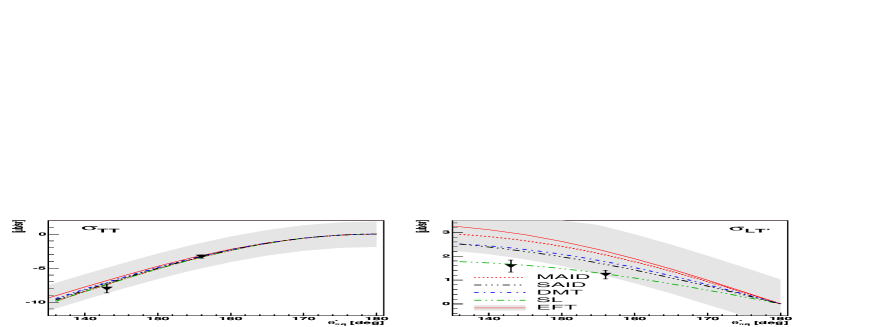
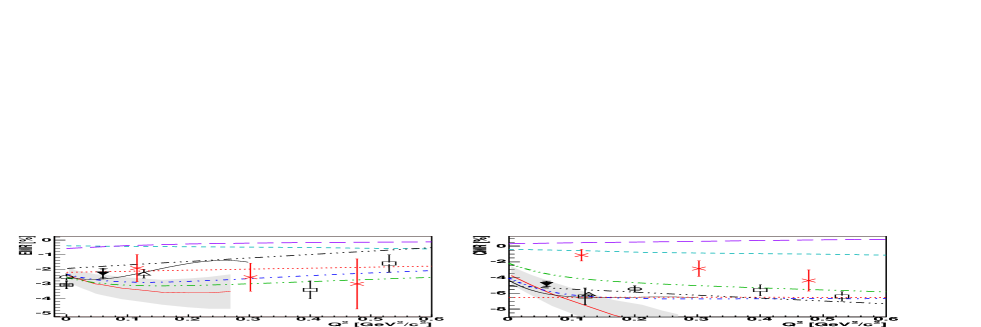
Figure 3 shows the evolution of the multipole ratios at low . There is reasonable consistency of the results from the different laboratories. The plotted lattice QCD results, with a linear pion mass extrapolationalexandrou , are in general agreement with the data for the EMR but disagree for the CMR by a wide margin. The EFT analysis of Pascalutsa and Vanderhaeghen(PV) pasc indicates that a linear extrapolation is close to the data for the EMR but results in a considerable underestimation of the CMR. The results of the two chiral calculations gail_hemmert ; pasc are also presented in Fig. 3. As these are effective field theories they contain empirical low energy constants. For Gail and Hemmert this includes fits to the dominant multipole for (GeV/c)2 and for the EMR at the photon point (). In order to achieve the good overall agreement they had to employ one higher order term with another empirical constant. As also can be seen from the large estimated errors of the Pascalutsa and Vanderhaeghen EFT calculationpasc a treatment of the next higher order term is required. In Fig. 3 two representative constituent quark models, the newer hypercentral quark model (HQM)hqm , and an older non-relativistic calculation of Capstick capstick_karl , have been included (the relativistic calculations are in even worse agreement with experiment). These curves are representative of quark models which typically under-predict the dominant multipole by 30% and underestimate the EMR and CMR by an order of magnitude, even predicting the wrong sign. One solution to this problem has been to add pionic degrees of freedom to quark models quark_pion . All of these models treat the as a bound state and therefore do not have the N continuum (i.e., no background amplitudes) so that cross sections are not calculated. The Sato-Lee sato_lee and DMT dmt dynamical reaction models with pion cloud effects bridge this gap and are in qualitative agreement with the evolution of the data. These models calculate the virtual pion cloud contribution dynamically but have an empirical parameterization of the inner (quark) core contribution which gives them some flexibility in these observables. By contrast the empirical MAID maid1 and SAID said represent fits to other data with a smooth dependence.
One way to see the major role played by the pion cloud contribution to the resonant multipoles is that for this case the expected scale for the evolution is GeV2. In these units the range of the present experiment from from 0.060 to 0.20 GeV2/ is 3 to 10 units. Therefore it is not surprising that one should see relatively large changes in the predicted evolution of the resonant multipoles as is shown in Figure 3. It is also clear that there is significant model dependence in these predictions.
In conclusion, the new data are at the lowest measured for modern electroproduction where the dominant pionic contribution is predicted to be increasing. This region is sufficiently low to be able to test chiral effective calculations. These results are in qualitative agreement with lattice calculations with a chiral extrapolation to the physical pion mass pasc , with recent chiral perturbation theory calculations gail_hemmert ; pasc and with dynamical models which explicitly include the pion cloud sato_lee ; dmt . However, all of these calculations require refinements in order to obtain quantitative agreement with experiment. This includes lattice calculations with lighter pion masses and the next order in effective field theory.
We thank L. Tiator, D. Drechsel, T.-S. H. Lee, V. Pascalutsa, M. Vanderhaeghen, T. Gail and T. Hemmert for their assistance with valuable discussions and for sharing their unpublished work. This work is supported at Mainz by the Sonderforschungsbereich 443 of the Deutsche Forschungsgemeinschaft (DFG), University of Athens by the Program PYTHAGORAS of the Greek ministry of Education (co-funded by the European Social Fund and National Resources), and at MIT by the U.S. DOE under Grant No. DE-FG02-94ER40818.
| EMR (%) | CMR (%) | ||
| SAID | [-1.80] | [-5.30] | [40.72] |
| SL | [-2.98] | [-3.48] | [41.28] |
| DMT | [-2.84] | [-5.74] | [40.81] |
| MAID | [-2.16] | [-6.51] | [40.53] |
| Avg. | |||
| GH | -2.66 | -6.06 | 41.15 |
| PV |
References
- (1) D. Drechsel, L. Tiator, eds., Proceedings of the Workshop on the Physics of Excited Nucleons (World Scientific, 2001).
- (2) C.N. Papanicolas, Eur. Phys. J. A18, 141 (2003).
- (3) A.M. Bernstein, Eur. Phys. J. A17, 349 (2003).
- (4) R. Beck et al., Phys. Rev. C61, 035204 (2000).
- (5) G. Blanpied et al., Phys. Rev. C64, 025203 (2001).
- (6) K. Joo et al., Phys. Rev. Lett. 88, 122001 (2002).
- (7) V.V. Frolov et al., Phys. Rev. Lett. 82, 45 (1999).
- (8) G.A. Warren et al., Phys. Rev. C58, 3722 (1998).
- (9) C. Mertz et al., Phys. Rev. Lett. 86, 2963 (2001).
- (10) C. Kunz et al., Phys. Lett. B564, 21 (2003).
- (11) N.F. Sparveris et al., Phys. Rev. Lett. 94, 022003 (2005).
- (12) T. Pospischil et al., Phys. Rev. Lett. 86, 2959 (2001).
- (13) P. Bartsch et al., Phys. Rev. Lett. 88, 142001 (2002).
- (14) D. Elsner et al., Eur. Phys. J. A27, 91 (2006).
- (15) S.L. Glashow, Physica A96, 27 (1979).
- (16) S. Capstick, G. Karl, Phys. Rev. D41, 2767 (1990).
- (17) D.H. Lu, A.W. Thomas, A.G. Williams, Phys. Rev. C55, 3108 (1997); U. Meyer, E. Hernandez, A.J. Buchmann, Phys. Rev. C64, 035203 (2001); M. Fiolhais, B. Golli, S. Sirca, Phys. Lett. B373, 229 (1996).
- (18) T. Sato, T.S.H. Lee, Phys. Rev. C63, 055201 (2001).
- (19) S.S. Kamalov et al., Phys. Lett. B522, 27 (2001).
- (20) T.A. Gail, T.R. Hemmert (2005), nucl-th/0512082.
- (21) V. Pascalutsa, M. Vanderhaeghen, Phys. Rev. Lett. 95, 232001 (2005).
- (22) D. Drechsel, L. Tiator, J. Phys. G18, 449 (1992).
- (23) K.I. Blomqvist et al., Nucl. Instrum. Meth. A403, 263 (1998).
- (24) P. Mergell, U.G. Meissner, D. Drechsel, Nucl. Phys. A596, 367 (1996).
- (25) S. Stave, PhD dissertation (unpublished), MIT (2006).
- (26) F. James and M. Roos, Comput. Phys. Commun. 10, 343 (1975).
- (27) S. Stave et al., to be published by AIP in the Proceedings of the Workshop on the Shape of Hadrons, Athens, Greece, 27-29 Apr 2006, C.N. Papanicolas and A.M. Bernstein, editors.
- (28) D. Drechsel, O. Hanstein, S.S. Kamalov, L. Tiator, Nucl. Phys. A645, 145 (1999).
- (29) R.A. Arndt et al., Phys. Rev. C66, 055213 (2002), http://gwdac.phys.gwu.edu.
- (30) C. Alexandrou et al., Phys. Rev. Lett. 94, 021601 (2005).
- (31) M. De Sanctis et al., Nucl. Phys. A755, 294 (2005).