Light-Ion-Induced Multifragmentation:
The ISiS Project
Abstract
An extensive study of GeV light-ion-induced multifragmentation and its possible interpretation in terms of a nuclear liquid-gas phase transition has been performed with the Indiana Silicon Sphere (ISiS) 4 detector array. Measurements were performed with 5-15 GeV/c p, , and beams incident on 197Au and 2-5 GeV 3He incident on natAg and 197Au targets. Both the reaction dynamics and the subsequent decay of the heavy residues have been explored. The data provide evidence for a dramatic change in the reaction observables near an excitation energy of E*/A = 4-5 MeV per residue nucleon. In this region, fragment multiplicities and energy spectra indicate emission from an expanded/dilute source on a very short time scale (20-50 fm/c). These properties, along with caloric curve and scaling-law behavior, yield a pattern that is consistent with a nuclear liquid-gas phase transition.
keywords:
4 detector array,multifragmentation,reaction dynamics, nuclear density, reaction time scale, caloric curve, scaling laws, liquid-gas phase transitionPACS:
25.70.Pq, 25.55.-e, , , , , , , , , , , , , , , , , , , ,
Contents
1. Introduction
2. The ISiS Experimental Program
3. Reaction Dynamics
3.1 Excitation Energy Deposition
3.2 BUU Simulations
3.3 Sideways Peaking
4. Statistical Decay Multifragmentation
4.1 Calorimetry
4.2 Thermal Observables
4.2.1 Fragment Spectra
4.2.2 Multiplicities
4.2.3 Charge Distributions
4.3.4 Cross Sections
4.2.5 Source Charge
4.3 Breakup Density and Expansion
4.4 Breakup Time Scale
5. Thermodynamics
5.1 The Caloric Curve: Isotope-ratio Temperatures
5.2 The Caloric Curve: Density-dependent Fermi Gas Temperatures
5.3 Heat Capacity
6. The Liquid-Gas Phase Transition: Scaling Law Behavior
7. Summary and Conclusions
8. Acknowledgements
1 Introduction
One of the most important signals of the formation of hot nuclear matter is the emission of nuclear clusters, or intermediate-mass fragments (IMF: 3 Z 20). From studies of the IMF yields in energetic nuclear reactions one hopes to gain greater insight into the thermodynamics of highly-excited nuclei and the nuclear equation-of-state at low densities. An important aspect of such studies is the identification of a possible nuclear liquid-gas phase transition [1, 2, 3].
IMF emission was first observed in the 1950’s, when beams of protons and alpha particles with energies in the GeV range became available. Emulsion and radiochemical measurements of the reaction products showed that the probability for cluster emission increased strongly with beam energy, suggesting their association with the decay of highly excited nuclei. The emulsion measurements also provided evidence for multiple fragment emission, or multifragmentation. These data led to the concept that the reaction mechanism could be schematically viewed in terms of a two-step intranuclear cascade/statistical emission model, with IMFs emitted primarily in the evaporation stage. One complication with this model was the observation that lighter clusters exhibited forward-peaked angular distributions, suggesting that a prompt non-statistical mechanism must also be present. Another perceptive proposal was that pion production and reabsorbtion could be a major mechanism for excitation-energy deposition in the heavy residual nucleus[4, 5]. These studies, carried out at Lawrence Berkeley Laboratory, Brookhaven National Laboratory and in Russia, laid the groundwork for future studies and are reviewed in [6, 7, 8, 9].
The development of silicon semiconductor detectors in the 1960’s made it possible to perform measurements of inclusive IMF yields and kinetic energy spectra. Bombardments of heavy targets with 5 GeV protons provided a more systematic understanding of the earlier work, and showed clearly the existence of two mechanisms for IMF production – one equilibrium-like and the other a fast nonequilibrium process [10, 11]. An important aspect of the spectra was a downward shift in the apparent Coulomb barrier relative to lower energy reactions. It was suggested that this shift was due to a modified density distribution, perhaps due to an expanded source. Later, similar inclusive measurements with protons up to 350 GeV [12] confirmed radiochemical studies that indicated the IMF emission probability reaches a maximum near 10 GeV and remains constant thereafter [13]. These later measurements also tracked the evolution of the Coulomb peak displacement with beam energy, and found its onset to be near 4 GeV. This result was interpreted as a possible sign of critical behavior [1, 14], and stimulated widespread interest in this possibility.
To search for more conclusive evidence of a phase transition and critical behavior, it was necessary to develop large-solid angle detector arrays to provide fragment kinetic-energy spectra, multiplicity information, event topology and calorimetry. Among the most important features of such a device are: (1) nuclide (Z and A) identification of all products, including neutrons, (2) spatial characterization with good granularity; (3) low detection thresholds; (4) good energy resolution over a large dynamic range and (5) efficient, reliable detector calibration techniques. Another important factor in detector design is the geometry imposed by reaction kinematics; e.g. IMF fragment distributions are nearly isotropic in light-ion-induced reactions, with a small component in the beam direction, whereas they are strongly forward-focused in heavy-ion reactions.
With improvements in detector and data-acquisition techniques, it became possible to construct complex detector arrays for performing exclusive measurements that met most, but not all, of the above conditions for complex fragments. The first such array was the LBL Plastic Ball/Wall [15], which demonstrated the existence of events with high multiplicities of IMFs and light-charged particles (LCP: Z = 1,2) [16]. Later measurements at LNS Saclay confirmed the high IMF multiplicities and yield dependence on bombarding energy [17]. These measurements also showed that the IMF spectral peak energies decreased as a function of increasing multiplicity, consistent with the expansion scenario. Subsequently, several 4 detector arrays were constructed for the study of light-ion induced multifragmentation: the EOS TPC [18], the Berlin Silicon/Neutron Ball [19], the Dubna FASA array [20] and the Indiana Silicon Sphere (ISiS) [21]. At the same time heavy-ion accelerator technology had advanced to the stage where it became possible to study multifragmentation in A + A reactions, which lead to the construction of several additional detectors [22, 23, 24, 25, 26, 27]. At the outset it should be stressed that there is general concordance among the results of all of these projects with those from ISiS, as can be found in [27]. In the following sections, we survey the salient results of the ISiS program with GeV light-ion projectiles, and address the question: is there evidence for a nuclear liquid-gas phase transition?
2 The ISiS Experimental Program
The Indiana Silicon Sphere project was initiated in the late 1980’s with a specific focus on GeV light-ion-induced reactions on heavy nuclei. Light ions bring a unique perspective to multifragmentation studies in that they emphasize the thermal properties of the disintegrating residue, with minimal distortions of the spectra due to rotational and compressional effects. Experimentally, GeV light ion beams form only one emitting source, which decays in a reference frame that is very close to that of the source frame (source velocities 0.01c). In addition, the energy-deposition mechanism produces a continuous distribution of excitation energies, permitting broad coverage of the excitation energy distribution in a single reaction.
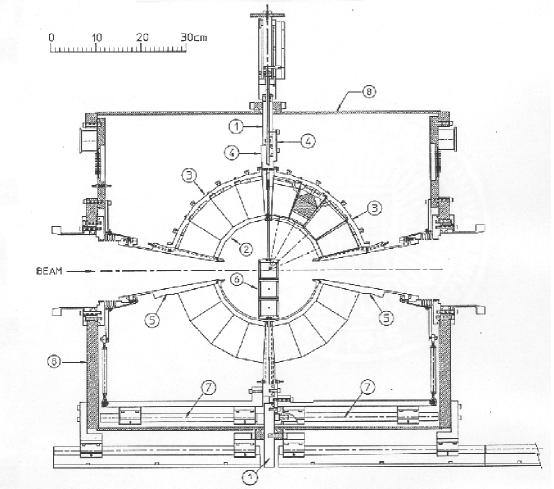
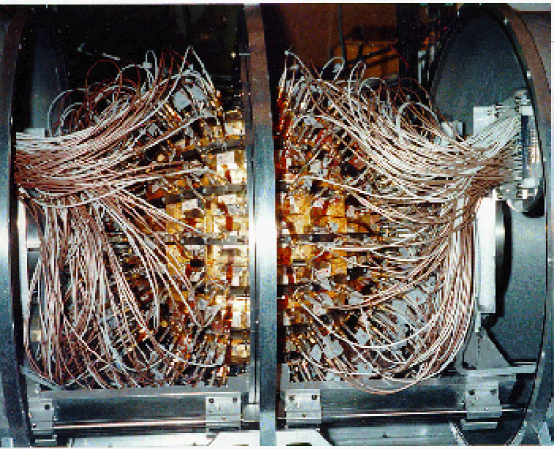
Based upon previous inclusive and semi-exclusive studies [17], the ISiS 4 array was designed in a spherical geometry, with very low detector thresholds and a large dynamic range for LCPs [LCP = H and He] and IMFs [21]. Particle identification was based on triple telescopes composed of an ion-implanted silicon detector, preceded by a gas-ion chamber for low energy fragments and followed by a CsI (T) crystal for the most energetic particles, primarily LCPs. An overall schematic diagram of ISiS is shown in Fig. 1, accompanied by a photo in Fig. 2. The array consists of 162 particle-identification telescopes, 90 covering the angles 14∘-86.4∘ and 72 spanning 93.6∘-166∘. The telescopes are arranged in eight rings, each of which is composed of 18 truncated ion-chamber housings. In the forward-most ring, the Si and CsI detectors were divided into two segments to increase granularity. Detector acceptance was 74% of 4.
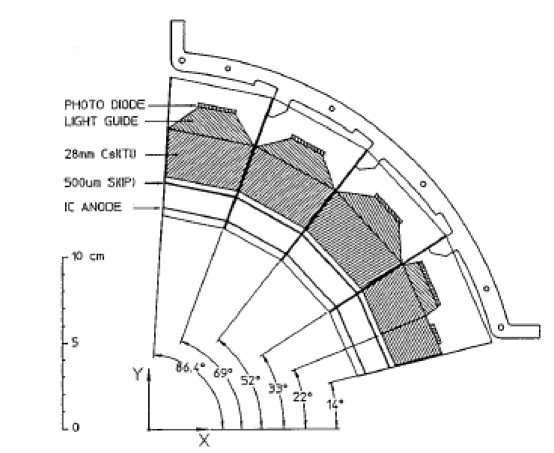
A schematic drawing of the detector telescopes is shown in Fig. 3. The detectors are mounted in gold-plated, high-conductivity copper cans. The first element in each telescope (E) is an axial-field gas-ionization chamber (GIC), operated at 200 V and a pressure of 15-20 Torr of C3F8 gas. These conditions permitted identification of fragments with energies as low as 0.8 MeV/nucleon. All detectors operate in a common gas volume in each hemisphere, with vacuum isolation provided by a 120-150 g/cm2 stretched polypropylene window covered with a thin graphite coating. The ion chambers are followed by an ion-implanted silicon detector of thickness 500 m, which is sufficient to stop E/A 8 MeV LCPs and IMFs. The GIC-Si telescopes provided Z resolution for Z = 1 – 16 fragments in the energy interval from E/A 0.8-8.0 MeV. Due to the GIC energy resolution, mass identification was not possible in the GIC/Si pair. The final element of each telescope was a 28 mm-thick CsI(T) crystal, read out by a photodiode. These crystals provided an energy acceptance of 1 MeV E/A 92 MeV. The Si-CsI(Tl) pair provided Z and A identification for 8 MeV E/A 92 MeV particles and “grey particle” detection for fast protons and pions up to 350 MeV. The ISiS telescopes did not detect neutrons or Z-identify heavy residues and fission fragments.
Detector signals were shaped and amplified by means of charge-sensing preamplifier/linear shaper NIM units, with gains custom-designed for each detector type. Analog signals were digitized by 12-bit 16-channel peak-sensing ADCs and fast signal discrimination and multiplicity sensing was accomplished with 16-channel discriminators and time-to-digital converters. Voltages for each detector type were supplied by in-house-designed, computer-controlled bias supply units.
The event hardware trigger was generated from the fast outputs of the discriminators and required a minimum of three detected particles. This criterion was imposed by the high backgrounds associated with synchrotrom accelerators and biased the data against low-excitation energy events (E*A 1 MeV). In software, only events with three thermal particles, one of which with Z 2, were accepted. More complete details for the ISiS array can be found in [21].
Three multifragmentation campaigns were carried out with ISiS: (1) E228 with 1.8 -4.8 GeV 3He ions at the Laboratoire National Saturne in Saclay, France; (2) E900 at the Brookhaven AGS accelerator with 5.0-14.6 GeV/c proton and beams; and (3) E900a at AGS with tagged 8.0 GeV/c antiproton and beams. The number of events with each beam is summarized in Table 1.
In the following sections we present the results obtained with ISiS. We first examine the collision dynamics, then the thermal observables, and finally the thermodynamics and scaling-law behavior of the data.
| Beam | Target | Energy/Momentum | |||
|---|---|---|---|---|---|
| 197Au | 5.0 GeV/c | 8.0 GeV/c∗ | 8.2 GeV/c | 9.2 GeV/c | |
| (1.0 106) | (2.5 106) | (2.4 106) | (1.4 106) | ||
| p | 197Au | 6.2 GeV/c | 9.2 GeV/c | 12.8 GeV/c | 14.6 GeV/c |
| (2.4 105) | (1.7 106 ) | (1.4 106) | (1.1 106) | ||
| 197Au | 8.0 GeV/c∗ | ||||
| (5.5 104) | |||||
| 3He | natAg | 1.8 GeV | 3.6 GeV | 4.8 GeV | |
| (4.9 106) | (3.0 106) | (1.9 106) | |||
| 197Au | 1.8 GeV | 4.8 GeV | |||
| (4.0 105) | (2.9 106) | ||||
| ∗tagged beam | |||||
3 Reaction Dynamics
3.1 Excitation Energy Deposition
In GeV light-ion-induced reactions the dissipation of radial beam energy into internal excitation of the target-like residue proceeds through a complex fast cascade of nucleon-nucleon collisions. This mechanism is abetted by the excitation of and higher resonances, followed by the reabsorbtion of some of the decay pions [28, 29, 30, 31, 32]. For antiproton beams, excitation-energy deposition is further enhanced by the reabsorbtion of some fraction of the 4-5 annihilation pions [33]. Although the energy dissipation process is relatively inefficient, the cascade step is capable of imparting up to 2 GeV of excitation energy in heavy nuclei. Equally important, randomized/equilibrated residues are produced with a continuous distribution of excitation energies, essentially providing nearly a complete excitation function in a single reaction.
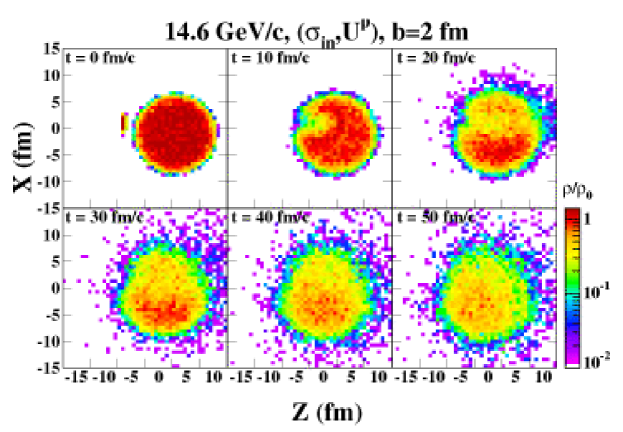
Fig. 4 depicts the predictions of a BUU (Boltzmann-Uehling-Uhlenbeck) calculation [34, 35] that traces the time and density evolution of a central (b = 2.0 fm) collision between a 14.6 GeV/c proton and a 197Au nucleus. Initially, a local density depletion develops along the projectile trajectory as forward-focused nucleons are ejected on a fast time scale. After about 30 fm/c the nuclear matter density becomes more uniform, indicating a random distribution of nucleons. However, the average density is observed to be significantly lower than that of the original target, creating a hot, dilute nucleus. As the reaction time increases, the angular distribution of the emitted particles becomes more isotropic. At this point the distinction between low-energy cascade nucleons (nonequilibrium) and evaporative nucleons becomes blurred. Also, it is significant to notice that the heavy residue trajectory has a component transverse to the beam direction.
In Fig. 5 the effect of entrance-channel beam momentum on excitation energy per nucleon (E*/A), average density (/), entropy per nucleon (S/A) and residue mass (A) is explored as a function of time. Calculations are for an impact parameter b = 2.0 fm for the p + 197Au reaction at momenta of 6.2, 10.2, 12.8 and 14.6 GeV/c. It is observed that the excitation energy and entropy per nucleon increase with beam momenta, while the source mass and average density decrease. At long reaction times there is little difference in E*/A and / indicating a saturation in these variables. Also, in all cases the entropy per nucleon remains nearly constant beyond 30-40 fm/c, consistent with the existence of a randomized system. The most significant dependence on increasing beam momentum is the systematic decrease in residue mass, or in terms of the emitted particles, a greater contribution to the cascade/nonequilibrium yield.

All p + A reaction dynamics calculations predict that the excitation energy probability decreases exponentially with increasing excitation energy. For this reason, it is of interest to investigate the relative efficiency of different hadron probes in depositing excitation energy. Fig. 6 shows results of an intranuclear cascade calculation [31, 36, 37] for the average excitation energy (E* 50 MeV) as a function of beam momentum for proton, negative pion and antiproton beams. For the p and cases there is little difference, since the cascades follow similar paths. On the other hand, the annihilation pions from the interaction enhance E* significantly. The inset in Fig. 6 demonstrates that the excitation-energy distribution for antiprotons is expected to extend to higher values than for protons and pions.

In comparing the predictions of the dynamics codes with experimental data, the primary quantities of interest are the energy deposited in the statistical residue E* and its mass A. To do so, however, requires separation of cascade/preequilibrium emissions from those associated with the equilibrium-like heavy residue prior to event reconstruction. This calorimetry procedure is described in Sec. 4.1.
In Fig. 7 we show the reconstructed probability distributions for excitation energy and residue mass for several systems studied in this work. The reconstructed E* distributions shown in the left panel of Fig. 7 demonstrate that the largest population of high excitation-energy events is achieved with the 8.0 GeV/c beam and the lowest with the 5.0 GeV beam. Thus, the data are qualitatively in agreement with the INC calculations (intranuclear cascade) shown in Fig. 6, although the calculations extend to somewhat higher energies than the data. The residue mass distributions in the right panel of Fig. 7 show a different pattern. In this case the 14.6 GeV/c proton beam produces the lightest residues and the 5.0 GeV/c beam the heaviest, a result relatively well reproduced by the calculations. This mass dependence on beam momentum can be understood as a consequence of the fast cascade, which produces an increasing number of fast knock-out particles as the beam momentum increases [28, 32]. This process produces the saturation in excitation energy observed for hadrons with momenta greater than 8 GeV/c. That is, the increase in total beam energy available for E* deposition is counter-balanced by the the loss of energy due to mass loss A during the fast cascade.
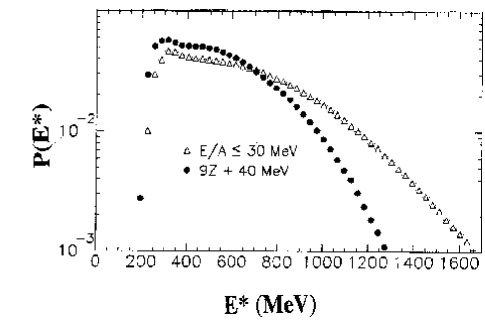
The relative effectiveness of various beams in depositing high excitation energies (Fig. 7) is emphasized in the bottom panel of Fig. 8. Included here are comparable data from the 4.8 GeV 3He + 197Au reaction [38] and from the 1.2 GeV + 197Au reaction [39]. In order to emphazise the probability for forming highly excited systems, all data are normalized to probability P(E*) = 1 at E* = 400 MeV.


Fig. 8 confirms that the 8.0 GeV/c beam produces a significant enhancement of high excitation energy events, particularly in the multifragmentation region above E* 800 MeV. This figure further supports the predictions of the cascade code; i.e., enhanced E* with beams, saturation above 8 GeV/c beam momentum, and exponentially-decreasing probabilities for high E*/A values. The behavior of the 3He beam can be understood as due to its average beam momentum of 2.6 GeV/c per nucleon.
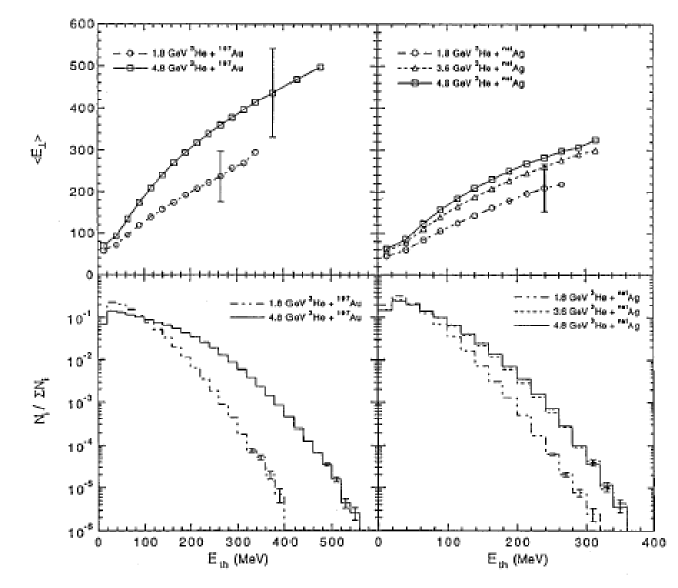
Another perspective on the influence of reaction dynamics is provided by studies with 3He beams [40, 41]. Fig. 9 shows the probability distribution of the total observed thermalized energy and the correlation with the transverse fragment kinetic energies for the 3He + natAg and 197Au reactions. The thermal energy, which is strongly correlated with excitation energy, is significantly lower for the lighter natAg target. However, when source mass corrections are made, the energy per nucleon distributions are very similar for both targets [40]. The projectile-target effect on the saturation of excitation energy with beam energy is in good agreement with INC calculations [30, 41] for this lower momentum, complex projectile. The lower right-hand frame of Fig. 9 shows that the probability distributions are identical for the 3He + natAg at 3.6 and 4.8 GeV, indicating the onset of deposition energy saturation near 3.6 GeV. The slight difference at 3.6 and 4.8 GeV for the transverse energy correlations is due to the difficulty in removing nonequilibrium events from this sum, which illustrates the uncertainties involved with the use of transverse energy as a gauge of excitation energy depostion.
3.2 BUU Simulations
While the equilibrium-like events are of primary interest for multifragmentation studies, the nonequilibrium component of the spectrum is important for understanding the reaction dynamics. In order to investigate this facet of the data, predictions of a BUU code that includes d, t and 3He cluster formation have been compared with cascade/preequilibrium d/p, t/p and 3He/p ratios for the p + 197Au reaction between 6.2 and 14.6 GeV/c [34, 35]. BUU calculations were performed for various reaction times with and without a momentum-dependent potential and with both free and in-medium cross-section options. Results for the 14.6 GeV/c p + 197Au reaction are shown in Fig. 10. From examination of the LCP ratios for all four bombarding energies, the best agreement with all the data is found when both a momentum-dependent potential and in-medium cross-sections are employed in BUU code, with a most probable reaction time of t 65 fm/c. From comparison with Fig. 5, entropy considerations suggest that randomization of the nucleon momenta in the heavy residue occurs after about t 30 fm/c, indicating an additional 30-40 fm/c is required to reach a state of quasiequilibrium, after which the residue undergoes statistical decay.

Further, the BUU calculation that incorporates clusters, a momentum-dependent potential, in-medium cross sections and a time scale of t 65 fm/c is able to describe the excitation-energy probability distribution and the average source Z and A as a function of E*/A. One important aspect of this code is that the inclusion of clusters serves to enhance energy deposition in the heavy residue. This feature is missing in other codes designed for transport calculations with GeV hadron beams.
3.3 Sideways Peaking
Finally, the ISiS data demonstrate the important role that reaction dynamics exert on the statistical decay properties of hot residues. Earlier inclusive studies [42, 43, 44] showed the existence of sideways peaking of IMF angular distributions for p + A reactions above 10 GeV. This result was interpreted as possible evidence for dynamical IMF emission during the initial phases of the cascade, possibly signaling the existence of nuclear shock wave effects. Exclusive IMF angular distributions obtained with ISiS support a more mundane origin for the sideways peaking.
In [45] it is confirmed that the sideways peaking develops only above beam momenta of 8-10 GeV/c and that degree of peaking increases as IMF multiplicity and charge increase. This result indicates that the peaking is associated with high deposition energy collisions, where multifragmentation is the major decay mode. In Fig. 11 relative angular distributions for Z = 5-9 fragments produced in M 4 events are compared for reactions with 5.0 GeV/c (left panel) and 14.6 GeV/c p (center panel) beams on a 197Au target. Fragment kinetic-energy cuts of E/A = 1.2-3.0, 3.0-5.0 and 5.0-10.0 MeV are imposed on the spectra and all angular distributions are normalized to unity at 160∘. (In this regard it should be stressed that most of the cross section is concentrated in the kinetic energy bins below 5 MeV.) It is observed that as the IMF kinetic energy decreases, the angular distributions become increasingly isotropic for both energies. However, whereas for the beam the angular distributions remain forward-peaked, for the 14.6 GeV/c proton case sideways peaking is observed – and the maximum differential cross section evolves to larger angles as the IMF velocity decreases.
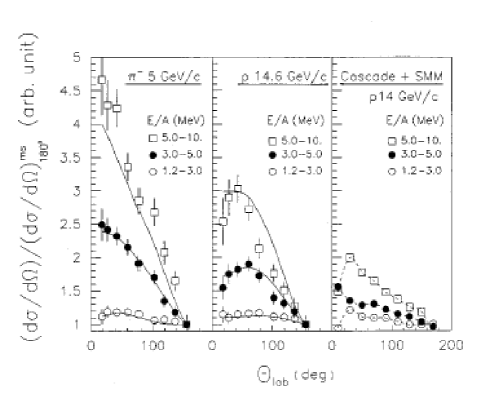
The observation that sideways emission is favored by high beam momentum, high IMF charge and low IMF kinetic energy suggests a possible origin in the kinematics of the residue rather than in dynamical emission. The diffractive nature of the initial N-N collision at GeV momenta preferentially produces a secondary nucleon or N* that recoils 70∘ - 90∘ to the beam axis, with the angle growing as the beam momentum increases. Subsequent dissipation during the cascade imparts a transverse velocity component to the heavy residue. The net result is that statistical fragment emission from the residue is focused non-axial to the beam direction – which affects the lowest energy IMFs most strongly. This conjecture is reinforced by INC/SMM (Statistical Multifragmentation Model) calculations [31, 46], shown in the right-hand frame of Fig. 11 and is also illustrated in Fig. 4. Thus, these results, coupled with IMF-IMF angular correlations and sphericity and coplanarity distributions, described in [47], do not support arguments for dynamical effects such as shock waves as a source of sideways-peaking observed in inclusive angular distribution studies.
4 Statistical Decay: Multifragmentation
4.1 Calorimetry
In any attempt to describe a system in terms of thermodynamics, a knowledge of the heat content is fundamental. For hot nuclei, this energetic factor is expressed in terms of the excitation energy per residue nucleon, E*/A. In this section we examine the procedures for determining E* and A for the ISiS data [40, 48, 49].
For each reconstructed event, the excitation energy of the emitting source is calculated as follows:
| (4.1) |
Here Kcp is the kinetic energy for all thermal charged particles, Mn is the multiplicity of thermal neutrons with average kinetic energy , Eγ is the total energy emitted by gammas, and -Q is the removal energy (the negative of the reaction Q-value). Each of these terms requires assumptions, as described in the following.
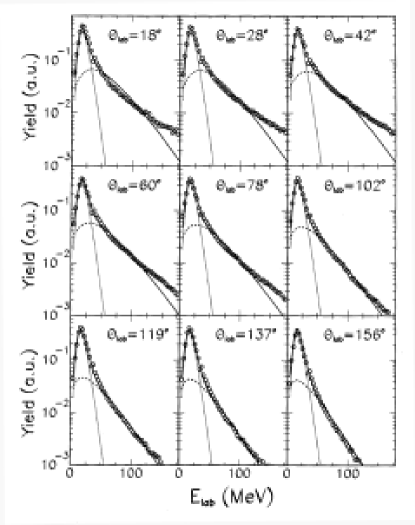
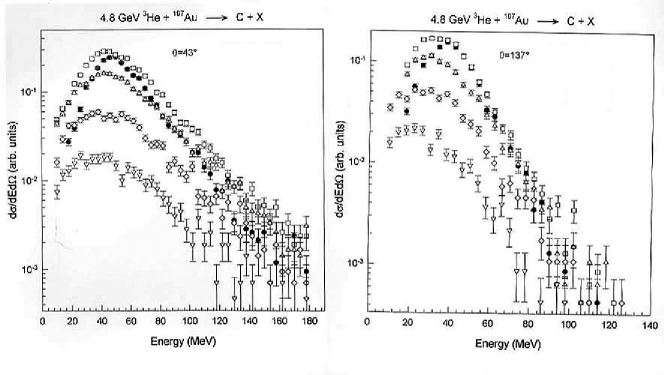
In calculating the charged particle contribution to E* in Eq.(1), cascade/preequilibrium emissions prior to thermalization must be removed from the sum. Separation on an event-by-event basis is not fully transparent due to the time evolution of the cooling process. Fig. 12 presents angle-integrated spectra for Z = 1,2,3 and 6 nuclei from the 8.0 GeV/c + 197Au reaction. Because source velocities are low ( 0.01 c), kinematic effects are small. The principal features of the spectra are a Maxwellian low-energy component, which we attribute to thermal events, and an exponentially-decreasing high-energy tail due to nonequilibrium processes.
The spectra have been decomposed [41, 48, 49] with a two-component moving-source model [50]. In Fig. 12 the thermal source [51, 52] is described by the dashed lines, the nonequilibrium source [50] by dotted lines and the total by the solid line. The nonequilibrium component is most important for the hydrogen isotopes, but is also a significant fraction of the He yield. In the proton case the two-component model is insufficient to account for the high-energy portion of the spectrum, suggesting evidence for three components: thermal at low energies, preequilibrium at intermediate energies, and fast cascade particles at the highest energies. Such a picture is consistent with the BUU transport calculations in Sec. 3. As seen in Fig. 13, nonequilibrium emission persists, even at the most backward angles. Fig. 13 also illustrates the weak-angular dependence of the spectra. For IMFs, the nonequilibrium component decreases in yield as the IMF charge inreases. For carbon and heavier IMFs, the angle-integrated preequilibrium yield is negligible.

Since H and He isotopes constitute most of the charged-particle yield, calorimetry requires a systematic procedure for distinguishing between thermal and nonequilibrium emissions on an event-by-event basis. This need was a primary motivation for the moving-source fits to the spectra. From moving-source analyses of all the spectra from the 1.8-4.8 GeV 3He + 197Au reaction [41], it was concluded that a sharp cutoff approximation gave a satisfactory account of the fraction of thermal events in the spectra. The thermal cutoff values were:
| (4.2) |
| (4.3) |
These cutoffs are indicated by the arrows in Fig. 12, and correspond approximately to the break in the slope of the spectral tails. This method of determining the thermal yield was also compared with the integrated yield from the two-component fits, which led to slightly lower E* values [48]. For the calculation of excitation energy in this work, the cutoff values of Eqs. (4.2) and (4.3) were employed. The resulting thermal yields are isotropic in the center-of-mass frame [48].
In contrast the E* analysis of the EOS 1 GeV 197Au + 12C data [53] used a sharp cutoff assumption of E/A 30 MeV for all fragments. This approach yields significantly higher E* values, as shown in Fig. 14, largely due to the inclusion of preequilibrium He ions in the sum of Eq. (1). When this difference is taken into account, the ISiS and EOS experiments are in good agreement in those areas where they overlap. While the EOS calibration may lead to high E* values, the ISiS sharp cutoff approximation may underestimate E* for high excitation energies. This problem is illustrated in Fig. 15 where the LCP kinetic energy spectra are plotted for several E*/A bins. The sharp cutoff distinction is clear at low excitation energies, but the two components blend into one as E*/A increases, blurring the separation.

The second major uncertainty in determining E*/A for the ISiS data is the unmeasured neutron contribution to both the thermal sum in Eq. (1) and the cascade/preequilibrium multiplicity as it affects the source mass [40, 48]. In order to estimate the thermal-like neutron component, we have normalized the neutron charged-particle correlations reported by [39] to the ISiS charged-particle results. The measured correlations, shown in Fig. 16, are reasonably well described for charged-particle multiplicity M 4 by model simulations [46, 54] and show the same qualitative behavior as has been observed in heavy-ion reactions [55]. A mass-balance procedure [56] does not work well for the ISiS data. The rapid rise in neutron multiplicity at low energies, where charged-particle multiplicities are low, makes the ISiS E* values increasingly uncertain below E* 200 MeV.
Several assumptions have been employed in order to estimate the average neutron kinetic energy as a function of E*/A. For the 4.8 GeV 3He reactions was estimated from Coulomb-corrected proton spectra and then iterated to obtain a consistent value , where and a = A/11 MeV-1 [40]. For the hadron-induced reactions several relationships were explored, including Fermi-gas and It should be noted that the IMF yield is actually largest for the E/A = 1.2-3.0 MeV bin and smallest for the 5.0-10.0 MeV bin. Maxwell-gas assumptions with level density parameters a = A/8 MeV-1 and a = A/13 MeV-1 [48]. Comparisons were also made with SMM [46] and SIMON [54] evaporation codes. Based on this analysis, the SMM predictions were used as a conservative estimate of the neutron kinetic energy contribution to E*. Eq.(4.1) is then iterated to obtain self-consistency. This procedure produced a somewhat lower neutron kinetic energy contribution than in [40]. For both the neutron multiplicities and kinetic energies, the use of averages leads to loss of fluctuation information in the final excitation energies.

The sharp-cutoff and neutron assumptions, along with the detector geometry, are included in the detector filter. The minor contribution to Eq. (4.1) from gamma emission is assumed to be E = 2(M) MeV in [40] and E = M(Z 3) MeV [48]. In order to calculate the removal energy (-Q), the charge and mass of the source must be reconstructed. The source charge is determined from
| (4.4) |
and the mass from
| (4.5) |
where Ztgt and Atgt are the charge and mass of the target, Zi(neq) is the charge of the measured cascade/preequilibrium particles, and the nonequilibrium neutron multiplicity is related to the nonequilibrium proton multiplicity by . The assumption for is consistent with BUU calculations [35] and experimental results [59], and is intermediate between the A/Z of the target and experimental systematics [60]. The unmeasured IMF mass is based on the isotopically-resolved data of [61]. In the calculation of E*/A the resultant Q values and neutron multiplicities partially offset one another in Eq. (4.1); e.g., if the neutron term is over-estimated, then the removal energy is reduced, and vice versa.
Several second-order corrections have been investigated and found to have no significant effects, among them: the source velocity ( 0.01c), source emission angle [58], and detector threshold effects. Since ISiS does not measure heavy residues, the additional assumption is made that all missing mass and charge are contained in a single residue. The residue mass distribution obtained in this way is in good agreement with measured results from [53]. The consistency of the ISiS calorimetry filter has been tested with SMM [46] and SIMON [54] calculations that use the measured source mass, charge and excitation energy as inputs to the codes [48]. One final consideration is the effect of the exponential decrease in the E*/A probability with increasing E*/A, which serves to decrease the excitation energy relative to the bin average. This effect is most significant for the highest excitation energy bins when the measured distribution is deconvoluted.
The relative fractions of the excitation energy for the LCP, IMF and neutron kinetic energy contributions to Eq. (4.1) are plotted in the top frame of Fig. 17. Over the full range of E*/A the LCP fraction ranges from 25-30%, and that for neutrons from 20-25%, accounting for over half of the total E*. The IMF kinetic energy fraction is relatively small, ranging from negligible values at low excitation energies to a near-constant value of 10-12% above E*/A 6 MeV. In the bottom frame of Fig. 17 the excitation energy fraction due to removal energy (-Q) is compared with the fraction for total kinetic energy. Except for low E*/A, where the calorimetry is most uncertain, the total kinetic energy sum is a near-constant factor of two greater than the removal energy.
Overall we estimate that the values chosen for the ISiS E*/A data and associated assumptions could reasonably be lowered by 5% or increased by 15%. In the following sections we examine the data as a function of the calorimetric E*/A procedure described in this section.

4.2 Thermal Observables
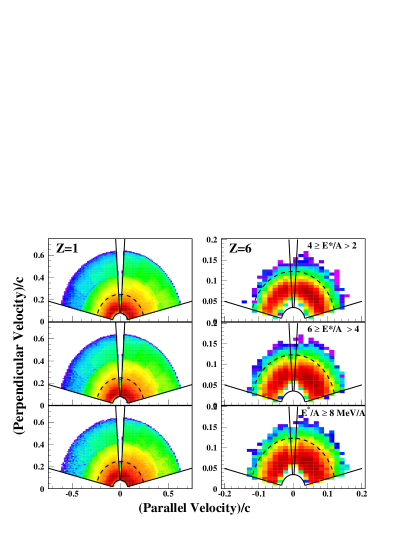
Of the many experimental signals for thermal behavior in hot nuclei, the most transparent are found in the evolution of the spectra as a function of excitation energy. Two fundamental tests that a statistically-decaying system must face are: (1) is particle emission isotropic? and (2) are the kinetic energy spectra Maxwellian? In Fig. 18 invariant cross sections (parallel v∥ versus perpendicular v⟂) velocity components are shown as a function of excitation-energy bins for hydrogen and carbon ions measured for the 8.0 GeV/c + 197Au reaction. For energetic hydrogen ions (v 0.2c) at all E*/A one observes a spray of forward-emitted particles that originates in cascade/preequilibrium processes. The low-energy part of these plots is nearly symmetric about zero velocity, indicating emission from a randomized source moving with an average velocity of 0.01c. The ISiS acceptance for thermal-like particles is defined by the dashed line in Fig. 18, i.e., the sharp cutoff assumption of [41]. The isotropy of the projected angular distributions for thermal LCP and IMF emission, as well as the relative insensivity to excitation energy, has been demonstrated in [47, 48]. In addition, an event-shape analysis for the thermal IMFs from the 4.8 GeV 3He + 197Au reaction is found to be consistent with the existence of a randomized system that disintegrates on a very short time scale [47].
4.2.1 Fragment Spectra
The Maxwellian character of the LCP and IMF kinetic-energy spectra is illustrated in Figs. 12, 13, and 15. Figures 12, 13 and 18 show the systematic Coulomb shift in the spectral peaks due to kinematic behavior and fragment charge. Figure 12 reveals two opposing trends that become apparent when the LCP spectra are gated on E*/A. First, the thermal slopes become flatter as E*/A increases, the expected result of the increasing temperatures. In contrast, instead of showing the expected temperature-dependent increase in the spectral (Coulomb) peak energies for a system at normal nuclear density, the spectral peak energies decrease. The net effect of these opposing effects is that the average mean kinetic energy for thermal particles is essentially independent of excitation energy, as shown in Fig. 19. This figure also shows the expected increase in the average kinetic energy as a function of fragment charge. Within the context of Figs. 15 and 19, the observed fragment mean kinetic energies can be interpreted in terms of a compensation between two competing factors: an increase in temperature offset by a decrease in the source density as the excitation energy increases. This behavior is explored in greater detail in Sec. 4.3.

4.2.2 Multiplicities
An important signature of multifragmentation, and its possible relation to a nuclear liquid-gas phase transition [3, 62, 63], is the multiplicity of IMFs in an event. The models predict that above E*/A 4-5 MeV, multiple IMF emission should appear. Figure 20 examines this prediction, presenting the average IMF multiplicity (top frame), emission probabilities for a fixed multiplicity (middle frame) and the probability for emitting three or more IMFs relative to two or less (bottom frame). The unmeasured heavy residue is not included in these probabilities and M is derived from a Monte Carlo reconstruction of the measured fragment multiplicity N that accounts for detector geometry and thresholds.
In the top frame the IMF multiplicity is shown to increase monotonically, with no apparent deviation near E*/A 5 MeV. However, when the averages are decomposed into specific probabilities (middle frame), it is observed that as E*/A increases, the probability for increasing NIMF opens up systematically with increasing excitation energy. The probability for emitting three or more IMFs (the classical definition of multifragmentation [3]) is seen to grow rapidly near E*/A 4 MeV, so that above E*/A 5 MeV multifragmentation becomes the dominant decay channel. This growth in IMF multiplicity is accompanied by a corresponding growth in the thermal LCP multiplicity.

4.2.3 Charge Distributions
Another important aspect of the multifragmentation mechanism is the distribution of fragment sizes (Z), of relevance to the question of critical phenomena and the liquid-gas phase transition. The ISiS charge distributions have been analyzed in terms of a power-law function, , shown in Fig. 21. The results are nearly identical for all of the hadron-induced reactions and behave similarly for the 3He + 197Au data [47]. At the lowest excitation energies, the large values of the power-law exponent imply that small fragments dominate the charge distribution, consistent with lower-energy proton-induced reactions [61, 64, 65]. As the system is heated, values decrease, signifying the increasing tendency to form larger clusters. A minimum in is reached near E*/A 5-6 MeV, corresponding to the rapid increase in IMF multiplicities. The tendency to form lighter clusters at high excitation energy is most likely due to the dissolution of the larger clusters in the heat bath and/or the formation of highly-excited clusters that undergo secondary decay. The average variances of the Z distributions have also been measured [66] and the relation of both and the average variance is discussed in Sec.6 with regard to phase transition arguments.

4.2.4 Cross Sections
Comparison of the excitation-energy distribution in Figs.7 and 14 and the IMF multiplicity probabilities in Fig. 20 demonstrates that multifragmentation is a small fraction ( 10%) of the total cross section in these light-ion reactions, most likely originating in the lowest impact-parameter collisions. For the 3He beams the calculated total reaction cross section is approximately 2000 mb for the 197Au target and 1400 mb for natAg [67, 68]. For the hadron-induced reactions, the reaction cross section is about 1900 mb [67, 68]. The multifragmentation (M 3) cross section ranges from about 50 mb for the 5 GeV/c beam to 100-125 mb at the higher energies, where excitation-energy saturation occurs.
In Table 2 the cross section dependence on target, beam energy and IMF multiplicity is presented for the 3He-induced reactions. The yields clearly increase with target mass and projectile energy, with cross sections that range from 9 mb for the 1.8 GeV 3He + natAg case to 190 mb for the 197Au target at 4.8 GeV. The effect of excitation-energy saturation in the natAg system near 3.5 GeV bombarding energy is evident.
| 3He + natAg | 3He + 197Au | |||||
| Ebeam (GeV) | 1.8 | 3.6 | 4.8 | 1.8 | 4.8 | |
|---|---|---|---|---|---|---|
| MIMF | cross section (mb) | |||||
| 1 | 140 | 160 | 190 | 270 | 300 | |
| 2 | 28 | 77 | 98 | 66 | 170 | |
| 3 | 7.4 | 26 | 28 | 14 | 110 | |
| 4 | 1.3 | 6.4 | 6.5 | 2.9 | 54 | |
| 5 | 0.2 | 1.2 | 1.2 | 0.5 | 20 | |
| 6 | 0.03 | 0.2 | 0.2 | 0.1 | 6.6 | |
| 7 | - | - | - | - | 1.8 | |
| 8 | - | - | - | - | 0.4 | |
| 9 | - | - | - | - | 0.1 | |
| 10 | - | - | - | - | 0.02 | |
| – | – | – | – | – | ||
| 8.9 | 34 | 36 | 18 | 190 | ||
| 170 | 270 | 320 | 350 | 660 | ||
| (total) | 220 | 430 | 490 | 460 | 1300 | |
4.2.5 Source Charge
Determination of the Z and A of the emitting source, as well as the unmeasured heavy residue(s), is also an important component of the reconstruction process described in Sec. 4.1. In the top frame of Fig. 22 the average fraction of the source charge relative to the target charge is shown as a function of E*/A. As the excitation energy increases, the effect of nonthermal particle emission becomes quite strong, leading to average source charges of Z 60 at E*/A 8 MeV. The middle frame of Fig. 22 shows the average missing charge in our reconstruction procedure, assumed here to be a single fragment. Comparison with the SMM model [46] gives good agreement and these values closely correspond to the largest fragment distribution observed in the EOS 1 GeV 197Au + 12C reaction (when corrected for differences in thermal excitation energy). [53].

Beyond E*/A 6 MeV the assumed fragment corresponding to the missing charge (Zmax1) is an IMF (Z 20). Finally, in the bottom frame of Fig. 22 the average charges of the second (Zmax2) and third (Zmax3) largest fragments are shown as a function of excitation energy. The sizes of the second and third largest fragments remain nearly constant above E*/A 5-6 MeV, in line with the results of Fig. 21, and are also in relative accord with SMM predictions up to E*/A 7-8 MeV. At higher excitation energies the data and SMM diverge, most likely due to the storage of excess excitation energy in fragments in the model, leading to secondary decay. This divergence suggests that the fragments are emitted relatively cold, as argued in [69].
In summary, the thermal observables from the ISiS data present a picture of a system that decays isotropically from a source with velocity 0.01 c. Above E*/A 5 MeV multifragmentation (M 3) becomes the dominant decay mode and the spectra suggest emission from a dilute/expanded source. Near this energy the largest fragments are formed. Thus, these signals are qualitatively consistent with expected observables from a liquid-gas phase transition and in the following sections we examine this question in greater depth.
4.3 Breakup Density and Expansion
A knowledge of the dependence of nuclear density on thermal excitation is of central importance to our understanding of nuclear compressibility and the equation-of-state of finite nuclear matter. In addition, the breakup density is particularly relevant to models of multifragmentation phenomena, which assume that at sufficiently high temperatures, thermal pressure and Coulomb forces drive nuclear expansion and subsequent disintegration of the system [3, 46, 54, 62, 63]. Perhaps the most direct experimental signal of the breakup density is provided by the centroids of the peaks of the IMF kinetic energy spectra as a function of E*/A, as mentioned in previous sections and in [10, 13, 47, 48, 64, 70].
Breakup densities have been derived from the systematic Coulomb shifts of the spectral peaks for a series of IMF data sets that span the excitation-energy range E*/A = 0.9 to 7.9 MeV. Inclusive data were analyzed for the 200-MeV 4He + 197Au [71] and E/A = 20-100 MeV 14N + 197Au [70] reactions. Exclusive data were based on the 4.8 GeV 3He + 197Au reaction [72]. The spectra for each system were measured with low kinetic-energy thresholds and covered nearly the entire 180 degree angular range. The threshold/angle criteria are essential for obtaining stable moving-source fits, which require very good definition of the low-energy component of the spectra. Details of the analysis are discussed in greater detail in [72] and [73]. Representative IMF kinetic-energy spectra for carbon fragments from the 4.8 GeV 3He + 197Au system are shown in Fig.23 as a function of E*/A. The decrease in the peak centroids with increasing excitation, opposite of expectations for a thermal source at normal density, is evident.
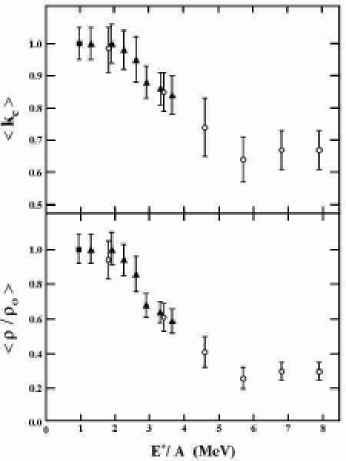
The spectra were analyzed in terms of a two-component (three for 14N) moving-source model [50] consisting of a thermal-source described by a transition-state formalism [51, 52], a nonequilibrium source that assumes a Maxwellian shape, and for 14N, a projectile-breakup source. The thermal source, of primary interest for this analysis, included the following parameters: the source velocity, a fractional Coulomb term kC, a spectral slope temperature and a barrier fluctuation variable. The decreasing Z of the source with E*/A was also taken into account. This formalism is designed primarily for binary breakups. For multifragmentation events, it is assumed that this procedure provides a first-order approximation to the Coulomb field that exists between a given IMF and the average of the residual nucleons. For density determinations the average fractional Coulomb parameter kC for IMFs is the sensitive parameter and is determined relative to fission fragment kinetic energy systematics [72, 73]. In the top frame of Fig. 24 values of the Coulomb parameter are plotted versus E*/A, where kC = 1 corresponds to nuclei at normal density . Most striking about Fig. 24 is the sharp decrease in in the excitation-energy interval E*/A 2-4 MeV, suggesting emission from a source with a modified Coulomb field. It is also of note that this decrease matches the major changes in other reaction variables, as shown in Sec. 4.2.
In order to obtain the breakup density, it is assumed that for these light-ion-induced reactions the thermal source is spherical and expansion is radially symmetric. In this case, from Coulomb’s law the density expression reduces to
| (4.6) |
since , where rC is the mean separation distance at breakup. The result is shown in Fig. 24 where / is plotted as a function of E*/A. Up to E*/A 2 MeV the density appears to correspond to normal density. Between E*/A 2 and 5 MeV, Fig. 24 indicates a systematic decrease in density from / 1.0 to / 0.3. Above E*/A 4 MeV, a nearly constant value of / 0.30 is found within experimental error.
In summary, this spectral-shape analysis indicates that above E*/A 2 MeV, nuclear breakup occurs from an increasingly expanded/dilute configuration. Beyond E*/A 4 MeV, a value of / 0.3 is found, consistent with the predictions of multifragmentation models [46, 62]. Finally, the relative constancy of / at high excitation energies suggests that a limiting breakup density has been reached [74, 75].
The energy that drives expansion and subsequent multifragmentation is usually attributed to either internal thermal pressure [76] or the response to compressional forces produced in the early stages of the target-projectile interaction [77]. As discussed in Sec. 3, model calculations of the reaction dynamics for the systems studied in this work provide little or no evidence for compression-decompression effects. Instead, the fast cascade creates an initial residue with lower than normal nuclear density and high thermal energy. Thus, in highly asymmetric collisions at GeV energies, only the thermal pressure and Coulomb field are of primary relevance to the subsequent expansion process.
Two stages of thermal expansion leading to multifragmentation can be schematically defined. The first drives the nucleus to the breakup configuration, where repulsive Coulomb forces exceed the restoring nuclear force. Although the breakup density beyond this point may remain nearly constant, as in Fig. 24, the increasing heat content of the source may lead to an additional source of radial expansion energy (or flow); i.e., the thermal energy that exceeds the minimum necessary to reach the breakup density, defined here as excess expansion energy, . The impact of the excess expansion energy on the spectra will be an increased flattening of the high-energy spectral slope, over and beyond that expected for the freezeout density and temperature [78].
In order to investigate the possible contribution of , it is necessary to choose a reference point that accounts for thermal and Coulomb contributions to the fragment kinetic energies. For this purpose, three statistical models have been employed: SMM [46, 79], SIMON-explosion and SIMON-evaporation [56]. In order to minimize any contamination from possible preequilibrium emissions in the data, we compare the calculations with the measured average fragment kinetic energy, for which preequilibrium contributions to the tails of the spectra are negligible. The inputs to all three models were the same, using the source charge, mass, velocity and excitation-energy distributions for the reconstructed data (Sec.4.1), and then passed through the ISiS filter.

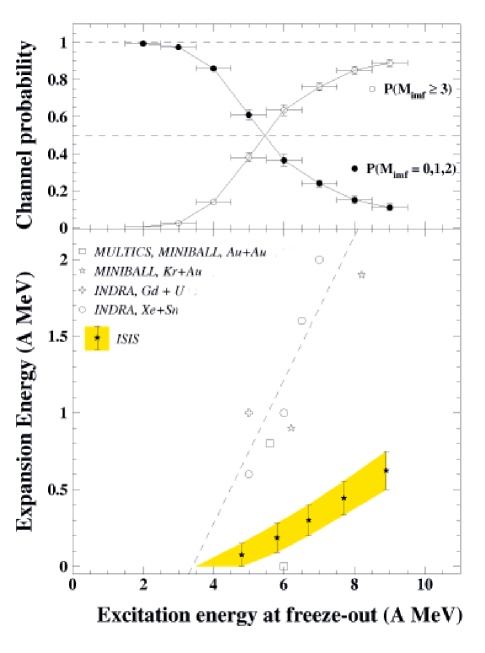
In Fig. 25 the calculations are compared with mean fragment kinetic energies as a function of fragment charge for excitation-energy bins, E*/A = 4-6 and 6-9 MeV. The evaporative model underpredicts the data substantially, although it does give reasonable agreement for E*/A 3 MeV. Both of the simultaneous multifragmentation models describe the mean kinetic energies, as well as the multiplicity and charge distributions, for E*/A = 4-6 MeV bin. However, for the E*/A = 6-9 MeV bin both models fall below the data. This shortfall is attributed to the existence of excess thermal expansion energy. Using the SMM model as a reference point, the excess expansion energy is extracted from the difference between the model and the data. In Fig. 26 the results are plotted versus E*/A. This analysis indicates that the threshold occurs near E*/A 4 MeV and then gradually increases to 0.5 AIMF MeV at E*/A = 9 MeV. This amount of energy, while small, must be taken into account when performing the calorimetry (Sec. 2). In contrast, central heavy-ion reactions show a much more dramatic increase in the excess expansion energy, also shown in Fig. 26, suggesting that the excess expansion energy observed in heavy-ion collisions may be related to the dynamical stage, perhaps due to initial compression.
To summarize, moving-source analyses of the IMF spectra show a systematic downward shift in the Coulomb peaks, supporting a picture in which the breakup density decreases as a function of excitation energy, even after correcting for nonequilibrium charge loss. While the density remains nearly constant above E*/A = 5 MeV, the flattening of the spectral slopes suggests a small, but measurable excess breakup energy that increases nearly linearly as /AIMF = (0.1 E*/A)-0.4 MeV.
4.4 Breakup Time Scale
Central to any interpretation of multifragmentation events in terms of a liquid-gas phase transition is the question of time scale. For evaporative cluster emission from the liquid phase at low excitation energies, fragments are produced from the surface via a binary sequential decay mechanism. This process requires relatively long emission times of order 1000 fm/c at low excitation energies [80]. In contrast, when the spinodal boundary of the phase diagram is crossed, the system falls apart on a near-simultaneous time scale via bulk emission from the entire nuclear volume.
Information about the emission time scale can be extracted by means of the intensity-interferometry technique, which probes the mutual Coulomb repulsion between fragment pairs emitted in proximity to one another in space and time [81, 82, 83, 84]. This technique constructs the correlation function R for fragment pairs of reduced velocity ,
| (4.7) |
Ncorr is the measured coincidence yield, while Nuncorr is the uncorrelated yield calculated with the event-mixing technique [83], and the normalization C is performed relative to the integral yields of each [85].
The reduced velocity is given by
| (4.8) |
where vi and Zi are the laboratory velocity and charge of the fragments, respectively. The denominator permits comparison of different IMF Z values.

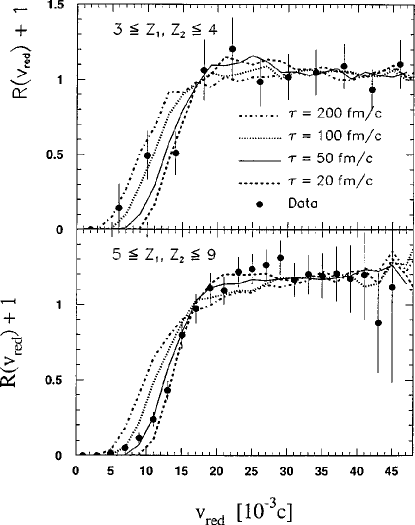
Experimental IMF-IMF (4 Z 9) correlation functions from hadron-induced reactions on 197Au between 8.0 and 11.2 GeV/c are shown in Fig. 27 for several excitation-energy bins. Pairs emitted in close proximity to one another in space and time (low vred) experience a supression in yield due to their mutual Coulomb interaction (Coulomb hole). Between E*/A = 2.25 and 5.0 MeV the Coulomb hole increases, followed by a nearly constant supression at higher excitation energies. This effect is in qualitative agreement with heavy-ion studies [86, 87].
In order to extract the emission time scale, an N-body Coulomb trajectory calculation [84, 88] has been performed, using the experimental source and final product properties as input [85]. The only adjustable parameters in the simulation are the source volume, or separation distance between the residue and the fragments. The filtered output of the simulation must reproduce both the small- and large-angle correlation data, as well as the fragment charge distribution and kinetic energy spectra. These conditions impose a significant constraint on space-time ambiguities in the simulation. For purposes of calculating the Coulomb energy, the separation distance is defined as
where r0 = 1.22 fm. Values of d between 2-6 fm provide the best fits to the data and are consistent with the density results described in the previous section. The emission time t is assigned via an exponential probability distribution, e, where is the decay lifetime.
In Fig. 28 the experimental correlation functions are compared with simulations for a range of d and time values that yield minimum chi-squared values. Between E*/A= 2.0-2.5 and 4.5-5.5 MeV the emission time decreases by an order of magnitude, from 500 fm/c to 20-50 fm/c. Above E*/A 5 MeV the emission time becomes very short and nearly independent of excitation energy, consistent with a near-instantaneous breakup scenario. Similar results have been shown for the 4.8 GeV 3He + 197Au reaction, as shown in Fig. 29 [89]. Here the experimental gating is performed for all fragments from events with E*/A 5 MeV. Again the results are consistent with breakup times between 20-50 fm/c for that fraction of the yield that falls in the multifragmentation regime.

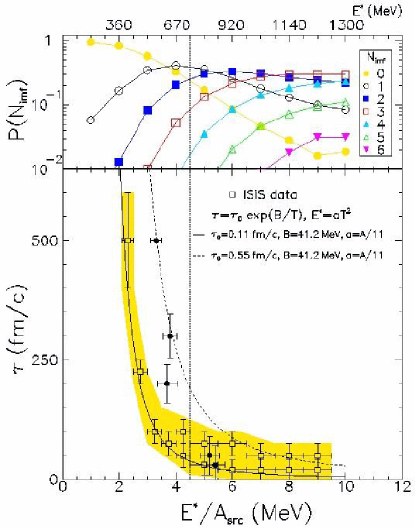
The lower panel of Fig. 30 presents the best-fit decay times for events in which two or more IMFs are emitted in hadron-induced thermal multifragmentation of 197Au nuclei. For reference the individual IMF multiplicities are shown in the upper panel. The decay lifetimes at low excitation energy are consistent with an evaporative mechanism, while at higher energies the very short lifetimes support a near-simultaneous breakup. The shaded band in Fig. 30 covers the range of space-time values that provide a consistent fit to all of the observables. Also shown in Fig. 30 are results for heavy-ion reactions [90], which yield similar results, but somewhat longer lifetimes at low energies.
In summary, the time scales derived from the intensity-interferometry analysis demonstrates the evolution from the evaporative to near-simultaneous breakup regime. As with the multiplicity, spectra and density evolution discussed in Secs. 4.1-4.3, the time scale determinations provide a strong case for an interpretation in terms of a transition from surface to bulk emission in the excitation energy interval between E*/A 3-5 MeV.
5 Thermodynamics
5.1 The Caloric Curve: Isotope-ratio Temperatures
One of the most stimulating early results of multifragmentation studies was the excitation energy versus temperature curve, or caloric curve, proposed by the ALADIN group [91]. By plotting temperatures derived from double-isotope ratios [92] as a function of excitation energy, a result was obtained that resembles the heating of liquid water to the vaporization phase. Subsequent experiments, including those described in this section, produced similar results [75]. From the systematic behavior of these data, Natowitz has derived a value of the critical temperature of 16 1 MeV for infinite nuclear matter and a nuclear compressibility constant K = 232 30 MeV [93].
In order to construct the heating curve for the ISiS data, the heat content was based on the calorimetry described in Sec.4.1. The double-isotope-ratio technique for defining temperature is limited for the ISiS data due to the high thresholds for isotope identification. The isotope-ratio temperatures T were calculated according to the prescription of Albergo [92], with correction factors proposed by Tsang [94],
| (5.1) |
Here B is a binding-energy parameter, a is a statistical factor dependent on ground-state spins, and R is the double-isotope ratio. For ISiS, useful isotope identification is restricted to LCPs so that the relevant ratios are
| (5.2) |
| (5.3) |
where all ratios involve only thermal LCPs.
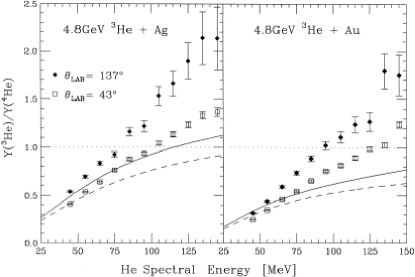
The definition of thermal LCPs, as discussed in Sec. 4.1, can lead to variability in the value of T that is obtained. For p/d and d/t ratios, there is only a small sensitivity to particle kinetic energy [49, 72], so the distinction between thermal and preequilibrium particles is of minor significance due to the logarithmic nature of Eq. 5.1. In contrast, as shown in Fig. 31, the 3He/4He ratio increases strongly with kinetic energy [40, 49, 72]. Thus the controlling factor in determining T is the 3He/4He ratio, which is dependent on the thermal cutoffs assumed in the calorimetry.
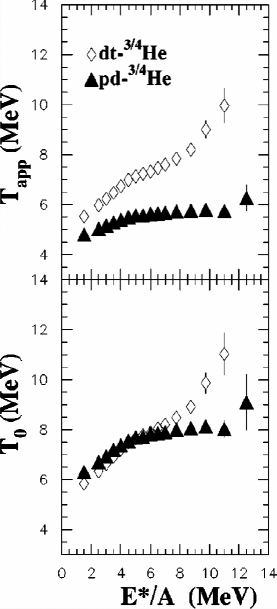
In Figs. 32 and 33 the temperature versus E*/A curves are shown for the 4.8 GeV 3He + 197Au system [40] and the 8.0 GeV/c + 197Au system [49], respectively. For the 3He-induced reaction, which uses only the dt-He ratio, there is no plateau, but a slope change is observed above E*/A 2 MeV. While the temperature increases from about T = 5-7 MeV in the E*/A 2-10 MeV range, it deviates markedly from a simple Fermi gas prediction (dotted curves in Fig. 32).
Also shown in Fig.32 are comparisons with INC/EES (Expanding, Emitting Source) [30, 62] and INC/SMM [30, 46] models. SMM comparisons assume the fragments are emitted cold; comparisons with model parameters that produce hot fragments deviate strongly from the data [49]. For both model comparisons the solid lines are predictions with the experimental cuts defined in Sec.4.1 imposed on the model spectra. The results provide fair agreement with the data. With the experimental cuts removed (dashed curves), the caloric curves are lowered by 1-1.5 MeV per nucleon, yielding better agreement with other caloric curves. The difference between the results with and without the experimental cuts on the model is traced to the fact that the thresholds for isotope identificaton in ISiS fall above the spectral peaks, where the 3He/4He ratio is much lower [96, 61] (i.e., R is larger and T is smaller). Also shown in the right frame of Fig. 32 is the thermodynamic temperature predicted by the SMM model.
In Fig. 33 the caloric curves for the + 197Au reaction are compared for the pd-He and dt-He thermometers. The top frame shows the results without the Tsang [94] corrections. With the correction applied, both thermometers demonstrate a break in the curve above E*/A 3-4 MeV, with the pd-He ratio yielding a more distinct plateau. At the highest excitation energies for the dt-He case there is an indication of an upturn in the caloric curve above E*/A 10 MeV, suggestive of possible entrance into the vaporization regime. Similar results have been observed in other experiments and are also seen in the 4.8 GeV 3He data, although the effect occurs at excitations where statistics are low and fluctuations large. However, this behavior is absent with the pd-He thermometer. Thus, while the high E*/A dt-He results are intriguing, they are not convincing.
The differences in temperature between the slope/plateau regions for the 4.8 GeV 3He and 8.0 GeV/c reactions can be traced to two factors. First, the kinetic-energy thresholds were lower in the former case and second, the energy acceptance bins were not quite the same. The net effect is that the 3He/4He ratio is lower for the 4.8 GeV 3He measurements; i.e., R is larger and T lower.
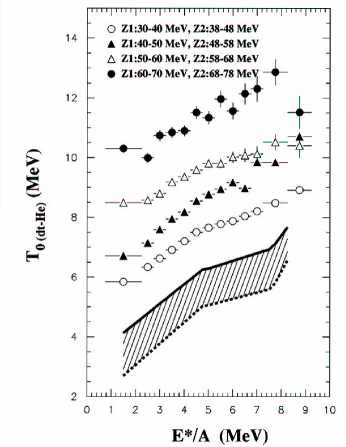
The temperature dependences on 3He/4He ratio can be used to track the evolution of the de-excitation process leading up to thermalization, under the assumption that the most energetic emissions are emitted earliest [97, 98, 99]. Such a “cooling curve” is shown in Fig. 34 for the 8.0 GeV/c + 197Au reaction, where Coulomb-corrected 10-MeV-wide bins have been placed on LCP spectra [49]. Note that the higher energy bins correspond to the hard exponential tails of the spectra in Fig. 12. The corresponding T vs. E*/A calculation reveals a systematic decrease in the isotope-ratio temperatures as the kinetic energy bin for the LCPs decreases. The observed sequence of caloric curves can be interpreted as evidence for the preequilibrium cooling stage between the initial cascade and thermalization stages. An alternative explanation is provided by time-dependent EES model, for which particles are emitted sequentially from an expanding, cooling source [62].
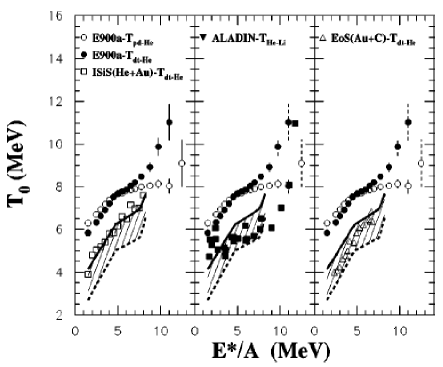
Due to the systematic trends of Fig. 34 and the lack of mass-resolved data in ISiS in the Coulomb-peak region below E/A = 8 MeV, the isotope- ratio temperatures would be lower if extrapolated to the thermal LCP peak yields. To examine this correction, a linear fit was performed on the cooling curves of Fig. 34 and then extrapolated to the Coulomb peak region for element-identified LCPs, shown in Fig. 12. The shaded area in Fig. 34 shows this extrapolation. Figure 35 compares the caloric curves from similar systems with the ISiS data. The left-hand frame shows the difference between the observed and corrected ISiS results and emphasizes the sensitivity of the isotope-ratio thermometer to the energy acceptance for the LCPs. The center- and right-hand frames compare the ISiS results with the ALADIN peripheral Au + Au [91] and EOS Au + 12C results [18, 53] respectively. Reasonable consistency is observed with the corrected ISiS caloric curve and the systematics of Natowitz [75].
5.2 The Caloric Curve: Density-Dependent Fermi-Gas Temperatures
The density determinations described in Sec. 4.3 suggest an alternative approach to measuring the nuclear temperature. Inherent in the Fermi gas model is the first-order relationship
| (5.4) |
where K() is the density-dependent inverse level density parameter (1/a) and m* is the effective mass. This predicted dependence of temperature on density provides a method for determining nuclear temperatures, independent of isotope ratios. If one assumes that the effective mass ratio is near unity at these high excitation energies, then the ratio of K() to K0, the value of K at normal density, becomes
| (5.5) |
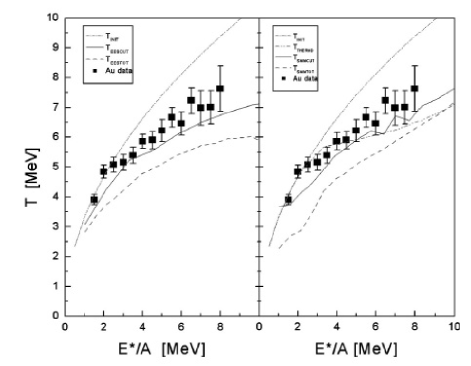
From fits to data below E*/A 2.0 MeV, an empirical inverse level density parameter of = 11.3 MeV for a density-independent Fermi gas is obtained, shown as a dashed curve in Fig. 36. Using this value, Eq. 5.5 becomes
| (5.6) |
When the average densities derived from the IMF spectra [Sec. 4.3 and Fig. 24] are inserted into Eq. 5.6, the resultant temperatures produce the caloric curve shown in Fig. 36. Up to E*/A 2 MeV the temperature rises according to Fermi gas predictions for nuclei at normal density. In the region E*/A = 2-5 MeV a distinct slope change occurs, corresponding to the decrease in breakup density of the emitting source. Above E*/A 5 MeV, Eq. 5.6 with a constant value of 0.30 predicts a simple gradual increase in temperatures given by T = 2.2 . Overall, the density-dependent Fermi gas model yields a caloric curve that is strikingly similar to other caloric curve measurements for similar reactions [91, 53], as well as the corrected caloric curves from ISiS, shown in Fig. 34. This result is consistent with statistical model calculations that assume 1/3 at breakup [3, 46, 63] and in qualitative agreement with the metastable mononucleus model of Sobotka [100]. A second-order analysis [73] of the density data, in which expansion energy is taken into account, shows a 1-2 MeV dip in the plateau near E*/A 5 MeV, but is otherwise similar. Overall, the temperatures derived from the density-dependent Fermi gas model and those from double isotope ratios [94] are in agreement, lending additional support to the concept of caloric curve behavior for hot nuclei.
5.3 Heat Capacity
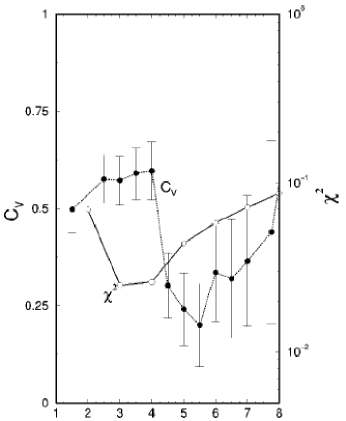
In heavy-ion studies evidence for a negative excursion in the heat-capacity versus excitation-energy curve has been presented by the MULTICS-MINIBALL Collaboration [101]. Based on thermodynamic considerations, this result provides possible evidence for a first-order phase transition [102]. The ISiS data have been examined for such an effect [103] and the results are shown in Fig. 37. A sharp negative deviation in the heat capacity Cv is observed near E*/A 4-5 MeV, consistent with the heavy-ion results [101]. Within experimental uncertainties the minimum in the -squared distribution coincides with the maximum in the Cv curve.
The first-order phase transition argument is reflected in the observations in earlier sections that show near E*/A 4-5 MeV there is a sharp increase in the IMF multiplicity, a rapidly decreasing emission time and density, the onset of excess expansion energy, and a distinct slope change in the caloric curve. The order of the phase transition is discussed further in the following section.
In summary, both the corrected isotope-ratio and density-dependent Fermi-gas temperature versus excitation energy plots show quasi-caloric curve behavior with a transition in the region E*/A 3-5 MeV. Rather than a plateau, the resultant caloric curves show a gradual increase in temperature with added heat, but are well below normal Fermi-gas expectations. By gating on LCP kinetic energies, it is also possible to construct a ”cooling curve” that describes the evolution of the reaction mechanism from the cascade step to thermalization. In addition, a signal for a negative excursion in the heat capacity curve supports heavy-ion data [102] that are interpreted in terms of a first-order phase transition.
6 The Liquid-Gas Phase Transition: Scaling Law Behavior
Given the overall agreement of the ISiS data with the qualitative expectations for a liquid-gas phase transition, several further questions of a more quantitative nature arise. For example, do the cluster size distributions behave according to statistical expectations? How well do the data conform to scaling laws for a phase transition? If so, what are the critical parameters and what is the order of the phase transition?
Statistical behavior is an important question, not a priori obvious for systems that evolve as rapidly as those formed in GeV hadron-induced reactions. At lower energies, where statistical concepts are more appropriate, cluster emission probability distributions can be well-described in terms of a binomial distribution [104],
| (6.1) |
Here,n is the IMF multiplicity, m is the number of chances to emit an IMF, and p is the binary elementary probability. The values of p and m can be extracted from the experimental average multiplicity and its variance,
| (6.2) |
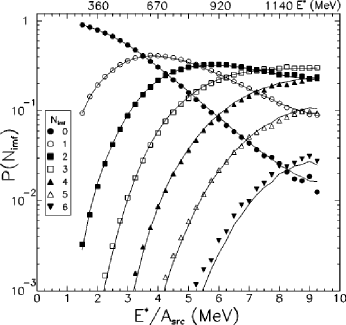
At lower energies it has been found that p is a function of excitation energy, giving rise to the concept of thermal scaling [104]. In order to test whether the ISiS results follow this same statistical pattern, the 8.0 GeV/c Au data have been fit with Eqs. 6.1 and 6.2 [38]. The binomial distribution analysis gives very good agreement with the data up to = 5, as shown in the multiplicity distributions in Fig. 38. Some deviations appear for 6, where statistics become increasingly poor. To investigate the possible dependence of the binomial parameters on collision violence, the reciprocal of the probability factor was plotted versus the total transverse energy, thermal transverse energy and E*/A. The total transverse energy diverges strongly at high energies, reflecting the contribution of preequilibrium processes to the yield. Removal of the preequilibrium component yields an improved scaling fit to the data for the thermal transverse energy. The strongest correlation is found when scaled as a function of E*/A, where a nearly linear dependence is observed, supporting an interpretation in terms of thermal scaling [38].
The evolution of the parameter with excitation energy is shown in Table 3, where correlations with the size of the source Zsrc, total observed charge Zobs and the removal energy(-Q). The one variable that tracks most closely with is the removal energy, suggesting that represents an energy constraint that allows only certain partitions.
| E*/A (MeV) | 2.0 | 3.0 | 4.0 | 5.0 | 6.0 | 7.0 | 8.0 | 9.0 |
|---|---|---|---|---|---|---|---|---|
| m | 3.36 | 4.82 | 5.61 | 6.29 | 6.72 | 7.67 | 8.31 | 7.79 |
| Zsrc | 74.3 | 71.2 | 68.4 | 65.8 | 63.5 | 61.1 | 59.0 | 57.1 |
| Aobs | 8.75 | 15.2 | 21.9 | 28.1 | 33.5 | 38.1 | 42.2 | 45.4 |
| Qvalue(MeV) | -160 | -204 | -249 | -295 | -341 | -383 | -420 | -451 |
The agreement with the thermal scaling concept indicates that p can be expressed by a partial decay width
| (6.3) |
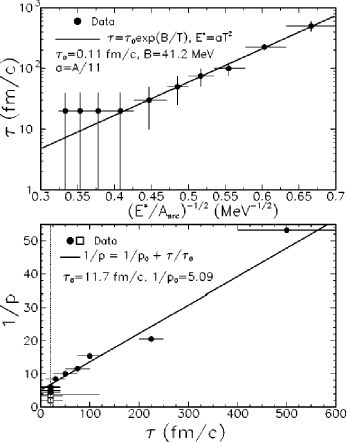
where is interpreted as the frequency of assault on the barrier B at temperatures T [38, 104]. Defining the intrinsic emission time as = 1/, the emission time is given by
| (6.4) |
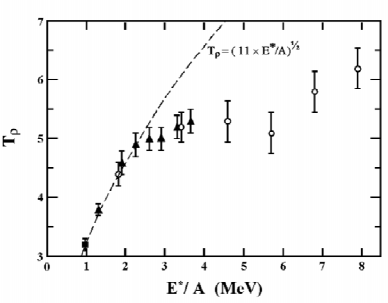
Using the emission times derived in Sec. 4.4, a plot as a function of the thermal scaling variable (E*/A)1/2 shows nearly linear behavior, as seen in the top frame of Fig. 39. The bottom frame of Fig. 39 shows the relation between the lifetime t and 1/p. A simple linear relationship is observed down to emission times of 20 fm/c near E*/A 6 MeV. The evolution of the inverse probability 1/p at higher energies appears to be independent of time, indicating a mechanism charge that favors a space-like (bulk) emission scenario, rather than one that is sequential, as is the case at lower excitations.
The apparent statistical nature of the thermal component of the data justifies further investigation of expected liquid-gas phase transition properties. One method for extracting information relevant to this issue is through a moment analysis of the fragment charge distributions [1, 105]. Calculations with both percolation and statistical multifragmentation models predict that the relative variance of the charge distributions will exhibit maxima of 2.1-2.3 near the critical point. Brzychczyk [66] analyzed the relative moments of the 4.8 GeV 3He + 197Au reaction and found a variance of = 2.3 0.1 near E*/A 5.5 MeV. Thus, the ISiS data are in good agreement with phase transition models and provide further consistency with arguments for a liquid-gas phase transition and possible critical behavior in hot nuclei.
Berkenbusch et al. [106] carried out a global percolation analysis on the 10.2 GeV/c p + 197Au data from ISiS. The bond-breaking probability for the model is determined from the excitation energy via the relation [107]
| (6.5) |
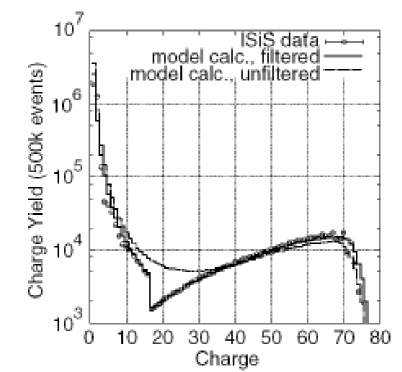
where is the generalized incomplete gamma function, B is the binding energy per nucleon of the source and T is the source temperature, determined from the excitation energy T = and a = A/13 MeV-1. Input to the model utilized experimental values for the excitation energy and source size, with the lattice size fixed by the size of the thermal residue. An important feature of the calculation is that account is taken of the secondary decay of the excited primary fragments, which is particularly important for the fragile Z = 3-5 fragments that comprise most of the IMF cross section.
Figure 40 compares the charge distributions from the data with both filtered and unfiltered percolation values. The discontinuity just above Z = 16 is a consequence of the discrete charge-identification limit in ISiS and the assumption that all unmeasured charge resides in a single fragment. Overall, the filtered percolation yields are in excellent agreement with the data.
For values of the control parameter p near the critical value, pc, the cluster number is predicted to scale as
| (6.6) |
where s is the size of the cluster (Z) and and are the two critical exponents of percolation theory. The scaling function f has the property that ; i.e., the power-law dependence is valid only near . By associating the bond-breaking probability with the temperature and assuming an exponential function for f, the fractional IMF yield becomes
| (6.7) |
where is a normalization parameter and Tc is the critical temperature. Thus, one expects a plot of
to scale exponentially with for all fragment sizes.
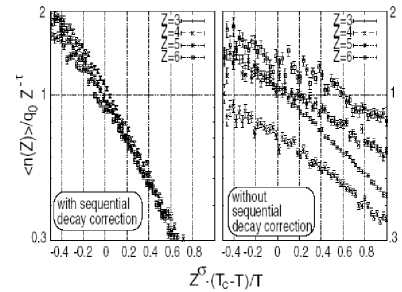
The result of a optimization procedure for the theoretical percolation charge distributions for this system yields values of the critical parameters and , in good agreement with percolation analysis for an infinite lattice, = 0.45 and = 2.18. A similar analysis of the ZIMF = 3-6 data from ISiS produces the results shown in Fig. 41. The right frame shows the inability to achieve scaling when sequential-decay corrections are omitted from the analysis. When corrected for sequential decay, as shown in the left frame of Fig. 41, much better scaling behavior is found. The critical exponents for this finite system, derived from the data, are and (E*/A)c = 5.3 MeV (or Tc = 8.3 MeV for a simple Fermi gas with = A/13 MeV-1).
Since the infinite size limit of the model contains a continuous phase transition for the range of excitation energies covered by the present data set, the scaling agreement between the data and percolation theory can be interpreted as evidence for a continuous phase transition in nuclear matter.
The Fisher Droplet Model [108] provides another avenue for examining the correspondence between IMF emission and a liquid-gas phase transition. Fisher’s model describes the aggregation of molecules in a vapor into clusters. The abundance of a given cluster size A can be written as
| (6.8) |
where in addition to the critical exponents and of Eq. 6.7, nA = , the number of droplets of mass A normalized to the system size ; the difference between the actual and liquid chemical potentials is ; is the zero temperature surface energy coefficient, and . This equation reduces to Eq. 6.7 if .
One approach taken by Elliott et al. [109] is to modify Eq. 6.8 to take into account the Coulomb energy release when a particle moves from the liquid to the vapor phase, which assumes
| (6.9) |
where is defined as follows
| (6.10) |
Here = 1.22 fm and the exponent insures that the Coulomb energy disappears at the critical point. Since IMF masses are not measured in ISiS, it was assumed that A/Z = 2. Temperatures were determined by the Fermi gas approximation of Raduta [110]. IMF acceptance was for IMFs with 5 , for which preequilibrium effects are small [109]. Subsequent modifications of the Fisher model can be found in [111, 112].
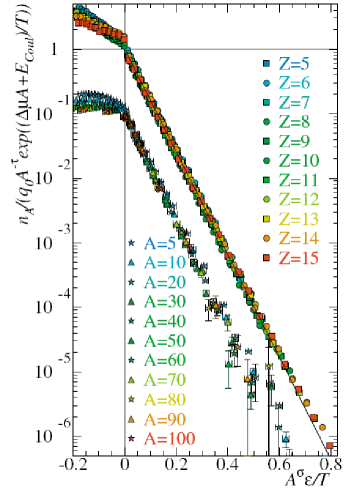
The results of scaling the data according to Eq. (6.9) are shown in Fig.42, where the fragment mass yield is scaled by the power-law prefactor, the chemical potential term and the Coulomb energy. This quantity is scaled by temperature and the surface energy parameter A/T. The scaled data follow Fisher scaling over six orders of magnitude, which suggests that this line represents the liquid-vapor coexistence line. As supporting evidence, also shown in Fig. 42 is the scaled cluster distribution from a d=3 Ising model calculation [113] for a system that undergoes a phase transition.
The values of the critical parameters from the -squared minimization routine are summarized in Table 4 for both the percolation and Fisher scaling analyses. Within errors, the Fisher model values of = 2.28 0.14 and = 0.54 0.01 are in good agreement with those from percolation as well as with earlier work [114, 115]. The surface-energy coefficient Co = 18.3 0.5 MeV is in general accord with the liquid drop value of 16.8 MeV. An important result relevant to previous scaling analyses is that for the first time it has been possible to measure . The measured value of = 0.06 0.03 substantiates the assumption that 0 in previous analyses. Similarly, the value of = 1.0 .06 insures that the Coulomb energy is small and does not affect the scaling significantly.
| parameter | percolation | Fisher |
|---|---|---|
| 2.35 0.05 | 2.18 0.14 | |
| 0.5 0.1 | 0.54 0.01 | |
| Tcrit | 8.3 0.2 MeV | 6.7 0.2 MeV |
| (E*/A)crit | 5.3 0.3 MeV | 3.8 0.3 MeV |
| Co | – | 18.3 0.5 MeV |
| – | 0.06 0.03 MeV/A | |
| – | 1.00 0.06 |
Based on this analysis, the phase transition is first order up to the critical point of excitation energy E/A =3.8 0.3 MeV, above which it becomes continuous. Analysis of the EOS data [18] yielded a value of E/A = 4.75 MeV. However, as discussed in Sec. 3, when the excitation energies are calculated with the same assumptions for elimination of preequilibrium particles, the ISiS and EOS critical energies are the same. The critical temperature for finite nuclei derived from the Fisher scaling analysis is 0.2 MeV. Based on the Fisher scaling parameters derived from the data, it is then possible to construct the two-phase (liquid-gas) coexistence line over a large energy/temperature interval, extending up to the critical point, from which the full phase diagram of nuclear matter can be defined [108].
In summary, the ISiS data are well-described by binomial reducibility and thermal scaling analyses, providing a strong argument for the statistical nature of multifragmentation. Further, scaling with the Fisher model can be used to define the liquid-gas coexistence line, while a percolation analysis supports a continuous phase transition at higher excitation energies.
7 Summary and Conclusions
Both the reaction dynamics and the subsequent decay of hot residues formed in GeV light-ion-induced reactions on heavy nuclei have been investigated with the ISiS detector array. Of primary concern in this effort has been the isolation and characterization of multifragmentation events, believed to be the possible signature of a nuclear liquid-gas phase transition in finite nuclei.
Bombardments with proton, antiproton, pion and 3He beams produce an exponentially-decreasing distribution of excitation energies that extend up to 2 GeV in reactions on 197Au nuclei. The deposition of excitation energy is found to increase as a function of beam energy up to a momentum of about 8 GeV/c for reactions of hadrons with 197Au and an energy of 4 GeV for the 3He + natAg system. For higher beam energies there is little additional increase in deposition energy, presumably due to a tradeoff between beam energy and target transparency. Relative to other hadron beams, the optimum projectile for achieving high excitation energies is found for 8 GeV/c antiprotons, for which the reabsorbtion of some fraction of the decay pions can produce enhanced excitation of the residue. For the same beam momentum, proton and pion beams are nearly identical in their excitation-energy distributions.
The fast LCP component of the spectra has been analyzed with a BUU model that incorporates A = 2 and 3 nuclei in the scattering matrix. Best fits to the data are obtained with a version that includes modified in-medium scattering cross sections and a momentum-dependent potential. As shown in Figs. 4 and 5, the BUU calculations indicate that for central collisions the hot residues are formed in a state of depleted density – due to fast knockout followed by preequilibrium processes that occur on a time scale much faster that the relaxation time. Simulation of the time evolution of the collision dynamics predicts that the entropy per nucleon becomes nearly constant after about 30 fm/c, suggesting a randomized, but not necessarily thermalized system. From comparison of the BUU code with the fast LCP spectra, it is inferred that a total time of about 60 fm/c is required to reach a state of quasi-thermalization.
The most fundamental signature of a liquid-gas phase transition is the observation of events in which an equilibrated hot nucleus disintegrates into multple LCPs and IMFs. For this purpose, thermal events have been selected that are shown to decay isotropically in the center-of-mass system with Maxwellian kinetic energy spectra from which nonequilibrium components have been removed. The cross sections for these events is of order 100 mb.
Figure 43 summarizes several important features of the data that demonstrate a distinct change in reaction mechanism at an excitation energy of E*/A 4-5 MeV – all of which support a phase-transition interpretation. In the E*/A 4-5 MeV interval the emission of two or more IMFs (accompanied by multiple thermal LCPs) becomes the dominant disintegration mode. From a power-law fit to the charge distributions, it is found that the fraction of large clusters in an average event is a maximum just above the transition excitation energy, as predicted by theory. Evidence for the conversion of extra thermal energy into enhanced IMF kinetic energy appears near E*/A 5 MeV, although the effect is small relative to heavy-ion studies, where compressional heating may contribute.
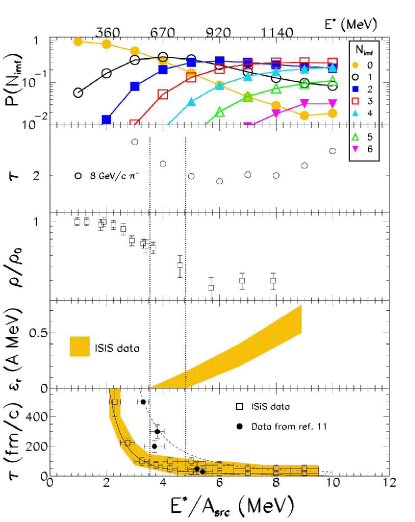
Two unique results derived from ISiS are the evolution of the breakup density and the disintegration time scale as a function of excitation energy. The breakup density derived from analyses of the IMF kinetic-energy spectra, provides evidence for emission from an expanded/dilute source. The derived breakup densities evolve from normal density at low E*/A to a nearly constant value of / 0.3 near E*/A = 5 MeV and above, again consistent with the theoretical predictions based on phase transition assumptions. The time scale for events with MIMF 2 evolves from values characteristic of sequential statistical decay at low excitation energy to times of the order of 20-50 fm/c for events at E*/A 4 MeV and above, indicative of a near-simultaneous decomposition mechanism.
Similar to previous reports, the data also show evidence for a slope change in the dependence of temperature on heat content, suggestive of caloric curve behavior, although a distinct plateau is not observed. Using a density-dependent Fermi-gas model to derive temperatures, instead of the conventional isotope-ratio thermometer, a caloric curve is obtained that is in good agreement with other results. By gating on bins of the preequilibrium spectra, it has also been possible to derive a cooling curve for these hot systems.
Finally, scaling-law fits to the IMF yield distributions provide important confirmation of the statistical nature of the thermal events observed in these studies. A Fisher model analysis reveals excellent scaling behavior up to E*/A 4 MeV, where sequential evaporative emission dominates. This result has been used to define the two-phase coexistence line for nuclear matter and serves as the basis for derivation of the nuclear phase diagram shown in Fig. 44. A percolation model analysis that includes IMF secondary decay corrections also describes the data well and indicates that at higher excitaton energies, the data are described by a continuous phase transition.
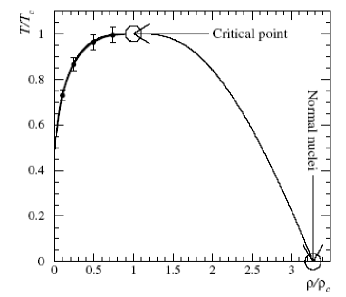
In summary, all of the experimental evidence obtained in these studies is consistent with the concept of a nuclear liquid-gas phase transition. However, the caveat must be added that given the finite system size and very short time scales involved, the classical picture of a phase transition must be invoked with caution. It is perhaps better to say that if a nuclear phase transition exists in nuclei of a few hundred particles, this is what it looks like.
8 Acknowledgments
Over the fifteen year lifetime of the ISiS project numerous individuals have provided invaluable support. We wish to express our sincere gratitude to the following for their help: computer support: R.N. Yoder; ISiS design and construction: Andy Alexander, Kenny Bastin, John Dorsett, Jack Ottarson, John Poehlman, Larry Sexton and Lai Wan Woo; theoretical support: Alexandre Botvina, Wolfgang Bauer, Pawel Danielewicz, C.B. Das, Jim Elliott, Bill Friedman, Subal das Gupta, M. Kleine Berkenbusch, L.G. Moretto, and Viktor Toneev; and undergraduates: Chris Powell and Greg Porter. We also thank the following for their advice and counsel: Joe Natowitz, Brian Serot and Wolfgang Trautmann. We also thank John Vanderwerp, Kevin Komisarcik, Steve Gushue, Lou Remsberg and Birger Back for their help in various aspects of this project. Diana McGovern played an indispensible role in coordinating many aspects of the ISiS program and in manuscript preparation. Finally, we express our appreciation to accelerator staffs at the Indiana University Cyclotron Facility, LNS Saclay and Brookhaven AGS.
References
- [1] J.E. Finn et al. Phys. Rev. Lett 49 (1982) 1321.
- [2] G.F. Bertsch and P.J. Siemens, Phys. Lett 126B (1983) 9.
- [3] J.P. Bondorf et al. Nucl. Phys. A443 (1985) 221.
- [4] G. Friedlander et al. Phys. Rev. 94 (1954) 727.
- [5] R. Wolfgang et al., Phys. Rev. 103 (1956) 394.
- [6] N.A. Perfilov, O.V. Lozhkin and V.P. Shamov, Sov. Phys. Usp. 3 (1960) 1.
- [7] V.P. Crespo et al., Phys. Rev. 131 (1963) 1765
- [8] G. Hudis, in Nuclear Chemistry, edited by L. Yaffe (Academic Press, NY 1968).
- [9] W.G. Lynch, Ann. Rev. Nucl. and Part. Sci. 37 (1987) 493.
- [10] A.M. Poskanzer, G.W. Butler and E.K. Hyde, Phys. Rev. C 3 (1971) 882; 4 (1971) 1759.
- [11] R.G. Korteling,C.R. Toren, E.K. Hyde, Phys. Rev. C 7 (1973) 1611.
- [12] A. Hirsch et al. Phys. Rev. C 29 (1984) 508
- [13] N.T. Porile et al., Phys. Rev. C 39 (1989) 1914.
- [14] A.D. Panagiotou, M.W. Curtin, H. Toki, D.K. Scott and P.J. Siemens, Phus. Rev. Lett. 52 (1984) 496.
- [15] A. Baden et al., Nucl. Instrum. Meth. 203 (1982) 189.
- [16] A.I. Warwick, H.H. Wieman, H.H. Gutbrod, M.R. Maier, J. Peter, H.G. Pitter, H. Stelzer and F. Welk, Phys. Rev. C 27 (1983) 1083.
- [17] S.J. Yennello et al., Phys. Rev. C 48 (1993) 1092.
- [18] J. Hauger et al., Phys. Rev. C 57 (1998) 764; Phys. Rev. C 62 (2000) 024616.
- [19] J. Galin and U. Jahnke, J. Phys. G; Nucl. Part. Phys. 20 (1994) 1105; P. Figuera et al., Z. Phys. A352 (1995) 315.
- [20] S.P.Avdeyev et al. Nucl. Instrum. Meth. A332 (1993) 149.
- [21] K. Kwiatkowski et al. Nucl. Instrum. Meth. A360 (1995) 571.
- [22] D.A. Cebra et al., Nucl. Instrum. Meth A300 (1991) 518.
- [23] R.T. deSouza et al., Nucl. Instrum. Meth. A295 (1993) 29.
- [24] J. Pouthas et al. Nucl. Instrum. Meth. A357 (1995) 418, ibid. A369 (1996) 222..
- [25] NIMROD, http://cyclotron.tamu.edu/nimrod.
- [26] U. Lynen, ALADIN Collaboration, GSI no. GSI-02-89 (1989).
- [27] Dynamics and Thermodynamics with Nucleonic Degrees of Freedom, eds. F. Gulminelli, W. Trautmann and S.J. Yennello, Springer-Verlag, to be published; see also www.kp3.gsi.de/www.kp3/aladinhome; S.P. Avadeyev et al. Nucl. Phys. A 709 (2002) 392 and [18] and [39].
- [28] J. Cugnon, T. Mizutani and J. Vandermuelen, Nucl. Phys.A 352, (1981) 505.
- [29] L.W. Woo, K. Kwiatkowski and V.E. Viola, Phys. Lett. B 132 (1983) 283.
- [30] Y. Yariv and Z. Fraenkel, Phys. Rev C 20 (1979) 2227; 24 (1981) 488; 41 (1990).
- [31] T.Toneev, N.S. Amelin, K.K. Gudima and S. Yu, Sivoklokov, Nucl. Phys. A 519 (1990) 463c.
- [32] G. Wang, K. Kwiatkowski, V.E. Viola, W. Bauer and P. Danielewicz, Phys. Rev. C 53 (1996) 1811.
- [33] D. Strottman and W.R. Gibbs, Phys. Lett. B 149 (1984) 288.
- [34] P. Danielewicz and G.F. Bertsch, Nucl. Phys. A533 (1991) 712; P. Danielewicz, ibid. A673 (2000) 375.
- [35] S. Turbide et al. Phys. Rev. C 70(2004)014608.
- [36] T. Lefort et al., Phys. Rev. Lett. 83 (1999) 4033.
- [37] L. Beaulieu,et al., Phys. Lett. B 463 (1999) 159.
- [38] L. Beaulieu et al., Phys. Rev. C 63 (2001) 031302.
- [39] F. Goldenbaum et al. Phys. Rev. Lett. 77 (1996) 1230.
- [40] K. Kwiatkowski al. Phys. Lett. B 423 (1998) 21.
- [41] K.B. Morley et.al. Phys. Rev. C 54 (1996) 737.
- [42] J.B. Cumming, J. Hudis, A.M. Poskanzer and S. Kaufman, Phys. Rev. B 134 (1964) 167; Phys. Rev. B 132 (1964) 1262.
- [43] L.P. Remsberg and D.G. Perry, Phys. Rev. Lett.35 (1975) 361.
- [44] D.R. Forney and N.T. Porile, Phys. Lett. B 76 (1978) 553.
- [45] W.-c. Hsi et al., Phys. Rev. C 60 (1999) 014609.
- [46] A. Botvina, A.S. Iljinov and I.N. Mishustin, Nucl. Phys. A507 (1990) 649.
- [47] E. Renshaw Foxford et al., Phys. Rev. C 54 (1996) 749.
- [48] T. Lefort et al., Phys. Rev. C 64 (2001) 064603
- [49] A. Ruangma et al., Phys. Rev. C 66 (2002) 044603.
- [50] G.D. Westfall, R.G. Sextro, A.M. Poskanzer, A.M. Zebelman, G.W. Butler and E. Hyde, Phys. Rev. C 17 (1978) 1368.
- [51] L.G. Moretto, Nucl. Phys. A 247 (1975) 211.
- [52] K. Kwiatkowski, J. Bashkin, H. Karwowski, M. Fatyga and V.E. Viola, Phys. Lett. B 171 (1986) 41.
- [53] B. Hauger et al., Phys. Rev. Lett. 77 (1996) 235.
- [54] D. Durand, Nucl. Phys. A 541 (1992) 266.
- [55] J. Toke et al. Phys. Rev. Lett. 75 (1995) 292.
- [56] Y.G. Ma et al., Phys. Lett. B (1997) 41.
- [57] L. Beaulieu et al., Phys. Rev. C 54 (1995) R973.
- [58] W.-c. Hsi et al., Phys. Rev. C 58 (1998) R13.
- [59] T. Egidy et al. Eur. Phys. J A8 (2000) 197.
- [60] D. Polster et al., Phys. Rev. C 51 (1995) 1167.
- [61] R.E.L. Green, R.G. Korteling, and K.P. Jackson, Phys. Rev. C 29 (1984) 1806.
- [62] W.A. Friedman, Phys. Rev. C 42 (1990) 667.
- [63] D.H.E. Gross, Rep. Prog. Phys. 53 (1990) 605.
- [64] S.J. Yennello et al., Phys. Rev C 41 (1990) 79.
- [65] E. Renshaw et al., Phys. Rev. C 44 (1991) 2618.
- [66] J. Brzychczyk et al. Phys. Rev. C 58 (1998) R1372.
- [67] P. Karol, Phys. Rev. C 11 (1975) 1203.
- [68] S. Kox, A. Gamp, I. Cherkoani, A.J. Cole, N. Longequeue, J. Menet, C. Perrin and J.B. Viano, Nucl. Phys. 420 (1984) 162.
- [69] S. Hudan et al., Phys. Rev. C 70 (2004)031601R.
- [70] J.L. Wile et al, Phys. Rev. C 45 (1992) 2300.
- [71] J. Zhang et al., Phys. Rev. C 56 (1997) 1918.
- [72] D.S. Bracken et al., Phys. Rev. C 69 (2004) 034612.
- [73] V.E. Viola, K. Kwiatkowski, J.B. Natowitz and S.J. Yennello, Phys. Rev. Lett 93 (2004) 132701.
- [74] P. Bonche et al., Nucl. Phys. A 427 (1984) 278; Nucl. Phys. A 436 (1986) 265.
- [75] J.B. Natowitz et al., Phys. Rev. C 65 (2002) 034618.
- [76] R.T. de Souza et al. Phys. Lett. B 300 (1993) 29.
- [77] W. Reisdorf et al., Nucl. Phys. A 612 (1997) 493.
- [78] T. Lefort et al, Phys. Rev. C 62 (2000) 031604(R).
- [79] J.P. Bondorf, A.S. Botvina, A.S. Iljinov, I.N. Mishustin and K. Sneppen, Phys. Rep. 257 (1995) 133.
- [80] R.J. Charity et al., Nucl. Phys. A 483 (1988) 371.
- [81] D.H. Boal, C.K. Belbke and K.B. Jennings, Rev. Mod. Phys. 62 (1990) 553.
- [82] R. Trockel et al., Phys. Rev. Lett. 59 (1987) 2844.
- [83] Y.D. Kim et al., Phys. Rev. Lett. 67 (1991) 14; Phys. Rev. C 45 (1992) 338; 45 (1992) 387.
- [84] T. Glasmacher et al. Phys. Rev. C 50 (1994) 952.
- [85] L. Beaulieu et al., Phys. Rev. Lett. 84 (2000) 5971.
- [86] E. Bauge et al., Phys. Rev. Lett. 70 (1993) 3705.
- [87] M. Louvel et al., Phys. Lett. B 320 (1994) 221.
- [88] R. Popescu et al. Phys. Rev. C 58 (1998) 270.
- [89] G.Wang et al. Phys. Rev. C 57 (1998) R2786; 59 (1998) 014603.
- [90] D. Durand, Nucl. Phys. A 630 (1998) 52c and references therein.
- [91] J. Pochodzalla et al., Phys. Rev. Lett. 75 (1995) 1040; see also http://www-kp3.gsi.de/www/kp3/aladin.html.
- [92] J. Albergo, S. Costa, E. Costanzo and A. Rubbino, Nuovo Cim. 89A (1985) 1.
- [93] J.B. Natowitz et al. Phys. Rev. C 66 (2002) 031601(R).
- [94] M.B. Tsang, W.G. Lynch, H. Xi and W.A. Friedman, Phys. Rev. Lett. 78 (1997) 3836.
- [95] Y. Yariv and Z. Fraenkel, Phys. Rev. C 26 (1982) 2138.
- [96] J.R. Wu, C.C. Chang and H.D. Holmgren, Phys. Rev. C 19 (1979) 370; 19 (1979) 659.
- [97] K. Kwiatkowski et al. Nucl. Phys. A 630 (1998) 168c.
- [98] T.X.Liu et al.,arxiv.nucl.-ex/0602020(2006).
- [99] H. Gutbrod et al. in Winter School on Relativistic Heavy Ions, D.M. Sheppard(editor), BANF, Canada, p. 1 (1992).
- [100] L.G.Sobotka, R. Charity, U. Schroeder and J. Toke, Phys. Rev. Lett. 93 (2004) 132702.
- [101] M.D. D’Agostino et al. Phys. Lett B 473 (2000) 219.
- [102] F. Gulminelli and P. Chomaz, Phys. Rev. Lett. 82 (1999) 1402.
- [103] C.B. Das et al., Phys. Rev. C 66 (2002) 044602.
- [104] L.G. Moretto et al. Phys. Rev. Lett 74 (1995) 1530.
- [105] X. Campi, J. Phys. A 19 (1986) L917; Phys. Lett. B 208 (1988) 351.
- [106] M. Kleine Berkenbusch et al. Phys. Rev. Lett. 88 (2002) 022701.
- [107] W. Bauer et al., Phys. Lett. B 150 (1985) 53; Nucl. Phys. A 452 (1986) 699; Phys. Rev. C 38 (1988) 1297.
- [108] M.E. Fisher, Physics 3 (1967) 255.
- [109] J.B. Elliott et al., Phys. Rev. Lett.88 (2002) 042701
- [110] A.H. Raduta et al., Phys. Rev. C 55 (1997) 1344.
- [111] L.G. Moretto and L. Phair, Phys. Rev. C 71 (2005) 024607.et al. (2005).
- [112] L.G. Moretto et al. Phys. Rev. Lett 94 (2005) 202701.
- [113] C.M. Mader et al. Phys. Rev. C 68 (2003) 064601.
- [114] M. D’Agostino et al., Nucl. Phys. A 650 (1999) 328.
- [115] J.B. Elliott et al. Phys. Rev. Lett. 85 (2000) 1194.