STAR Collaboration
Multiplicity and Pseudorapidity Distributions of Charged Particles and Photons at Forward Pseudorapidity in Au + Au Collisions at = 62.4 GeV
Abstract
We present the centrality dependent measurement of multiplicity and pseudorapidity distributions of charged particles and photons in Au + Au collisions at = 62.4 GeV. The charged particles and photons are measured in the pseudorapidity region 2.9 3.9 and 2.3 3.7, respectively. We have studied the scaling of particle production with the number of participating nucleons and the number of binary collisions. The photon and charged particle production in the measured pseudorapidity range has been shown to be consistent with energy independent limiting fragmentation behavior. The photons are observed to follow a centrality independent limiting fragmentation behavior while for the charged particles it is centrality dependent. We have carried out a comparative study of the pseudorapidity distributions of positively charged hadrons, negatively charged hadrons, photons, pions, net protons in nucleus–nucleus collisions and pseudorapidity distributions from p + p collisions. From these comparisons we conclude that baryons in the inclusive charged particle distribution are responsible for the observed centrality dependence of limiting fragmentation. The mesons are found to follow an energy independent behavior of limiting fragmentation while the behavior of baryons seems to be energy dependent.
pacs:
25.75.DwI INTRODUCTION
The STAR experiment star_nim at the Relativistic Heavy Ion Collider (RHIC) at Brookhaven National Laboratory has the unique capability of measuring charged particle and photon multiplicities, precisely and simultaneously, at forward rapidity. By using this capability we can carry out a systematic study of various aspects of charged particle and photon production in relativistic heavy ion collisions.
The conventional way of describing particle production in heavy ion collisions is by measuring the particle density in pseudorapidity (). Within the framework of certain model assumptions, it provides information on energy density, initial temperature and velocity of sound in the medium formed in the collisions initial . The widths of the pseudorapidity distributions are sensitive to longitudinal flow and re-scattering effects ags ; width . The variation of particle density in with collision centrality, expressed in terms of the number of participating nucleons () and/or the number of binary collisions (), can shed light on the relative importance of soft versus hard processes in particle production. The particle density in pseudorapidity also provides a test ground for various particle production models, such as those based on ideas of parton saturation partonsaturation and semi-classical QCD, also known as the color glass condensate (CGC) cgc .
At RHIC, the particle production mechanism could be different in different regions of pseudorapidity. At midrapidity a significant increase in charged particle production normalized to the number of participating nucleons has been observed from peripheral to central Au + Au collisions phenix . This has been attributed to the onset of hard scattering processes, which scale with the number of binary collisions. However, the total charged particle multiplicity per participant pair, integrated over the whole pseudorapidity range, is independent of centrality in Au + Au collisions phobos . In the framework of the color glass condensate picture of particle production cgc , the centrality dependence of particle production at midrapidity reflects the increase of gluon density due to the decrease in the effective strong coupling constant. It will be interesting to see how the photon and charged particle production scales with the number of participating nucleons and with the number of binary collisions in a common coverage at forward rapidity. The increase in particle production at midrapidity with increasing center of mass energy has been studied in detail at RHIC phobos . It is also of interest to see how particle production varies with center of mass energy at forward rapidity. The experimental data on hadron multiplicity and its energy, centrality and rapidity dependence so far have been consistent with the approach based on ideas of parton saturation. Recently it has been argued that this onset of saturation occurs somewhere in the center of mass energy () range of 17 GeV to 130 GeV kharzeev1 . This is one of the reasons cited for having different mechanisms of particle production at RHIC and SPS. The present experimental data at = 62.4 GeV may help to understand the transition energy for the onset of saturation effects in particle production.
It has been observed that inclusive photon production (primarily from decay of ) at = 62.4 GeV starphoton follows a centrality independent limiting fragmentation limiting_frag behavior. The inclusive charged particles at 19.6 GeV and 200 GeV have been observed to follow a centrality dependent behavior of limiting fragmentation phobos . It has been speculated that the baryons, an important constituent of inclusive charged particles, are responsible for the observed difference between photons and charged particles phobos ; starphoton . The baryons coming from nuclear remnants and baryon transport, both of which change with centrality, may be the source of the centrality dependent limiting fragmentation for inclusive charged particles. The role of a new mechanism of baryon production as discussed in Refs. baryon_junction ; valence_quark also needs to be understood. A comparative study of limiting fragmentation of positively and negatively charged particles and photons at the same collision energy and pseudorapidity interval as provided by the present data will help to understand the sources responsible for the observed features. On the theoretical side, reproducing the energy, centrality, and species dependence of limiting fragmentation observed in the experimental data can be a good test for various particle production models. One such attempt to explain the energy dependence of limiting fragmentation phenomena within the framework of CGC has been carried out in Ref. LF_CGC . The importance of the limiting fragmentation curve on energy dependence of particle production has been demonstrated in Ref. LF .
Event-by-event measurements of photon and charged particle multiplicities can be used to study multiplicity fluctuations wa98_fluc . Fluctuations in physical observables in heavy ion collisions may provide important information regarding the formation of a Quark-Gluon Plasma and help to address the question of thermalization fluc_gen . The study of event-by-event fluctuations in the ratio of photon to charged particle multiplicities has also been proposed as a tool to search for production of Disoriented Chiral Condensates (DCCs) dcc .
In this paper we address some of the above physics issues through the first simultaneous measurement of the charged particle and photon multiplicities for Au + Au collisions at = 62.4 GeV in the forward rapidity. The charged particles are detected using the Forward Time Projection Chamber (FTPC) and the photons are detected using the Photon Multiplicity Detector (PMD) in the STAR experiment star_nim ; starftpc_nim ; starpmd_nim .
The paper is organized as follows: In section II we briefly describe the detectors used for measuring the charged particle and photon multiplicities and the trigger detectors used for selecting the minimum bias data, used in the present analysis. In section III we present the details of data analysis from the FTPC and the PMD. In section IV we present the results in terms of multiplicity and pseudorapidity distributions of photons and charged particles, scaling of particle production with number of participating nucleons and number of binary collisions and limiting fragmentation behavior for charged, neutral and identified particles. Finally we summarize our study in section V.
II DETECTORS
The STAR experiment star_nim consists of several detectors to measure hadronic and electromagnetic observables spanning a large region of the available phase space at RHIC. The detectors used in the present analysis are the FTPC, PMD, a set of trigger detectors used for obtaining the minimum bias data and the Time Projection Chamber (TPC), data of which is used to determine the collision centrality. The FTPCs, PMD, minimum bias trigger and collision centrality selection are briefly described below.
II.1 Forward Time Projection Chambers
There are two FTPCs; they are located on each side of the nominal collision vertex, around the beam axis. They are cylindrical in structure with a diameter of 75 cm and 120 cm in length. Each FTPC has 10 rows of readout pads, called , which in turn are subdivided into 6 sectors with 160 pads per sector. The first padrow is located about 1.63 meters away on both sides from the center of the TPC (the nominal collision point). The sensitive medium is a gas mixture of Ar and CO2 in the ratio of 50%:50% by weight. The FTPCs detect charged particles in the pseudorapidity region 2.5 4.0. The novel design of the FTPCs uses a radial drift field, perpendicular to the magnetic field, to achieve a two-track resolution up to 2 mm. This allows for track reconstruction in the environment of high particle density at forward rapidity. In the present analysis, the data from only the FTPC in the positive pseudorapidity region (2.9 3.9) is used. Particle production models such as HIJING hijing and AMPT ampt show that about 6–7% of the total charged particles produced fall within the acceptance of each of the FTPCs. Further details of the design characteristics of the FTPC can be found in Ref. starftpc_nim .
II.2 Photon Multiplicity Detector
The PMD is located 5.4 meters away from the center of the TPC (the nominal collision point) along the beam axis. It consists of two planes (charged particle veto and preshower) of an array of cellular gas proportional counters. A lead plate of 3 radiation length thickness is placed between the two planes and is used as a photon converter. The sensitive medium is a gas mixture of Ar and CO2 in the ratio of 70%:30% by weight. There are 41,472 cells in each plane, which are placed inside 12 high voltage insulated and gas-tight chambers called supermodules. A photon traversing the converter produces an electromagnetic shower in the preshower plane, leading to a larger signal spread over several cells as compared to a charged particle, which is essentially confined to one cell. The PMD detects photons in the pseudorapidity region 2.3 3.7. In the present analysis, only the data from the preshower plane has been used. From HIJING hijing and AMPT ampt we find that about 10–11% of the total photons produced fall within the acceptance of the PMD. The photon production is dominated by photons from the decay of s starphoton . HIJING calculations indicate that about 93–96% of photons are from inclusive decays. Further details of the design and characteristics of the PMD can be found in Ref. starpmd_nim .
II.3 Minimum bias trigger and collision centrality
The minimum bias trigger is obtained using the charged particle hits from an array of scintillator slats arranged in a barrel, called the Central Trigger Barrel, surrounding the TPC, two zero degree hadronic calorimeters at 18 m from the detector center along the beam line, and two Beam-Beam Counters trigger . The centrality determination in this analysis uses the uncorrected multiplicity of charged particles in the pseudorapidity region 0.5, as measured by the TPC star_glauber . Table 1 gives the percentage cross section, the corresponding uncorrected multiplicity of charged particle tracks () in the pseudorapidity region 0.5, the number of participating nucleons () and the number of binary collisions () used in this paper. The number of participating nucleons and the number of binary collisions have been obtained from Glauber calculations star_glauber .
| % cross section | |||
|---|---|---|---|
| 0–5 | 373 | 347.3 | 904.3 |
| 5–10 | 373–313 | 293.3 | 713.7 |
| 10–20 | 313–222 | 229.0 | 511.8 |
| 20–30 | 222–154 | 162.0 | 320.9 |
| 30–40 | 154–102 | 112.0 | 193.5 |
| 40–50 | 102–65 | 74.2 | 109.3 |
| 50–60 | 65–38 | 45.8 | 56.6 |
| 60–70 | 38–20 | 25.9 | 26.8 |
| 70–80 | 20–9 | 13.0 | 11.2 |
III DATA RECONSTRUCTION
III.1 Charged particle reconstruction
The analysis of the data from the FTPC involves the following steps: (a) event selection, (b) pad-to-pad gain calibration, and (c) reconstruction of charged tracks.
A total of 1.2 million minimum bias events, corresponding to 0–80% of the Au + Au hadronic interaction cross section, have been selected with a collision vertex position less than 30 cm from the center of the TPC along the beam axis.
The calibration of the FTPC is done using a laser calibration system starftpc_nim . This system helps to calibrate the drift velocity in the nonuniform radial drift field and also provides information for corrections to spatial distortions caused by mechanical or drift field imperfections. The localization of dead pads is done with pulsers and by an analysis of data to identify electronically noisy pads ftpcthesis .
The reconstruction of experimental data involves two steps: (a) cluster-finding to calculate the track points from the charge distribution detected by the pads, (b) track-finding to group the track points of different padrows of the FTPC to form a track. The cluster-finding includes reading of the electronic signal data from the data acquisition system, looking for areas of nonzero charge (cluster), deconvolution of clusters, and then finding the point co-ordinates. This is followed by combining clusters from all padrows to form tracks using a suitable tracking algorithm markus . A track is considered valid if it consists of at least 5 found clusters and if its distance of closest approach to the primary vertex is less than 3 cm. The condition of having at least 5 found clusters for each track in the FTPC ensures a small contribution of split tracks. The split tracks contribution and background contamination are primarily from conversion electrons and positrons which are significantly reduced when we include those tracks which have transverse momentum in the range 0.1 3 GeV/ in the analysis. The maximum percentage of split tracks was estimated from simulations to be 1.5%. The relative amount of split tracks decreases as we go from from central to peripheral collisions. Two procedures are used to obtain the charged particle yields at all . The charged particle transverse momentum spectra are fitted by a power-law function in the range 0.1 GeV/ 1 GeV/ and extrapolated to = 0 GeV/. The low yield is obtained from this extrapolation. The other procedure calculates the yield of charged particles for 0.1 GeV/ by using the ratio of the yield in this range to total yields from HIJING hijing simulations. Both these procedures resulted in similar correction factors of the order of 15% in the region 2.9 3.9.
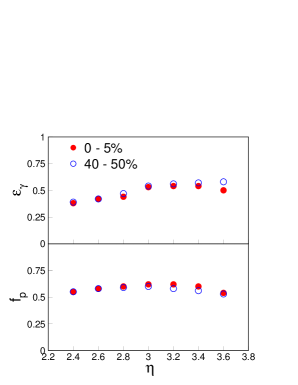
The efficiency of charged particle reconstruction () as a function of pseudorapidity is estimated by embedding Monte Carlo charged tracks into real data and then following the full reconstruction chain starmultiplicityprl . The reconstruction efficiency is obtained by dividing the number of reconstructed Monte Carlo tracks within an bin by the total number of embedded Monte Carlo tracks in the same bin. The charged particle reconstruction efficiencies for central and peripheral collisions, for the region studied, are shown in Fig. 1. The background contamination is obtained from detailed Monte Carlo simulation using the HIJING (version 1.382) event generator hijing and the detector simulation package GEANT geant , which incorporates the full STAR detector framework. The purity of the charged hadron sample () in the FTPC for central and peripheral collisions is also shown in Fig. 1. The errors on efficiency and purity values will be discussed later.
III.2 Photon reconstruction
The analysis of the data from the PMD involves the following steps: (a) event selection, (b) cell-to-cell gain calibration, and (c) reconstruction or extraction of photon multiplicity.
A total of 0.3 million minimum bias events, corresponding to 0–80% of the Au + Au hadronic interaction cross section, have been selected with a collision vertex position less than 30 cm from the center of the TPC along the beam axis. The difference in the number of events for the PMD and FTPC analysis originates from the fact that, for the same period of data-taking, the PMD recorded fewer events and there was a need for a more stringent data clean-up procedure to remove events with pile-up-like effects.
The cell-to-cell gain calibration was done by obtaining the ADC distributions of isolated cells. The ADC distribution of an isolated cell may be treated as the response of the cell to charged particles starpmd_nim . For most of the cells this response follows a Landau distribution. We use the mean of the ADC distribution of isolated cells to estimate and correct the relative gains of all cells within each supermodule. The cell-to-cell gain variation is between 10–25% for different supermodules.
The extraction of the photon multiplicity proceeds in two steps involving clustering of hits and photon-hadron discrimination. Hit clusters consist of contiguous cell signals. Photons are separated from charged particles using the following conditions: (a) the number of cells in a cluster is 1, and (b) the cluster signal is larger than 3 times the average response of all isolated cells in a supermodule. The choice of the conditions is based on a detailed study of simulations starpmd_nim ; starphoton . The number of selected clusters, called clusters (), in different supermodules for the same coverage are used to evaluate the effect of possible non-uniformity in the response of the detector.
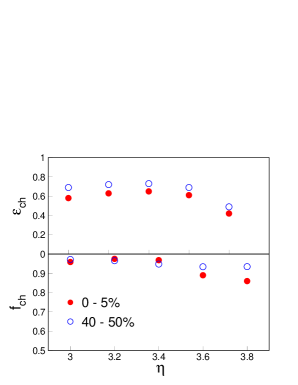
To estimate the number of photons () from the detected clusters we evaluate the photon reconstruction efficiency () and purity () of the sample defined wa98_dndy as and respectively. is the number of photon clusters above the photon-hadron discrimination condition. Both and are obtained from a detailed Monte Carlo simulation using HIJING hijing with default parameter settings and the detector simulation package GEANT geant , which incorporates the full STAR detector framework. Both and vary with pseudorapidity and centrality. This is due to variations in particle density, upstream conversions and detector related effects. A photon should ideally create one cluster in the detector. However, it may give rise to more than one cluster (called split clusters) in the real experimental environment. These may happen because of conversions of the photon due to upstream materials in front of the PMD, or limitations of the clustering algorithm due to varying particle density. The highest occupancy of the PMD is about 12% and the maximum percentage of split clusters is estimated to be 9%. The photon reconstruction efficiency and the purity of the photon sample determined by means of simulations for central and peripheral collisions for the region studied are shown in Fig. 2. The lower limit of photon acceptance in the PMD is estimated from detector simulations to be 20 MeV/.
III.3 Systematic errors
The systematic errors on the charged particle multiplicity () are due to uncertainties in estimates of and . The uncertainty in the estimates are obtained through simulations by varying the track quality cuts. The value of the maximal distance of closest approach of a track to the primary vertex is varied by 0.5 cm leading to a maximum error on of 6%. The minimum number of clusters to form a track was varied from 5 to 4. This led to an error on of 1%. The uncertainty in the correction factor to obtain the yield for 0.1 GeV/ is 8%. This also contributes to the total systematic errors. The total systematic error in is 10% for all the centrality classes studied. The systematic error for the region 3.6 is estimated to be about 15%, due to larger uncertainity in the reconstruction efficiency. This arises primarily due to uncertainity in realistic reproduction of electronic loss, at the extreme ends of the detector acceptance. This is estimated by studying the azimuthal dependence of charged particle density in a given window.
The systematic errors on the photon multiplicity () are due to (a) uncertainty in estimates of and values arising from splitting of clusters and the choice of photon-hadron discrimination threshold and (b) uncertainty in arising from the non-uniformity of the detector response primarily due to cell-to-cell gain variation. The error in due to (a) is estimated from Monte Carlo simulations to be 9.8% and 7.7% in central and peripheral collisions, respectively. The error in due to (b) is estimated using average gains for normalization and by studying the azimuthal dependence of the photon density of the detector in an window to be 13.5% for central and 15% for peripheral collisions. The total systematic error in is 17% for both central and peripheral collisions.
The total errors on and are obtained by adding respective systematic and statistical errors in quadrature and are shown in all the figures unless mentioned otherwise. The statistical errors are small and within the symbol sizes.
IV RESULTS and Discussion
IV.1 Multiplicity distributions
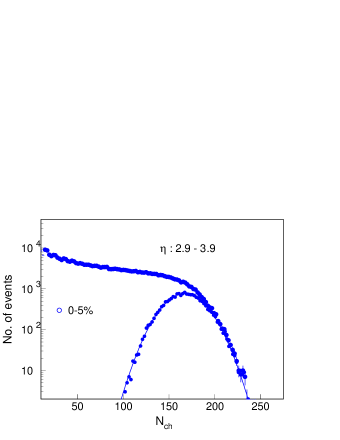
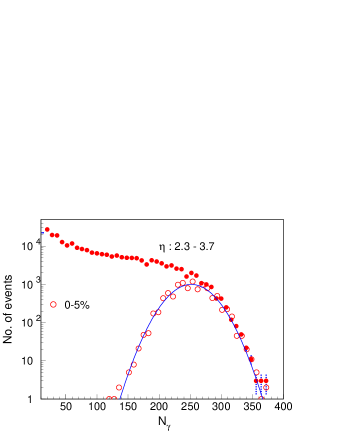
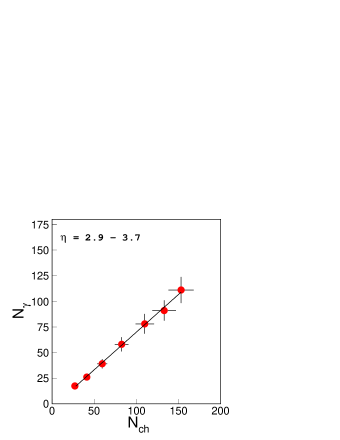
The charged particle multiplicity () and photon multiplicity () are obtained event-by-event in the FTPC and the PMD following the analysis procedure described above. Fig. 3 shows the minimum bias distributions of and for Au + Au collisions at = 62.4 GeV. The distributions have a characteristic shape with a steep rise that corresponds to the most peripheral events. The plateaus in the photon and charged particle multiplicity distributions correspond to mid-central events and the fall-off to the most central collision events. The shape of the curves in the fall-off region reflects the intrinsic fluctuations of the measured quantities and the limited acceptance of the detectors. The event-by-event charged particle and photon multiplicity distributions for 0–5% central collisions are also shown. Gaussian fits to these distributions have been made. The values of the fit parameters for charged particles measured in 2.9 3.9 are: mean = 167 and = 20; = 70.67/69. The values of the fit parameters for photons measured in 2.3 3.7 are: mean = 252 and = 30; = 37.3/34. The correlation between the average number of charged particles and average number of photons within the common pseudorapidity coverage of the FTPC and PMD (2.9 3.7) for different collision centrality classes in Au + Au collisions at = 62.4 GeV are shown in Fig. 4. The correlation between and can be expressed as = (0.740.01) – (3.570.83). This is shown as a straight line in the figure. The correlation reflects the variation of and with collision centrality. The correlation coefficient is 1.010.01.
IV.2 Scaling of particle production
After having discussed the event-by-event measurement of photon and charged particle multiplicities in the previous section, we now discuss the variation of average (averaged over number of events) photon and charged particle multiplicities within the full coverage of the PMD and FTPC, respectively, with centrality. Collision centrality is expressed in terms of either number of participating nucleons or number of binary collisions. This will provide information on the contribution of hard (pQCD jets) and soft processes to particle production at forward rapidity. The scaling of particle production with the number of participating nucleons indicates the dominance of soft processes while scaling with the number of binary collisions indicates the onset of hard processes. At midrapidity the particle production at = 130 GeV and 200 GeV has been shown to scale with a combination of and phenix . Here we present the results on scaling of particle production at forward rapidity for Au + Au collisions at = 62.4 GeV.
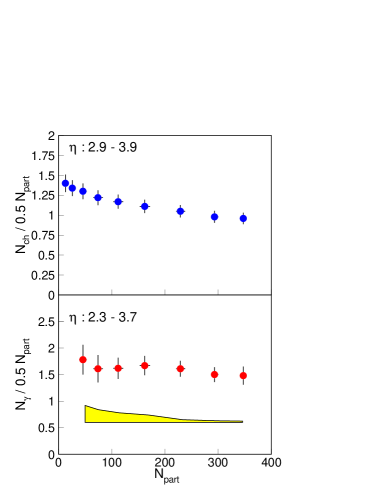
Figure 5 shows the variation of the total number of charged particles in the FTPC coverage (2.9 3.9) and the total number of photons in the PMD acceptance (2.3 3.7), both normalized to , as a function of the collision centrality, expressed by the number of participants. Higher values correspond to more central collisions, or collisions with smaller impact parameter. The charged particle yield per participating nucleon pair at forward rapidity decreases from peripheral to central collisions. The photon production per participant pair is found to be approximately constant with centrality in the forward range studied.
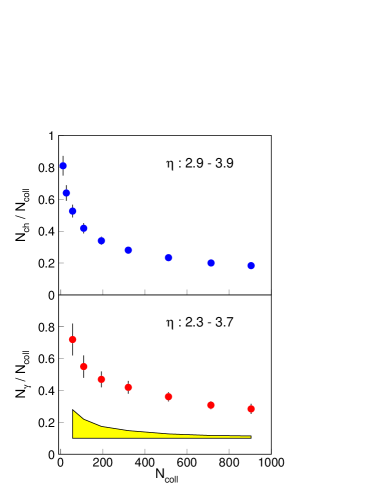
Figure 6 shows the variation of the total number of charged particles normalized to the number of collisions in the FTPC coverage (2.9 3.9) and the total number of photons normalized to the number of collisions in the PMD coverage (2.3 3.7) as a function of the number of binary collisions. Higher values correspond to more central collisions, or collisions with smaller impact parameter. Both the charged particle yield and photon yield normalized to the number of binary collisions do not scale with the number of binary collisions at forward rapidity. The data value decreases from peripheral to central collisions. This indicates that the contribution of hard processes to particle production at forward rapidity is small.
IV.3 Pseudorapidity distributions
So far we have discussed the multiplicities of photons and charged particles over the full coverage of the detectors. In this section we study the variation in particle density with . The results can then be directly compared to different models in order to understand the mechanism of particle production in heavy ion collisions at forward rapidity.
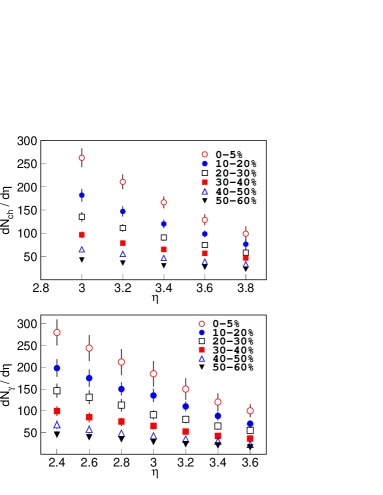
Figure 7 shows the pseudorapidity distributions of charged particles within 2.9 3.9 and photons within 2.3 3.7 for various event centrality classes. As expected the particle density increases with decrease in .
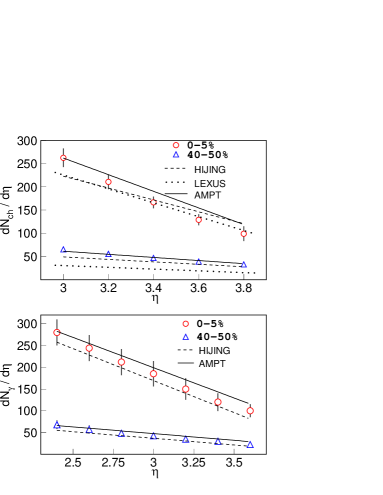
Fig. 8 shows the comparison of pseudorapidity distributions for photons and charged particles for 0–5% and 40–50% central Au + Au collisions at = 62.4 GeV with the corresponding results from various theoretical models. The HIJING model hijing is based on perturbative QCD processes which lead to multiple jet production and jet interactions in matter. HIJING seems to underpredict the measured photon multiplicity. However within the systematic errors it is difficult to make definitive conclusions. For charged particles, HIJING fails to explain the distributions for central and peripheral collisions. The AMPT ampt model is a multi-phase transport model which includes both initial partonic and final hadronic interactions. For photons, the results from the AMPT model are in reasonable agreement with the data for central and peripheral events within the systematic errors. For charged particles in central collisions, the results from AMPT explain the data at lower and overpredict the charged particle yields at higher . The LEXUS lexus model is based on linear extrapolation of nucleon-nucleon collisions to high-energy nucleus-nucleus collisions. For charged particles, the LEXUS model underpredicts the multiplicity at lower and agrees with experimental data at higher for central collisions. It also underpredicts the charged particle yields for peripheral collisions. In summary, we observe that the photon multiplicity within the systematic errors is reasonably well explained by HIJING and AMPT models. The detailed pseudorapidity dependence of the charged particle multiplicity is not reproduced by the above models.
We have so far studied the pseudorapidity distribution of particles at forward rapidity at = 62.4 GeV. Now we will investigate the following: (a) the energy dependence of the shape of the distribution of charged particles available at various energies of Au + Au collisions in RHIC, and (b) try to estimate the full distribution for charged particles for = 62.4 GeV from the above study and compare to the present measurements.
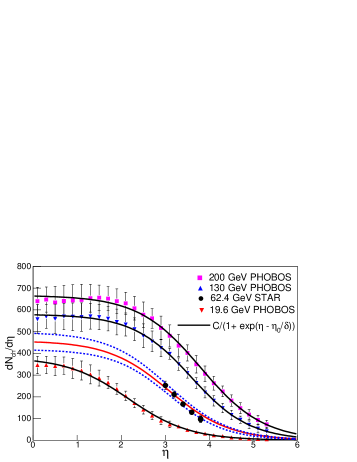
The full pseudorapidity distribution of charged particles at RHIC for central collisions can be parametrized by the following 3-parameter formula:
This formula is chosen to describe the central plateau and the fall off in the fragmentation region of the distribution by means of the parameters and respectively. Using this formula we can describe the 200 GeV, 130 GeV and 19.6 GeV pseudorapidity distributions of charged particles from the PHOBOS experiment phobos . The values of the parameters , and are given in Table 2 and the fits to data are shown in Fig. 9. The value of is found to increase with increasing . The value of the parameter is found to be independent of energy within errors. This feature is another way of testing the concept of limiting fragmentation, which will be discussed later. Using the average value of and interpolating the value of to 62.4 GeV we are able to predict the full pseudorapidity distribution for charged particles at 62.4 GeV. This is shown as solid curve in Fig. 9, together with our measured charged particle data for 62.4 GeV at forward rapidity. The dashed curves represent the error in obtaining the full pseudorapidity distribution for charged particles using the interpolation method described.
| (GeV) | |||
|---|---|---|---|
| 19.6 | 382 33 | 2.16 0.17 | 0.7 0.06 |
| 62.4 (interpolated) | 458 40 | 3.08 0.35 | 0.69 0.06 |
| 130 | 580 21 | 3.59 0.076 | 0.66 0.05 |
| 200 | 667 22 | 3.80 0.082 | 0.71 0.06 |
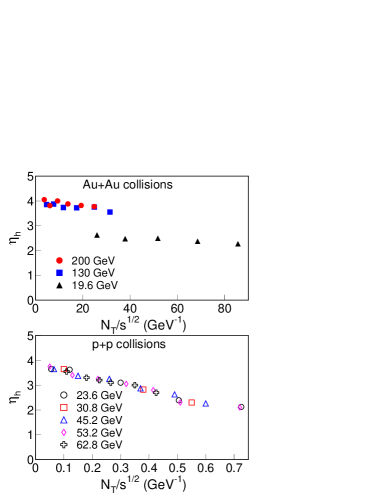
We have also studied the widths of the pseudorapidity distributions of charged particles at RHIC and compared them to those from p + p collisions at ISR isr . In Fig. 10 we show the variation of the half width at half maximum () of the charged particle pseudorapidity distributions as a function of total charged particle multiplicity normalized to the center of mass energy (/) for p + p and Au + Au collisions. The data shown is for various centrality classes in Au + Au collisions phobos and for various intervals of observed total multiplicity in p + p collisions. We observe that the half width at half-maximum obeys an interesting scaling law in p + p collisions and is found to depend on a single variable (/). In Au + Au collisions this scaling seems to be valid for 200 GeV and 130 GeV. Although the width decreases with / for 19.6 GeV, the data lies below the higher energy data unlike the energy independent behavior observed in p + p collisions. This may reflect the change in the mechanism of particle production over the full pseudorapidity range as we increase the from 19.6 GeV to 130 GeV in Au + Au collisions at RHIC.
IV.4 Energy dependence of particle multiplicity
The energy dependence of charged particle yields at midrapidity has been studied at RHIC phobos . Here we present the results on the energy dependence of particle yields at forward rapidity and compare them with yields at midrapidity.
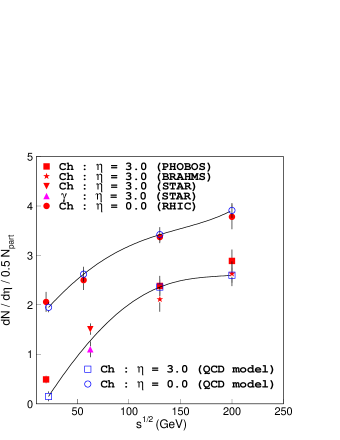
Figure 11 shows the charged particle pseudorapidity distribution scaled by the number of participating nucleon pairs at midrapidity ( = 0) and forward rapidity ( = 3.0) as a function of for central collisions at RHIC. The data for charged particles at = 19.6 GeV, 56 GeV, 130 GeV and 200 GeV at = 3.0 are from the PHOBOS phobos and BRAHMS brahms experiments. The data for charged particles at midrapidity are the averages of the values from the 4 RHIC experiments. The charged particle production at = 0, can be expressed as
The charged particle production at = 3.0, can be expressed as
The ratio of charged particle production at = 0 to that at = 3.0 decreases from a factor 4 to 1.3 as increases from 19.6 GeV to 200 GeV. The photon result at = 62.4 GeV for = 3.0 is also shown. The photon yields at other values at forward rapidity and midrapidity are not yet available at RHIC. The photon production at = 62.4 GeV is about 35% lower than the charged particle production for the same energy at = 3.0. The charged particle yield at = 3.0 for = 62.4 GeV is a factor 1.6 and 1.9 lower compared to the corresponding yields at 130 GeV and 200 GeV and a factor 3.0 higher than the charged particle yields at 19.6 GeV. For comparison, also shown in Fig. 11 are the results from a model based on parton saturation, which is expected in high-density QCD kharzeev . The results from the model agree with the measured charged particle yields at midrapidity for all energies at RHIC. However, the model’s prediction for forward rapidity at the lowest energy (22 GeV) is lower compared to data (19.6 GeV). There is no prediction for = 62.4 GeV available from this model. It would be interesting to have the predictions to understand the transition energy for the onset of saturation effects at RHIC.
IV.5 Comparison of and
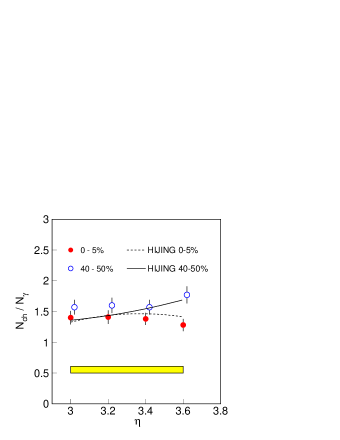
The STAR experiment at RHIC has the unique capability to study the yields of charged particle and photons at forward rapidity. Fig. 12 shows the ratio of to for 0–5% and 40–50% central Au + Au collisions at = 62.4 GeV as a function of in the common coverage of the FTPC and the PMD. The ratio is around 1.4 for central collisions and 1.6 for peripheral collisions within 3.0 3.6. The results from HIJING indicate similar values. The correlated systematic errors, mainly arising due to uncertainties in the Monte Carlo determination of reconstruction efficiencies and normalization errors, are not plotted on the data points and are shown as a shaded band. The photon production is dominated by photons from the decay of s starphoton . The charged particle yields have a substantial contribution from baryons at forward rapidity brahms_proton . Apart from the kinematics, this may be the reason for higher charged particle yields compared to photons. In the future, event–by–event study of and correlations in common and coverage of the FTPC and the PMD can be used to look for possible formation of disoriented chiral condensates dcc .
IV.6 Energy dependence of limiting fragmentation
Continuing our discussion on particle density in , we now present results on the longitudinal scaling of particle production in heavy ion collisions. It has been observed that the number of charged particles produced per participant pair as a function of – ybeam, where ybeam is the beam rapidity, is independent of beam energy phobos ; starphoton . This phenomenon is known as limiting fragmentation limiting_frag . Here we present the results on energy dependence of limiting fragmentation at 62.4 GeV for charged particles and photons produced in Au + Au collisions. In the subsequent sections we discuss the centrality and species dependence of this scaling.
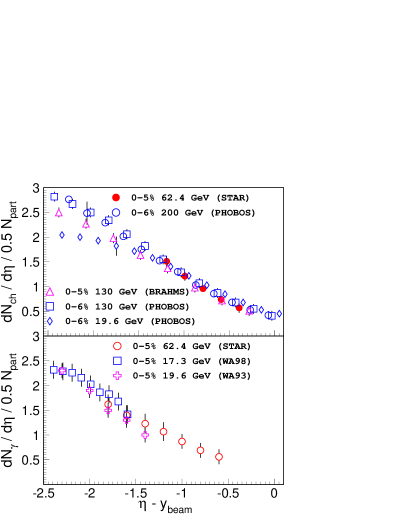
In Fig. 13 we present the energy dependence of limiting fragmentation for inclusive charged particles and photons. The charged particle pseudorapidity distribution for central (0–5%) Au + Au collisions at = 62.4 GeV is compared to the charged particle pseudorapidity distributions from PHOBOS for central (0–6%) collisions at 19.6 GeV, 130 GeV and 200 GeV phobos and charged particle pseudorapidity distribution from BRAHMS for central (0–5%) collisions at 130 GeV brahms . The photon pseudorapidity distributions for central (0–5%) Au + Au collisions at = 62.4 GeV is compared with central (0–5%) photon data for Pb + Pb collisions at 17.3 GeV from the WA98 experiment wa98_dndy and 19.6 GeV central (0–5%) S + Au collision data from the WA93 experiment wa93_dndy . We observe in Fig. 13 that the SPS and RHIC (62.4 GeV) photon results are consistent with each other, suggesting that photon production follows an energy independent limiting fragmentation behavior. The charged particles at 62.4 GeV also show an energy independent limiting fragmentation behavior.
IV.7 Centrality dependence of limiting fragmentation
Recently there have been contradictory results reported from inclusive charged particle measurements regarding the centrality dependence of the limiting fragmentation behavior. Results from PHOBOS show a centrality dependence phobos , while those from BRAHMS show a centrality independent behavior brahms . Here we present the results on the centrality dependence of limiting fragmentation for charged particles and photons at = 62.4 GeV.
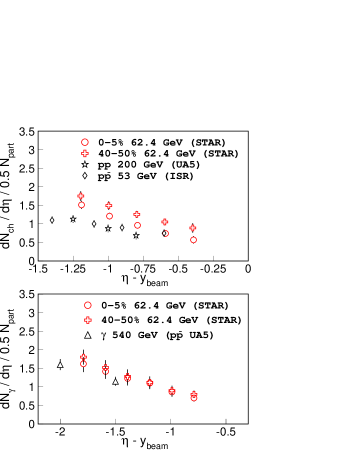
In Fig. 14 we show the centrality dependence of limiting fragmentation for charged particles and photons. The charged particle pseudorapidity distributions for 0–5% and 40–50% central Au + Au collisions at = 62.4 GeV have been compared. We observe, at forward rapidity, the charged particle yield normalized to the number of participating nucleons as a function of – ybeam is higher for peripheral collisions compared to central collisions, whereas within the measured range of 2.3 to 3.7, the photon yield normalized to the number of participating nucleons as a function of – ybeam is found to be independent of centrality. The dependence of limiting fragmentation on the collision system is most clearly seen in the comparison between results from heavy ion collisions with those from + and + collisions ua5 . We observe in Fig. 14 that the photon results in the forward rapidity region from collisions at = 540 GeV are in close agreement with the measured photon yield in Au + Au collisions at = 62.4 GeV. However the + and + inclusive charged particle results are very different from those for Au + Au collisions at = 62.4 GeV. It may be mentioned that the photon yield is dominated by photons from decay of s starphoton . The presented photon results and their comparison with nucleon-nucleon collisions indicate that in the region studied, there is apparently a significant charged baryon contribution in nucleus-nucleus collisions. Similar centrality dependent behavior of limiting fragmentation for charged particles was also observed by PHOBOS phobos . The centrality dependence of limiting fragmentation in charged particles has been speculated to be due to nuclear remnants and baryon stopping phobos ; baryon_junction . The centrality independent limiting fragmentation for photons has been attributed to mesons being the dominant source of photon production starphoton . HIJING calculations indicate that about 93–96% of the photons are from decays.
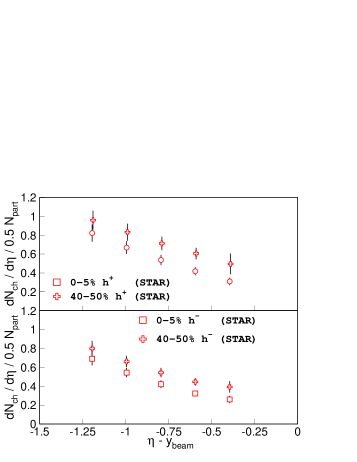
In order to understand the role of nuclear remnants and baryon stopping in the observed centrality dependent behavior of limiting fragmentation of charged particles, we have studied the limiting fragmentation for positively and negatively charged hadrons separately. The contribution from protons coming from beam remnants can be understood by studying the limiting fragmentation of positively charged hadrons. In Fig. 15 we have plotted normalized to the number of participating nucleons for 40–50% and for 0–5% central collisions for positively () and negatively charged () hadrons. In addition to the systematic errors discussed earlier, and shown in the figure, there is an error due to the uncertainty in the charge determination. The uncertainty has been studied by embedding charged Monte Carlo tracks into real data and then following the full reconstruction chain. This error was obtained as a function of . It is defined as the ratio of the total number of embedded charged tracks whose charge has been reconstructed incorrectly, to the total number of charged tracks embedded. The error in charge determination was found to increase from 2% at = 2.9 to 15% at = 3.9. We find that both and show a centrality dependent limiting fragmentation behavior. When compared to the centrality independent limiting fragmentation behavior for photons (Fig. 14) and to results from nucleon-nucleon collisions (Fig. 14), our measurements indicate that baryon transport at forward rapidity also plays an important role in the observed centrality dependent behavior of limiting fragmentation for charged particles. We find that the ratio for yields of from peripheral to central collisions increases from 1.170.06 at = 3.0 to 1.610.07 at = 3.8 (closer to beam rapidity). The values for are 1.160.06 at = 3.0 and 1.510.07 at = 3.8. From these values we find that the increase in the ratio with seems to be somewhat weaker for compared to . However, within the systematic errors, it is difficult to conclude on the role of the beam remnants (beam protons in ) in the centrality dependent behavior of limiting fragmentation for charged particles at forward rapidity.
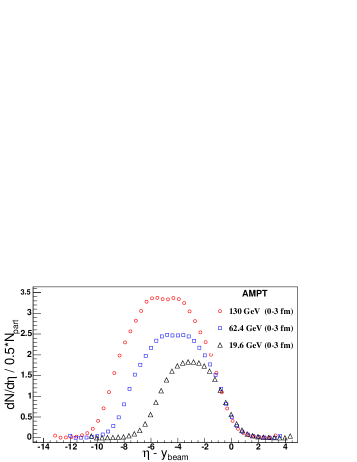
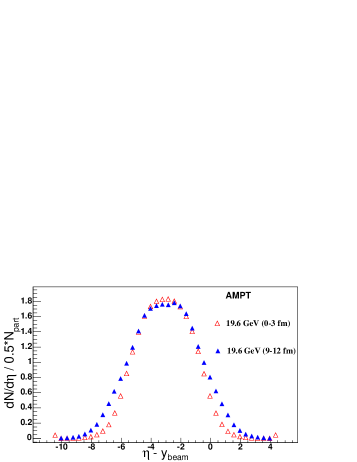
Energy and centrality dependence of limiting fragmentation for charged particles can be a test for particle production models. We have observed that particle production models such as HIJING and AMPT are not able to describe fully the distribution of charged particles at forward rapidity. However, it is interesting to investigate whether they can qualitatively reproduce the limiting fragmentation features of experimental data. Our calculations show that in the HIJING and AMPT models the charged particles show energy independent limiting fragmentation. The centrality dependent behavior of limiting fragmentation for charged particles is more clearly observed in the AMPT model than in HIJING. In Fig. 16 we only show the results from the AMPT model. These results are for the values of 19.6 GeV, 62.4 GeV and 130 GeV Au + Au collisions at 0–3 fm and 9–12 fm impact parameter. For the centrality dependence we only show the results for = 19.6 GeV, the energy at which the centrality dependent effect is most prominent in the data phobos . The AMPT model has qualitative limiting fragmentation features similar to those of experimental data (shown in Fig. 14). We find in the model that the central yields, when normalized to number of particpating nucleons, are also lower than the corresponding peripheral yields at forward rapidity when is shifted by the beam rapidity.
IV.8 Identified particle limiting fragmentation
The observation of centrality dependent and energy independent limiting fragmentation for inclusive charged particles, along with the centrality and energy independent limiting fragmentation for photons (presented in previous sections), motivates us to study the limiting fragmentation of identified particles.
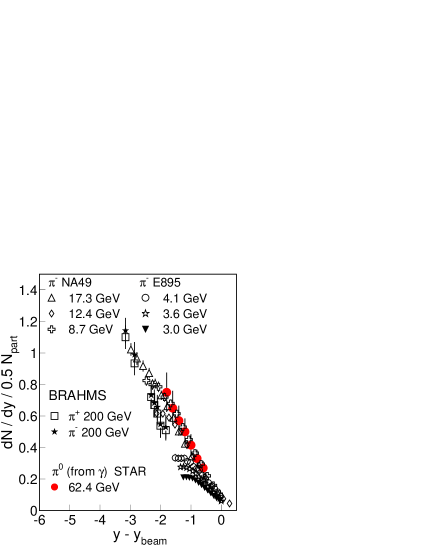
The top panel in Fig. 17 shows the charged pion rapidity density in central Au + Au collisions at RHIC rhic_pion , Pb + Pb collisions at the SPS na49_pion and Au + Au collisions at AGS ags . Also shown is the estimated rapidity density from the present measurement of the photon rapidity density at = 62.4 GeV, all as a function of y–ybeam starphoton . We obtained the ratio of the photon to yields from HIJING. This ratio is used to estimate the yield from the measured photon yield. The results indicate that the pion production in heavy ion collisions in the fragmentation region agrees with the energy independent limiting fragmentation picture.
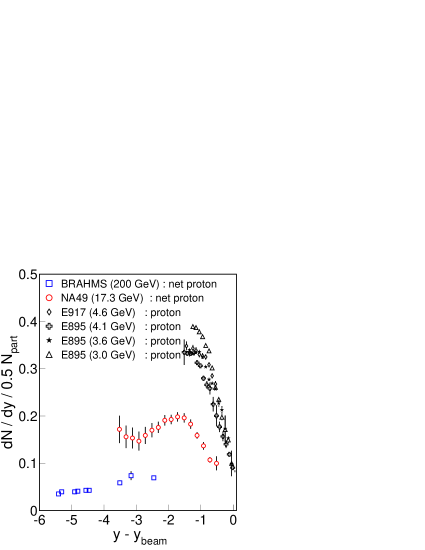
The bottom panel of Fig. 17 shows the net proton ( - ) rapidity density in central Au + Au collisions at RHIC brahms_proton energies and Pb + Pb collisions at SPS na49_proton energies. For AGS energies ags ; ags_proton we plot only the proton rapidity density in Au + Au collisions. Since the anti-proton yields are very low ( 2 at top AGS energy), the proton rapidity density reflects the net proton rapidity distribution. The net protons violate the energy dependence of limiting fragmentation. These results show that baryons and mesons differ in the energy dependence of limiting fragmentation. The results for identified particles, along with the centrality dependence of limiting fragmentation for inclusive charged hadrons, and the centrality independence of limiting fragmentation for identified mesons, shows that the baryon transport in heavy ion collisions plays an important role in particle production at forward rapidity. The results also show that although baryon stopping is different in different collision systems, the pions produced at forward rapidity are not affected by baryon transport. The limiting fragmentation study for net protons may also indicate the validity of a baryon junction picture baryon_junction . If the baryon numbers are carried by the valence quarks, then at forward rapidity the baryons should also follow an energy independent limiting fragmentation behavior, like pions (originating from valence quarks). This may indicate that the baryon number is not carried by the valence quark, which is suggested in the baryon junction picture, where the baryon number resides in a non-perturbative configuration of gluon fields, rather than in the valence quarks.
V Summary
In summary, we have presented charged particle and photon multiplicity
measurements at RHIC in the pseudorapidity regions
2.9 3.9 and 2.3 3.7, respectively.
The pseudorapidity distributions of charged particles and photons
for Au + Au collisions at = 62.4 GeV have been
obtained for
various centrality classes and compared to results from different models.
Charged particle and photon production normalized to the number of
participating nucleon pairs and to the number of binary collisions
has been studied. The photon multiplicity, within the
systematic errors, seems to scale with the number of participating nucleons,
while the charged particle multiplicity does not.
Both the photon and charged particle
production at forward rapidity do not scale with number of binary
collisions. This indicates that the particle production at forward
rapidity is not dominated by a contribution from hard processes. Charged
particle and photon distributions at = 62.4 GeV are
both observed to be consistent with the energy independent
limiting fragmentation scenario.
The photon production is observed to follow a
centrality independent limiting fragmentation scenario,
while the charged particles follow a centrality dependent
behavior. Comparison of the pseudorapidity distributions of positively
charged particles, negatively charged particles, pions, and
distributions from p + p collisions, indicate that
the baryons are responsible
for the centrality dependent limiting fragmentation behavior of
charged particles.
The study of limiting fragmentation for pions and net
protons show that mesons follow energy independent limiting fragmentation,
whereas baryons do not.
Acknowledgements.
We thank the RHIC Operations Group and RCF at BNL, and the NERSC Center at LBNL for their support. This work was supported in part by the HENP Divisions of the Office of Science of the U.S. DOE; the U.S. NSF; the BMBF of Germany; IN2P3, RA, RPL, and EMN of France; EPSRC of the United Kingdom; FAPESP of Brazil; the Russian Ministry of Science and Technology; the Ministry of Education and the NNSFC of China; SFOM of the Czech Republic, FOM and UU of the Netherlands, DAE, DST, and CSIR of the Government of India; the Swiss NSF; the Polish State Committee for Scientific Research; STAA of Slovakia, and the Korea Sci. & Eng. Foundation. We acknowledge the help of CERN for use of GASSIPLEX chips in the PMD readout. We thank S. Jeon for providing us the LEXUS results for comparison and G. Veres for providing us the NA49 data on net protons.References
- (1) K. H. Ackermann et al., Nucl. Instr. Meth. A 499, 624 (2003).
- (2) J. D. Bjorken, Phys. Rev. D 27, 140 (1983); L. D. Landau, Izv. Akad. Nauk Ser. Fiz. 17, 51 (1953); S. Belenkij and L. D. Landau, Usp. Fiz. Nauk. 56, 309 (1955); Nuovo Cim. Suppl. 3S10, 15 (1956); R. C. Hwa and K. Kajantie, Phys. Rev. D 32, 1109 (1985); J. Alam et al., Annals of Phys. 286, 159 (2000); B. Mohanty and J. Alam, Phys. Rev. C 68, 064903 (2003).
- (3) J. L. Klay et al. (E895 Collaboration), Phys. Rev. Lett. 88, 102301 (2002); J. L. Klay et al. (E895 Collaboration), Phys. Rev. C 68, 054905 (2003).
- (4) P. K. Netrakanti and B. Mohanty, Phys. Rev. C 71, 047901 (2005); J. Aichelin and K. Werner, Phys. Lett. B 300, 158 (1993).
- (5) L. V. Gribov, E. M. Levin and M. G. Ryskin, Phys. Rep. 100, 1 (1983); J. P. Blaizot and A. H. Mueller, Nucl. Phys. B 289, 847 (1987).
- (6) L. McLerran and R. Venugopalan, Phys. Rev. D 49, 2233 (1994); L. McLerran and R. Venugopalan, Phys. Rev. D 50, 2225 (1994); Y. V. Kovchegov, Phys. Rev. D 54, 5463 (1996); E. Iancu and L. McLerran, Phys. Lett. B 510, 145 (2001); A. Krasnitz and R. Venugopalan, Phys. Rev. Lett. 84, 4309 (2000).
- (7) K. Adcox et al. (PHENIX Collaboration), Phys. Rev. Lett. 86, 3500 (2001).
- (8) B. B. Back et al. (PHOBOS Collaboration), Phys. Rev. Lett. 87, 102303 (2001); B. B. Back et al. (PHOBOS Collaboration), Phys. Rev. Lett. 91, 052303 (2003).
- (9) D. Kharzeev, E. Levin and M. Nardi, Phys. Rev. C 71, 054903 (2005).
- (10) J. Adams et al. (STAR Collaboration), Phys. Rev. Lett. 95, 062301 (2005).
- (11) J. Benecke et al., Phys. Rev. 188, 2159 (1969); R. Beckmann, S. Raha, N. Stelte and R.M. Weiner, Phys. Lett. B 105, 411 (1981).
- (12) D. Kharzeev, Phys. Lett. B 378, 238 (1996); V. T. Pop et al., Phys. Rev. C 70, 064906 (2004).
- (13) K. Itakura, Y. V. Kovchegov, L. McLerran and D. Teaney, Nucl. Phys. A 730, 160 (2004).
- (14) J. Jalilian-Marian, Phys. Rev. C 70, 027902 (2004).
- (15) S. Jeon, V. T. Pop and M. Bleicher, Phys. Rev. C 69, 044904 (2004).
- (16) M. M. Aggarwal et al. (WA98 Collaboration), Phys. Rev. C 65, 054912 (2002).
- (17) H. Heiselberg, Phys. Rep. 351, 161 (2001).
- (18) B. Mohanty and J. Serreau, Phys. Rep. 414, 263 (2005); M. M. Aggarwal et al. (WA98 Collaboration), Phys. Rev. C 64, 011901(R) (2001).
- (19) K. H. Ackermann et al., Nucl. Instr. Meth. A 499, 713 (2003).
- (20) M. M. Aggarwal et al., Nucl. Instr. Meth. A 499, 751 (2003); M. M. Aggarwal et al., Nucl. Instr. Meth. A 488, 131 (2002).
- (21) X-N. Wang and M. Gyulassy, Phys. Rev. D 44, 3501 (1991).
- (22) B. Zhang et al., Phys. Rev. C 61, 067901 (2000).
- (23) F. S. Bieser et al., Nucl. Instrum. Meth. A 499, 766 (2003).
- (24) J. Adams et al. (STAR Collaboration), nucl-ex/0311017.
- (25) J. Putschke, Ph.D. Thesis, Max-Planck-Institut für Physik, Munich (2004); F. Simon, Ph.D. Thesis, Max-Planck-Institut für Physik, Munich (2004).
- (26) M. Oldenburg, Ph.D. Thesis, Max-Planck-Institut für Physik, Munich (2002).
- (27) C. Adler et al. (STAR Collaboration), Phys. Rev. Lett. 87, 112303 (2001).
- (28) V. Fine and P. Nevski, in Proceedings of CHEP-2000, Padova, Italy.
- (29) M. M. Aggarwal et al. (WA98 Collaboration), Phys. Lett. B 458, 422 (1999).
- (30) S. Jeon and J. Kapusta, Phys. Rev. C 56, 468 (1997).
- (31) W. Thome et al., Nucl. Phys. B 129, 365 (1977).
- (32) I. G. Bearden et al. (BRAHMS Collaboration), Phys. Lett. B 523, 227 (2001); I. G. Bearden et al. (BRAHMS Collaboration), Phys. Rev. Lett. 88, 202301 (2002).
- (33) D. Kharzeev and M. Nardi, Phys. Lett. B 507, 121 (2001); D. Kharzeev and E. Levin, Phys. Lett. B 523, 79 (2001).
- (34) I. G. Bearden et al. (BRAHMS Collaboration), Phys. Rev. Lett. 93, 102301 (2004).
- (35) M. M. Aggarwal et al. (WA93 Collaboration), Phys. Rev. C 58, 1146 (1998); M. M. Aggarwal et al. (WA93 Collaboration), Phys. Lett. B 403, 390 (1997).
- (36) K. Alpgard et al. (UA5 Collaboration), Phys. Lett. B 115, 71 (1982); G. J. Alner et al., Z. Phys. C 33, 1 (1986).
- (37) I. G. Bearden et al. (BRAHMS Collaboration), Phys. Rev. Lett. 94, 162301 (2005).
- (38) S. V. Afanasiev et al. (NA49 Collaboration), Phys. Rev. C 66, 054902 (2002).
- (39) H. Appelshäuser et al. (NA49 Collaboration), Phys. Rev. Lett. 82, 2471 (1999).
- (40) B. B. Back et al. (E917 Collaboration), Phys. Rev. C 66, 054901 (2002).