Experimental constraints on non-linearities induced by two-photon effects in elastic and inelastic Rosenbluth separations
Abstract
The effects of two-photon exchange corrections, suggested to explain the difference between measurements of the proton elastic electromagnetic form factors using the polarization transfer and Rosenbluth techniques, have been studied in elastic and inelastic scattering data. Such corrections could introduce -dependent non-linearities in inelastic Rosenbluth separations, where is the virtual photon polarization parameter. It is concluded that such non-linear effects are consistent with zero for elastic, resonance, and deep-inelastic scattering for all and values measured.
pacs:
13.40.Gp, 25.30.Fj, 12.20.FvI Introduction
Electron-proton (–) scattering has proven to be a powerful tool in the investigation of the structure of the nucleon. This interaction is typically described as the exchange between the electron and the proton of a single virtual photon. Because the electron is a point-like particle, any structure observed in – scattering must be related to the target structure. Moreover, the relatively small value of the electromagnetic coupling constant ensures that corrections to the one-photon exchange approximation should be relatively small. To further improve on the already impressive accuracy achieved in the analysis of electron scattering data, the contribution of two-photon exchange (TPE) effects in elastic – scattering are under theoretical investigation Maximon and Parke (2000); Blunden et al. (2003); Chen et al. (2004); Afanasev et al. (2005); Rekalo and Tomasi-Gustafsson (2004); Blunden et al. (2005); Kondratyuk et al. (2005). Two-photon exchange effects have garnered particular attention as of late due to their potential role in resolving the discrepancy between electromagnetic form factors measured through the Rosenbluth Separation method Walker et al. (1994); Arrington (2003); Christy et al. (2004); Qattan et al. (2005) and a polarization transfer technique Jones et al. (2000); Gayou et al. (2002) (see Sect. III).
Data from elastic and inelastic scattering, both in the resonance and deep-inelastic regimes, are here studied in light of this concern. There is a newly expanded, substantial data set which enables in particular a search for non-linearities caused by TPE effects. While dedicated measurements have been proposed for elastic data Arrington et al. , and a model-dependent analysis of non-linearity has been performed for elastic – scattering Tomasi-Gustafsson and Gakh (2005), this work represents a first detailed, model-independent study of non-linear effects in elastic and inelastic – scattering data.
II Rosenbluth Separation Technique
The differential cross section for – scattering can be expressed in the Born approximation in terms of absorption of longitudinal () and transverse () virtual photons as
| (1) |
where is the negative squared mass of the virtual photon, is the mass squared of the undetected system, and is the transverse virtual photon flux:
| (2) |
Here, is the fine structure constant, and are the energy of the initial and scattered electron, respectively, and is
| (3) |
where is the mass of the proton and . The variable is the relative longitudinal virtual photon flux. Therefore = 0 corresponds to a purely transverse photon polarization.
The Rosenbluth separation technique is used to separate the longitudinal and transverse components of the cross section. Here, Eq. (1) is written in the following form:
| (4) |
In the Born approximation, the left hand side, the reduced cross section, depends linearly on . To perform the Rosenbluth separation, data covering a range in at fixed values must be obtained. Any deviation from linearity must come from higher order terms that are not included in the standard radiative correction procedures.
III Two Methods of Form Factors Measurements and two Different Results
For the case of elastic scattering, the Rosenbluth separation technique is used to extract the form factors and , from the dependence of a reduced elastic cross section at fixed , i.e.
| (5) |
where .
At fixed , the form factors and can be extracted from a linear fit in to the measured reduced cross sections. Such a Rosenbluth fit yields as the intercept and as the slope. With increasing , the cross section is dominated by , while the relative contribution of the term is diminished. Precise understanding of the -dependence in the radiative corrections becomes crucial at high values of . Therefore, in order to measure the ratio at high values of , a polarization transfer method has also been employed in Hall A at Jefferson Lab (JLab).
In polarized elastic electron-proton scattering, the longitudinal and transverse components of the recoil polarization are sensitive to different combinations of the electric and magnetic elastic form factors Akheizer and Rekalo (1974); Arnold et al. (1981). The ratio of the form factors can be directly related to the components of the recoil polarization
| (6) |
where and are the longitudinal and transverse components of the final proton polarization, and is the angle between the initial and final directions of the lepton.
Recent measurements from Jefferson Lab using the polarization transfer technique to measure the ratio have found that decreases more rapidly than at large Jones et al. (2000); Gayou et al. (2002). This differs from results obtained at SLAC in a similar range using the Rosenbluth technique. There exist but two explanations for this discrepancy. There is either an unidentified systematic experimental uncertainty in the polarization transfer data, or a systematic uncertainty common to all Rosenbluth data.
It has been estimated that a 5-7% systematic correction to the dependence of the reduced Rosenbluth cross section measurements would be needed in order to resolve the discrepancy Arrington (2004a); Guichon and Vanderhaeghen (2003); Arrington (2005). However, a detailed analysis does not show any inconsistencies in the cross section data sets Arrington (2003). Moreover, new high cross section data from Jefferson Lab Christy et al. (2004); Qattan et al. (2005) are consistent with the older SLAC cross section data Andivahis et al. (1994) obtained in the same range. The results of Ref. Qattan et al. (2005), where the struck proton rather than the scattered electron was detected, have a precision comparable to the polarization transfer measurements. It must be concluded, then, that the needed 5-7% -dependent correction is not due to standard experimental considerations in the measured Rosenbluth cross sections.
It has been suggested Guichon and Vanderhaeghen (2003); Blunden et al. (2003) that the discrepancy may be explained by TPE effects not fully accounted for in the standard radiative corrections procedure of Mo and Tsai Mo and Tsai (1969). The polarization transfer technique involves a ratio of cross sections, and hence is expected not to be very sensitive to such effects Maximon and Parke (2000); Afanasev et al. (2005); Blunden et al. (2005). In contrast, these contributions can significantly affect the Rosenbluth separation technique. TPE contributions can be independent of (affecting both and in Eq. (5)), linear in (significantly affecting ), or non-linear in .
The experimental evidence for significant TPE contributions to the form factor measurements is still quite limited. While the non-zero transverse beam spin asymmetry Wells et al. (2001); Maas et al. (2005) provides direct evidence for TPE in elastic – scattering, we are lacking similar evidence for such effects on the unpolarized cross sections. The discrepancy between polarization transfer and Rosenbluth extractions of provides only an indirect indication of a missing correction, while direct searches for TPE through the comparison of electron–proton and positron–proton scattering yield some evidence of deviations from the Born approximation at low , but only at the three sigma level Arrington (2004b). Observation of a deviation from linearity in the reduced cross section would provide a clear indication of TPE (or other higher order corrections not included in standard radiative correction procedures), though only the non-linear portion of the correction could be directly isolated. New high-precision Rosenbluth data in elastic Qattan et al. (2005) and inelastic Liang et al. (2004) – scattering allow for a much more sensitive search for such non-linearities.
This work reports results of a search for effects of TPE corrections in elastic and inelastic scattering data by searching for -dependent non-linearities in existing Rosenbluth separations. We note that this analysis will not be sensitive to either systematic shifts in the reduced cross section of Eq. (4), or to two-photon effects which are linear in .
IV Data Overview
Table 1 lists the data sets included in the present analysis. We include several measurements of elastic – to cover a range in , while the SLAC measurements Dasu et al. (1988, 1994) and the recent JLab measurement Liang et al. (2004) cover the DIS and resonance regions.
| # of | Typ. | Lab | ||
| Elastic data | [(GeV/c)2] | L–Ts | ||
| Janssens et al. Janssens et al. (1966) | 0.2–0.9 | 20 | 4.7% | Mark III |
| Litt et al. Litt et al. (1970) | 2.5–3.8 | 4 | 1.7% | SLAC |
| Berger et al. Berger et al. (1971) | 0.4–1.8 | 8 | 2.6% | Bonn |
| Walker et al. Walker et al. (1994) a | 1.0–3.0 | 4 | 1.1% | SLAC |
| Andivahis et al. Andivahis et al. (1994) b | 1.8–5.0 | 5 | 1.3% | SLAC |
| Christy et al. Christy et al. (2004) | 0.9–5.2 | 7 | 1.3% | JLab |
| Qattan et al. Qattan et al. (2005) c | 2.64–4.1 | 3 | 0.6% | JLab |
| Inelastic data | [GeV2] | |||
| Liang et al. Liang et al. (2004) | 1.3–3.9 | 191 | 1.7% | JLab |
| Dasu et al. Dasu et al. (1988, 1994) | 3.2–30 | 61 | 3.0% | SLAC |
| a Data below are excluded. | ||||
| b Data from 8 GeV spectrometer. | ||||
| c Excludes “slope” systematic uncertainties. | ||||
For elastic – scattering, we examine Rosenbluth extractions from several different experiments. We study the Rosenbluth separation for the experiments and values listed in Table II of Ref. Arrington (2003), including the updated radiative corrections Arrington (2003). In addition, data from two recent Jefferson Lab measurements Christy et al. (2004); Qattan et al. (2005) are included. In all cases, the reduced cross sections are taken from a single experiment and single detector. Where necessary, cross section values at slightly different values are shifted to a fixed values. Only small corrections were needed, typically below 2%, although a handful of points were corrected by 5–10%. There are a total of 51 Rosenbluth separations that we will examine for non-linearities. Typical point-to-point uncertainties are roughly 1–2% for most of the data sets, although several of the older experiment had larger uncertainties and the E01-001 results Qattan et al. (2005) have point-to-point uncertainties below one percent.
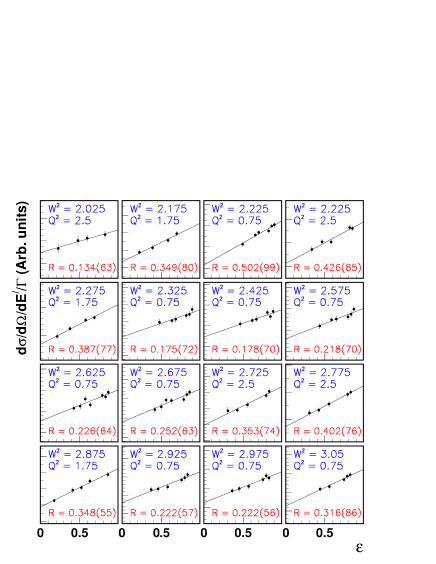
For the resonance region, we used newly obtained data from JLab Hall C experiment E94-110 Liang et al. (2004); Liang (2002), which was utilized to separate the longitudinal and transverse unpolarized proton structure functions in the nucleon resonance region via the Rosenbluth separation technique. The experiment ran with seven different energies ranging from 1.2 GeV to 5.5 GeV over a scattering angle range 12.979.9. The total point-to-point uncertainty on the cross section measurements was approximately 2% Liang (2002). The data taken from this experiment were used to perform 191 Rosenbluth separations covering the kinematic region 0.55.0 (GeV/c)2 and 1.14.0 GeV2. Examples of these Rosenbluth separations are shown in Fig. 1. These data were used to extract the ratio, , of longitudinal to transverse cross section components. Rosenbluth separations are performed in five bins and 43 bins. The cross section values are interpolated to the central and values of each bin using a global fit to the world’s resonance region data Liang et al. (2004); Niculescu et al. (2000), with constraints built in to provide a smooth transition to the DIS region and the limit. Typical corrections were 5%, and data that required corrections larger than 60% were excluded. While a few points had large enough corrections that the uncertainty in the interpolation may not be negligible for the given data set, their effect on the extracted values of should be small and random, thus providing a negligible contribution to the uncertainty in the extracted limits on .
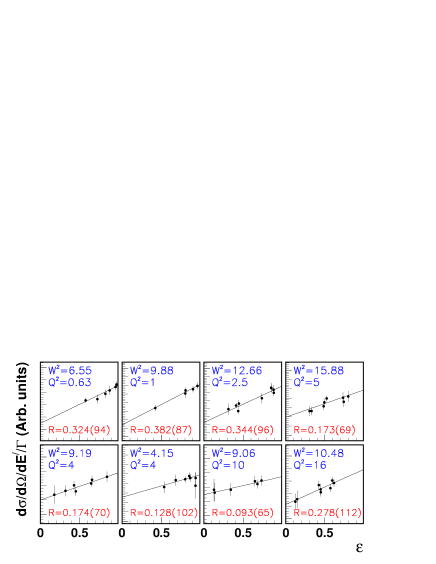
For the deep-inelastic scattering (DIS) region, the data from experiment E140 at SLAC Dasu et al. (1988, 1994) have been used. A total of 61 Rosenbluth separations have been performed covering the kinematic region 0.6320 (GeV/c)2 and 2.530 GeV2. The total point-to-point uncertainties on the cross section measurements depends on the actual kinematics, but are typically 2–3%. Example Rosenbluth separations from E140 are shown in Fig. 2.
The data from the JLab E94-110 and SLAC E140 experiments are by far the largest data sets available for inelastic Rosenbluth separations, while the new elastic measurements from JLab E01-001 provide significantly more precise data for elastic scattering.
V Analysis and Results
From the discussions of Sections II and III it is clear that the linearity of the reduced cross section in Eq. (4) is a crucial component of the Rosenbluth technique, and that two-photon exchange corrections could introduce a non-linear -dependence in Eq. (4). Therefore, such corrections could manifest themselves as non-linearities in Figs. 1 and 2.
To search for such non-linearities, the following analysis has been performed. For each data set with three or more values at fixed and , the reduced cross sections are fit to a quadratic in , of the form
| (7) |
In the absence of TPE, we expect , , and . TPE corrections can modify and , and may introduce a non-zero value of , the fractional curvature relative to the , the cross section at . The only estimates we have for the size of the non-linearity come from calculations for elastic – scattering. If one takes the calculations Blunden et al. (2003); Chen et al. (2004) of TPE effects for elastic scattering and scales the size of the corrections so that they are large enough to explain the discrepancy between polarization and Rosenbluth extractions, as done in Arrington et al. , one obtains values of 6–9%, although the precise value depends significantly on and the range of the data.
While represents the fractional curvature, the size of cross section deviations from linearity will be much smaller. For %, the maximum deviation of the cross section from would be 2.5%, at . The effects are even smaller if the range of the data, , is less than one. In this case, the deviations from will go approximately as . Finally, when one performs the Rosenbluth separation, the extracted values of and will be shifted from their true values in order to minimize the deviation from the straight line fit, reducing the deviations by roughly a factor of two from the size of the contribution in Eq. 7. Thus, the maximum observed deviations from linearity will be,
| (8) |
typically more than a factor of ten smaller than the value of . For the expected values of 10% and a rather large range of 0.8, one expects maximum deviations from linearity to be at the level of 0.8%. So even with high precision measurements and a good range, one needs a large data set to provide meaningful limits on the non-linearities.
We perform the fit from Eq. 7 for each of the elastic, resonance region, and DIS Rosenbluth data sets. Figures 3 and 4 show , binned in for the elastic data, and binned in for the resonance and DIS data. The results are consistent with no non-linearities, and there is no apparent or dependence. Table 2 shows the extracted value for , the 95% confidence level upper limit on , and the approximate maximum deviation from linearity for the elastic, resonance region, and DIS ( GeV2) data. From these results, we determine the 95% confidence level upper limits on % for the elastic data and 10.7% for the inelastic data. This yields limits on the deviations of the data from the Rosenbluth fit of roughly 0.4% (0.7%) for the elastic (inelastic), assuming a range of 0.7.
| 95% C.L. | 95% C.L. | ||
|---|---|---|---|
| Elastic | 0.019(27) | 0.064 | 0.8% |
| Resonance | -0.060(42) | 0.086 | 1.1% |
| DIS | -0.012(71) | 0.146 | 1.8% |
Note that it is also possible for a purely linear correction to introduce a small non-linearity, since
| (9) |
where and is the TPE correction factor. For the elastic data at high and all of the inelastic data presented here, , while estimates TPE predict a change in slope, , of approximately 5%. Hence, the nonlinear term arising from a linear TPE correction, , will be very small, yielding %. At low values, the value of for the elastic cross section becomes quite large, yielding values of on the scale of for . However, is only this large for GeV2, where the TPE corrections decrease as Blunden et al. (2005); Guichon and Vanderhaeghen (2003); Arrington (2004b, 2005). The effect is 1% if one assumes that increases slowly as one goes up from , as it does in calculations Blunden et al. (2005) and phenomenological extractions of the TPE corrections Guichon and Vanderhaeghen (2003); Arrington (2005). If one takes a more rapid increase with , , we obtain values of coming from the linear correction of 1.5–2.5% for GeV2. Thus, the size of this effect should be well below the sensitivity of the existing data in all cases.
To better visualize the limits on nonlinearities, we have also performed a global comparison of the residuals between the reduced cross sections and a linear fit to the reduced cross sections. For the previous fit, data sets with a very small range have very little sensitivity to the curvature. Although these data sets have large uncertainties, they still provide meaningful values. When plotting the residuals, we want to exclude such data sets because the data points have uncertainties comparable to the other data sets, but the residuals little sensitivity to non-linearities. Thus, we require include only those data sets where when studying the residuals. This cut reduces the number of data sets to 35 for elastic kinematics, 77 in the resonance region, and 38 in the DIS region.
For the data sets with sufficient coverage, we take to be the residual from the Rosenbluth (one-photon exchange) fit,
| (10) |
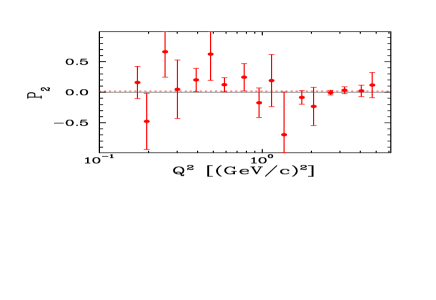
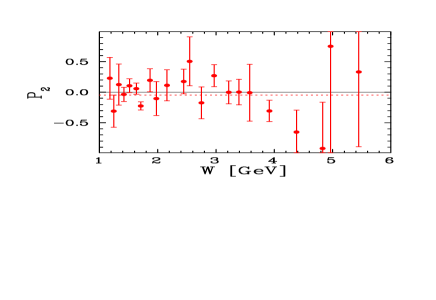
and obtain a value of for every cross section measurement in the Rosenbluth data sets. We can then determine the weighted average value from the extracted values in bins for the elastic, resonance region, and inelastic data sets. In the absence of TPE contributions, one expects in every bin and, hence, any dependence to is an indication of two-photon exchange. Figure 5 shows the combined as a function of for the elastic, resonance region, and DIS data, and all three data sets are consistent with =0. One can see that while the elastic and resonance region data have high precision, the resonance region data has less data as and 1, while the DIS data has limited data an low , as well as lower statistical precision in general.
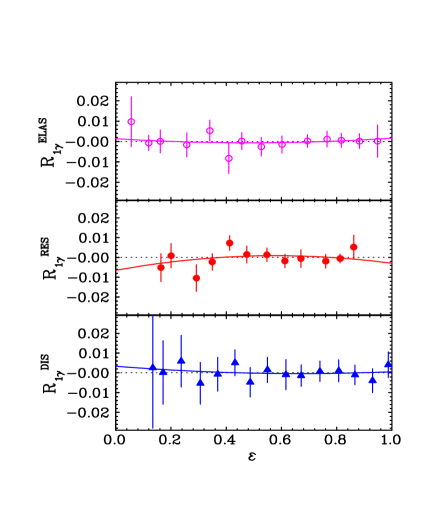
We fit the combined residuals to the form
| (11) |
where , , and are the fit parameters. Because we are fitting to residuals that have already had the expected linear cross section dependence removed, we expect that will average to zero, yielding in the absence of any strong dependence. Indeed, we find % for the elastic, resonance, and DIS data. The quadratic fit to yields a curvature parameter, , consistent with zero for all data sets. We obtain % for the elastic data, % for the resonance region data, and % for the DIS measurements.
While the limits in Tab. 2 provide the best quantitative limits on deviations from linearity, the residuals shown in Fig. 5 give a better idea of the sensitivity of the different data sets in different regions of . The parameterization of Eq. 7 assumes a simple quadratic non-linear term, while some models for the contribution to elastic scattering indicate larger non-linearities for . From Fig. 5 we see that this region is not as well constrained for the resonance region data, while very low values are not well constrained except in the elastic data.
VI Conclusion
We have searched for possible two-photon exchange contributions that show up as non-linearities in Rosenbluth separations. We have used existing data in the elastic and deep-inelastic scattering region and recent data in the nucleon resonance region. We do not find any evidence for TPE effects. The 95% confidence level upper limit on the curvature parameter, , was found to be 6.4% (10.6%) for the elastic (inelastic) data. This limits maximum deviations from a linear fit to 0.4% (0.7%) for typical elastic (inelastic) Rosenbluth separation data sets.
Acknowledgements.
This work was supported in part by research grants 0099540 and 9633750 from the National Science Foundation and DOE grant W-31-109-ENG-38. The authors wish to thank Arie Bodek for useful discussions and comments.References
- Maximon and Parke (2000) L. C. Maximon and W. C. Parke, Phys. Rev. C61, 045502 (2000).
- Blunden et al. (2003) P. G. Blunden, W. Melnitchouk, and J. A. Tjon, Phys. Rev. Lett. 91, 142304 (2003).
- Chen et al. (2004) Y. C. Chen, A. Afanasev, S. J. Brodsky, C. E. Carlson, and M. Vanderhaeghen, Phys. Rev. Lett. 93, 122301 (2004).
- Afanasev et al. (2005) A. V. Afanasev, S. J. Brodsky, C. E. Carlson, Y.-C. Chen, and M. Vanderhaeghen, Phys. Rev. D72, 013008 (2005).
- Rekalo and Tomasi-Gustafsson (2004) M. P. Rekalo and E. Tomasi-Gustafsson, Eur. Phys. J. A22, 331 (2004).
- Blunden et al. (2005) P. G. Blunden, W. Melnitchouk, and J. A. Tjon, Phys. Rev. C72, 034612 (2005).
- Kondratyuk et al. (2005) S. Kondratyuk, P. G. Blunden, W. Melnitchouk, and J. A. Tjon (2005), eprint nucl-th/0506026.
- Walker et al. (1994) R. C. Walker et al., Phys. Rev. D 49, 5671 (1994).
- Arrington (2003) J. Arrington, Phys. Rev. C 68, 034325 (2003).
- Christy et al. (2004) M. E. Christy et al., Phys. Rev. C 70, 015206 (2004).
- Qattan et al. (2005) I. A. Qattan et al., Phys. Rev. Lett. 94, 142301 (2005).
- Jones et al. (2000) M. K. Jones et al., Phys. Rev. Lett. 84, 1398 (2000).
- Gayou et al. (2002) O. Gayou et al., Phys. Rev. Lett. 88, 092301 (2002).
- (14) J. Arrington et al., Jefferson lab experiment E05-017.
- Tomasi-Gustafsson and Gakh (2005) E. Tomasi-Gustafsson and G. I. Gakh, Phys. Rev. C 72, 015209 (2005).
- Akheizer and Rekalo (1974) A. I. Akheizer and M. P. Rekalo, Sov. J. Part. Nucl. 4, 236 (1974).
- Arnold et al. (1981) R. G. Arnold, C. E. Carlson, and F. Gross, Phys. Rev. C 23, 363 (1981).
- Arrington (2004a) J. Arrington, Phys. Rev. C 69, 022201(R) (2004a).
- Guichon and Vanderhaeghen (2003) P. A. M. Guichon and M. Vanderhaeghen, Phys. Rev. Lett. 91, 142303 (2003).
- Arrington (2005) J. Arrington, Phys. Rev. C 71, 015202 (2005).
- Andivahis et al. (1994) L. Andivahis et al., Phys. Rev. D 50, 5491 (1994).
- Mo and Tsai (1969) L. W. Mo and Y.-S. Tsai, Rev. Mod. Phys. 41, 205 (1969).
- Wells et al. (2001) S. P. Wells et al. (SAMPLE), Phys. Rev. C 63, 064001 (2001).
- Maas et al. (2005) F. E. Maas et al., Phys. Rev. Lett. 94, 082001 (2005).
- Arrington (2004b) J. Arrington, Phys. Rev. C 69, 032201(R) (2004b).
- Liang et al. (2004) Y. Liang et al. (Jefferson Lab Hall C E94-110) (2004), eprint nucl-ex/0410027.
- Dasu et al. (1988) S. Dasu et al., Phys. Rev. Lett. 61, 1061 (1988).
- Dasu et al. (1994) S. Dasu et al., Phys. Rev. D 49, 5641 (1994).
- Janssens et al. (1966) T. Janssens, R. Hofstadter, E. B. Huges, and M. R. Yearian, Phys. Rev. 142, 922 (1966).
- Litt et al. (1970) J. Litt et al., Phys. Lett. B 31, 40 (1970).
- Berger et al. (1971) C. Berger, V. Burkert, G. Knop, B. Langenbeck, and K. Rith, Phys. Lett. B 35, 87 (1971).
- Liang (2002) Y. Liang, Ph.D. thesis, American University (2002).
- Niculescu et al. (2000) I. Niculescu et al., Phys. Rev. Lett. 85, 1186 (2000).