\runauthorD. Miśkowiec
Collection of CERES Results
Abstract
The measurement of central Pb+Au collisions at the maximum SPS energy of 158 GeV per nucleon in the fall of 2000 was the first run of the fully upgraded CERES and at the same time the last run of this experiment. Today, after several years of tedious calibration, the physics analysis is in its peak. A snapshot of the current results is presented here.
1 Introduction
CERES is a dilepton experiment at the CERN SPS, known for its observation of enhanced production of low mass e+e- pairs in collisions between heavy nuclei [1]. The fact that the excess pairs had invariant masses above approximately twice the pion mass and that the enhancement was absent in proton induced collisions [2] pointed towards pion annihilation as the additional source of lepton pairs. To fully account for the measured spectrum, however, the shape of the peak needs to be modified. Theoretical models expect a shift of the peak to lower masses [3] or a broadening and a slight shift up [4] when is immersed in high density hadronic matter. Testing the predictions of (and possibly distinguishing between) the two scenarios was among the objectives of the CERES upgrade. In this note I list several results of the ongoing analysis of the data from the last run of the upgraded CERES. For the sake of limited space two of the topics presented in the talk, the elliptic flow of and the back-to-back correlations, are omitted. These results are described in detail in [5] and [6], respectively.
2 Experiment
The upgrade of CERES in 1997-1998 by a radial Time Projection Chamber (TPC) allowed to improve the momentum resolution and the particle identification capability while retaining the cylindrical symmetry. The TPC also opened the possibility of measuring hadrons. The upgraded experiment is shown in Fig. 1. Charged particles emitted from a segmented Au target first pass through two silicon drift detectors (SDD) located 100 mm and 138 mm from the target. The two detectors are used to reconstruct angles of the charged particle tracks with =0.2 mrad and =2 mrad, and the interaction vertex with m, the coordinate being along the beam axis. Subsequently, the particles traverse two RICH detectors with =32 which serve for electron identification. In the upgraded CERES the magnetic field between the two RICHes is switched off and thus the rings in the two RICHes are aligned which leads to a better particle identification.
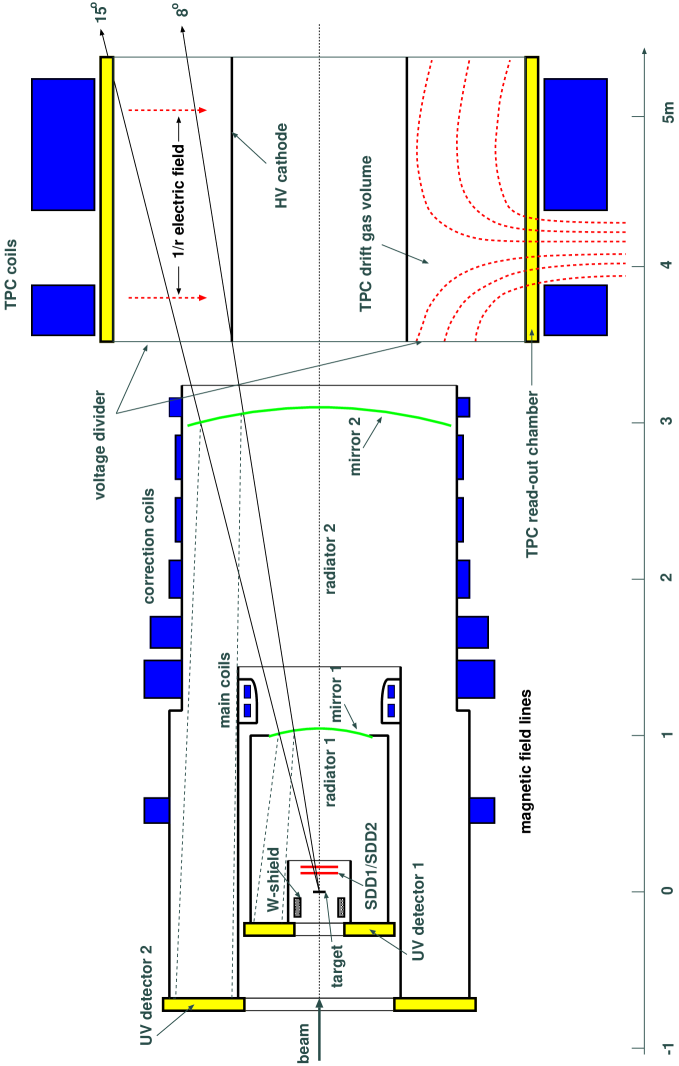
Finally, the particles pass through the newly built TPC. The ionization electrons drift outward towards the 16 readout chambers. The electric field is inversely proportional to the radius and thus the drift is fastest where the hit density is highest. The semi-radial magnetic field deflects the particles in the azimuthal direction. The momentum resolution reached after the final calibration is
| (1) |
resulting in for the meson in the e+e- channel. Independent particle identification is achieved using the energy loss in the TPC gas with .
The data presented here come from the run in the fall 2000. In this run about 30 million Pb+Au collision events at 158 GeV per nucleon were collected, most of them with centrality of top 7% of geometrical cross section. Small samples of the 20% and the minimum bias collisions, as well as a short run at 80 AGeV, were recorded in addition.
3 Centrality and charged particle multiplicity
The collision centrality was determined via the charged particle multiplicity around midrapidity /2=2.91. Two variables, the amplitude of the Multiplicity Counter (MC) (single scintillator covering 2.33.5) and the track multiplicity in the TPC (2.12.8), were alternatively used as the centrality measure (Fig. 2).
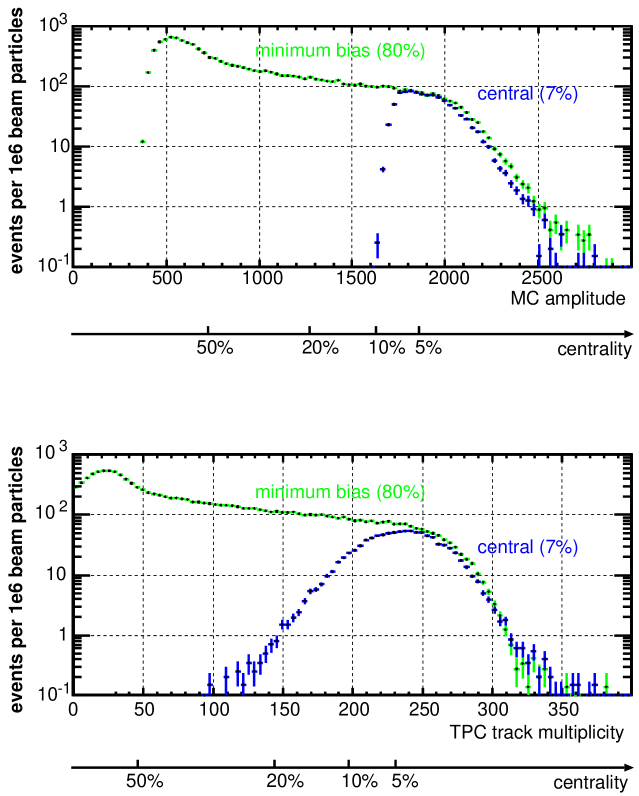
Knowing the data acquisition dead time factor and the target thickness, and assuming that all beam particles were hitting the target, the event counts can be translated to the cross section for collisions with a given multiplicity. The integrated cross section, divided by the geometrical cross section barn, is shown as the additional axis in Fig. 2.
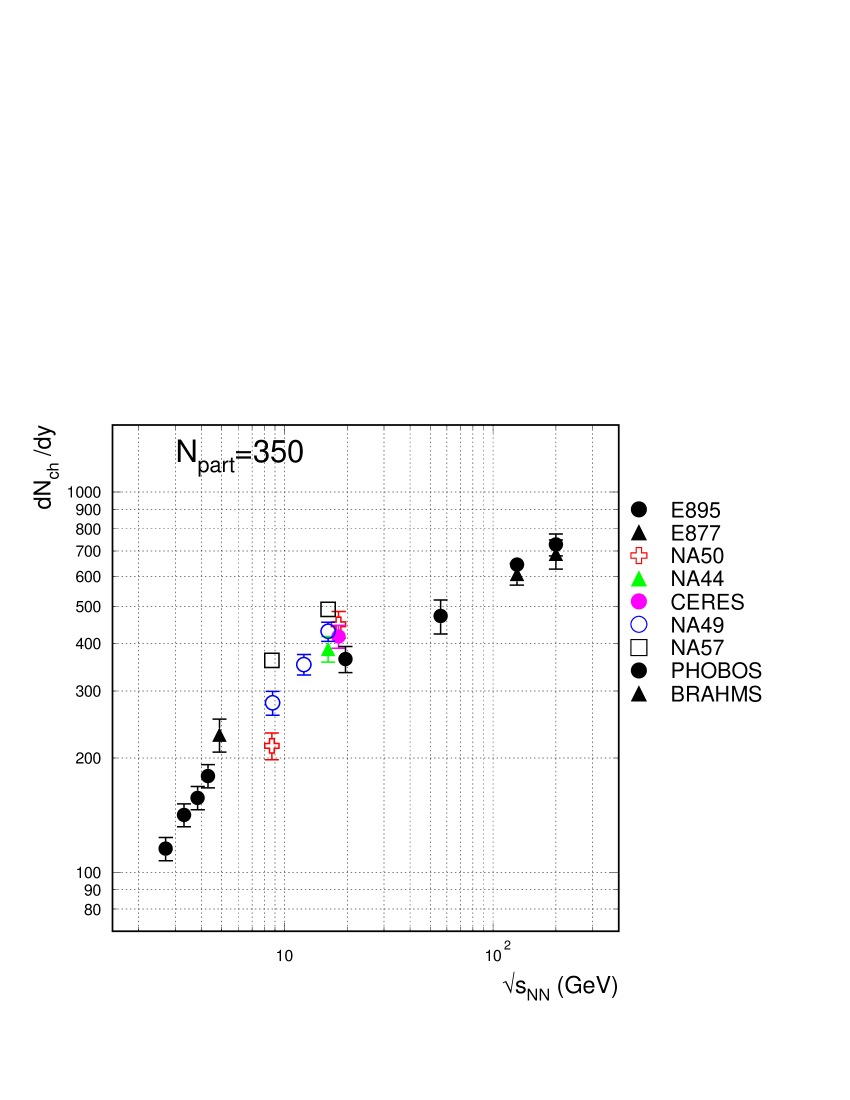
Charged particle multiplicity within 23 was determined from coincidences between the hits in the two silicon detectors. Random coincidences, estimated by rotating one of the detectors, were subtracted. The finite two-hit resolution problem was solved by requiring certain minimum separation between every pair of hits and extrapolating to . The -electron contribution was estimated from a run with beam trigger and subtracted. The resulting pseudorapidity density of charged particles per participant, extrapolated to where the maximum is expected to be, is d/d(3.1)/=1.180.15 (syst.), independent of centrality within 0-50%. The number of participants for a given centrality is calculated using the nuclear overlap model [7]. The central collision d/d(2.9), estimated via 1.02 times d/d(3.1), fits the available beam energy systematics (Fig. 3).
4 Dileptons
Electron tracks are identified by requiring a ring in the combined RICH detectors and a high in the TPC. The combined electron efficiency and the pion suppression factor are 68% and 4, respectively, for =1.5 GeV/c. The e+e- pairs from Dalitz decay and from conversion are recognized via their small opening angle and marked such that they are not paired with other electrons. The combinatorial background is removed from the e+e- mass distribution by subtracting the like-sign or the event-mixing spectrum. The resulting signal spectrum is corrected for efficiency, determined in a Monte Carlo simulation and parametrized in terms of a single track efficiency. The latter depends primarily on the hit density and varies between 0.2 and 0.5 for 0.140.24. The efficiency corrected and absolutely normalized mass spectrum exhibits an enhancement of e+e- pairs in the mass range between 0.2 and 0.6 GeV/c2 by a factor of 2.80.5 (stat). This is shown in the left panel of Fig. 4. The systematic error of the overall normalization is 21%.
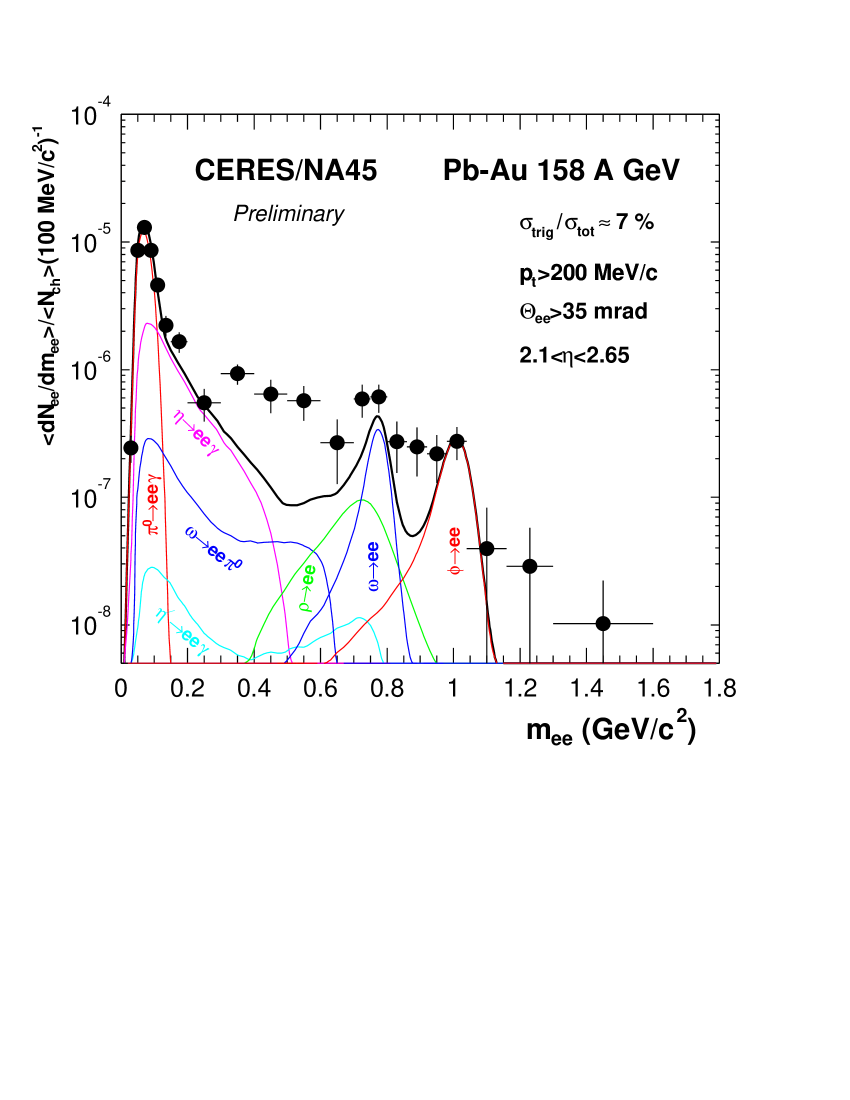
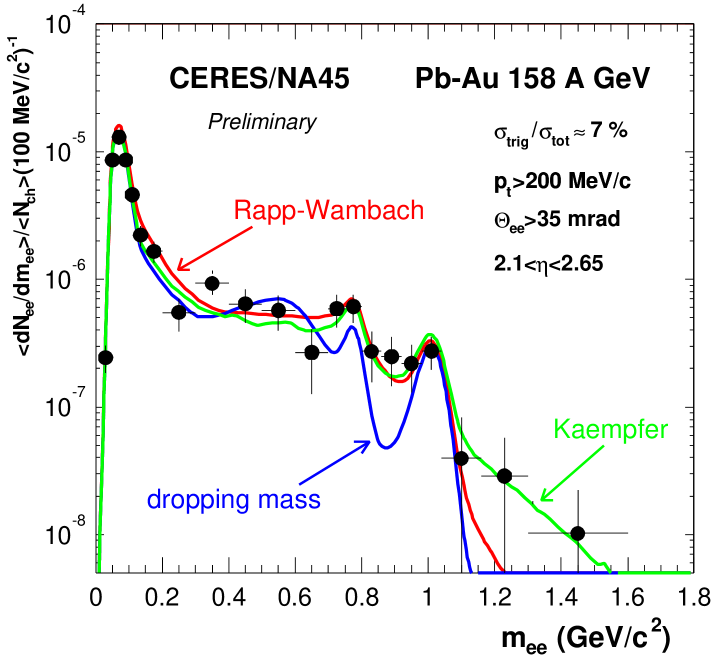
The three model calculations, compared to the data in the right panel of Fig. 4, are based on three different scenarios. The line labelled with “Rapp-Wambach” represents a calculation including a modification of the spectral function by hadronic medium [4]. The “dropping mass” line is a result of a calculation by R. Rapp in which the meson is shifting according to the Brown-Rho scaling [3]. Finally, a thermal emission calculation gives the line labelled as “Kaempfer” [9]. The calculations were done for the actual centrality and agree reasonably well with the experimental data except for the “dropping mass” curve which in the region between and exhibits a minimum not present in the data.
5 Resolution of the puzzle
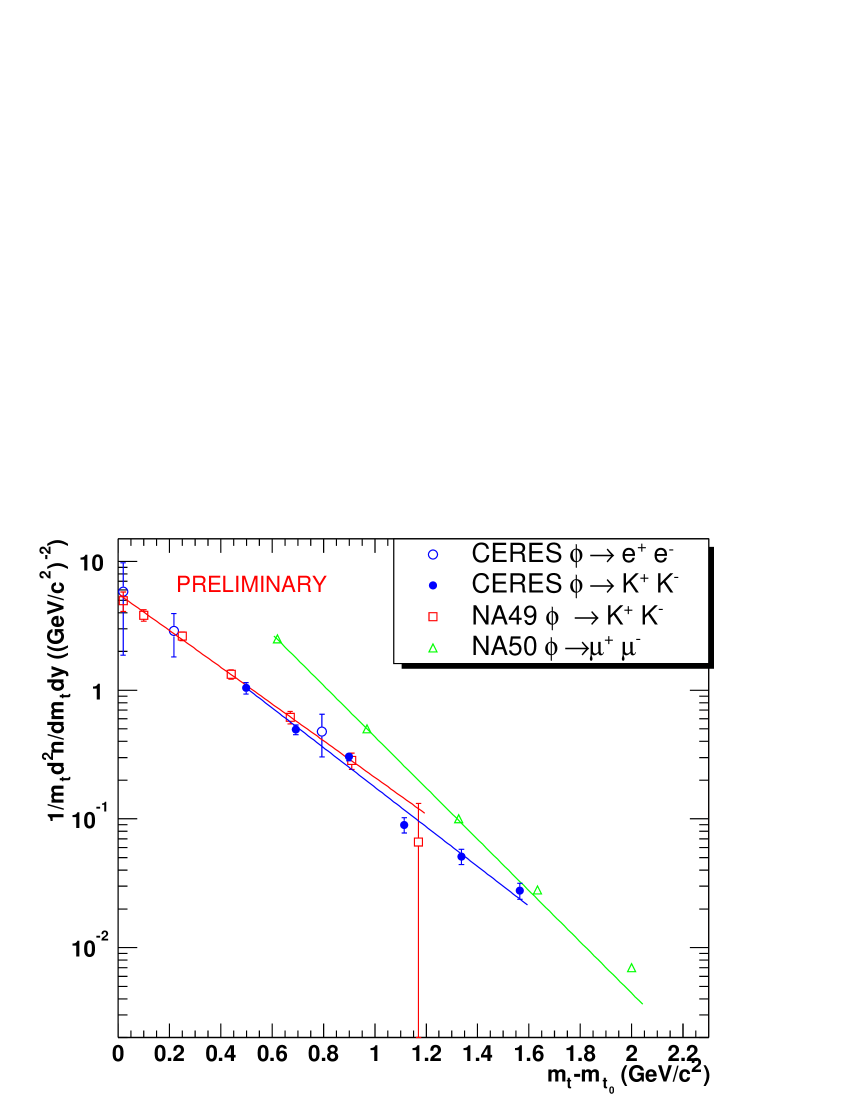
The discrepancy between the measured in the KK and channels respectively by NA49 and NA50, pointed out in [10], might indicate a possible medium effect on the decay or on its reconstruction probability in the experiment. Indeed, short-lived mesons decaying to hadrons inside the fireball may get reconstructed with a wrong invariant mass, or not reconstructed at all, because of the rescattering of the decay products. The vacuum lifetime of the meson, however, is too long for this effect to explain the observed difference between the hadronic and leptonic channels [11]. The upgraded CERES is capable of measuring hadrons and thus reconstructing . The e+e- channel was evaluated by integrating the absolutely normalized dielectron mass spectrum between 0.9 and 1.1 GeV/c2, and reducing the obtained number by 28% to account for the possible high mass tail of the meson. The -spectra of reconstructed in these two ways agree within the error bars and are consistent with the result obtained by NA49 (Fig. 5).
6 Pion-proton correlations
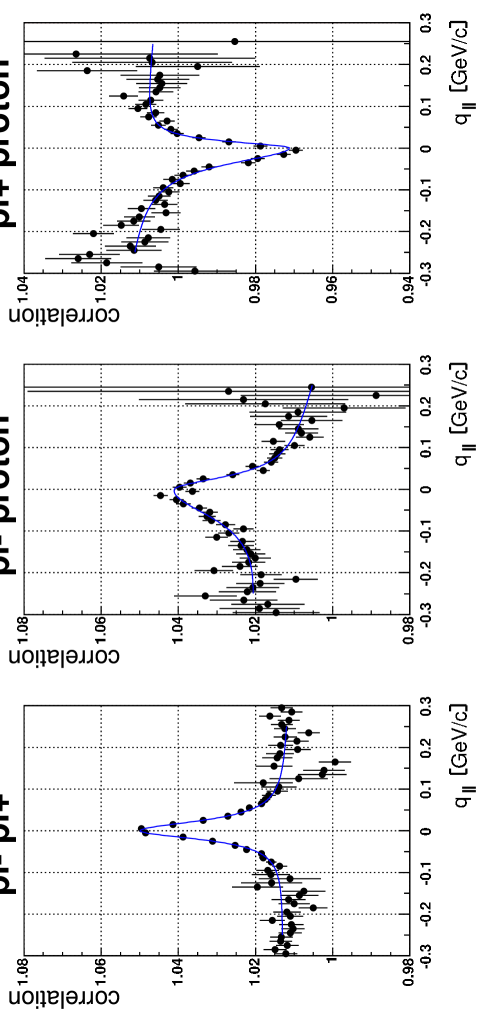
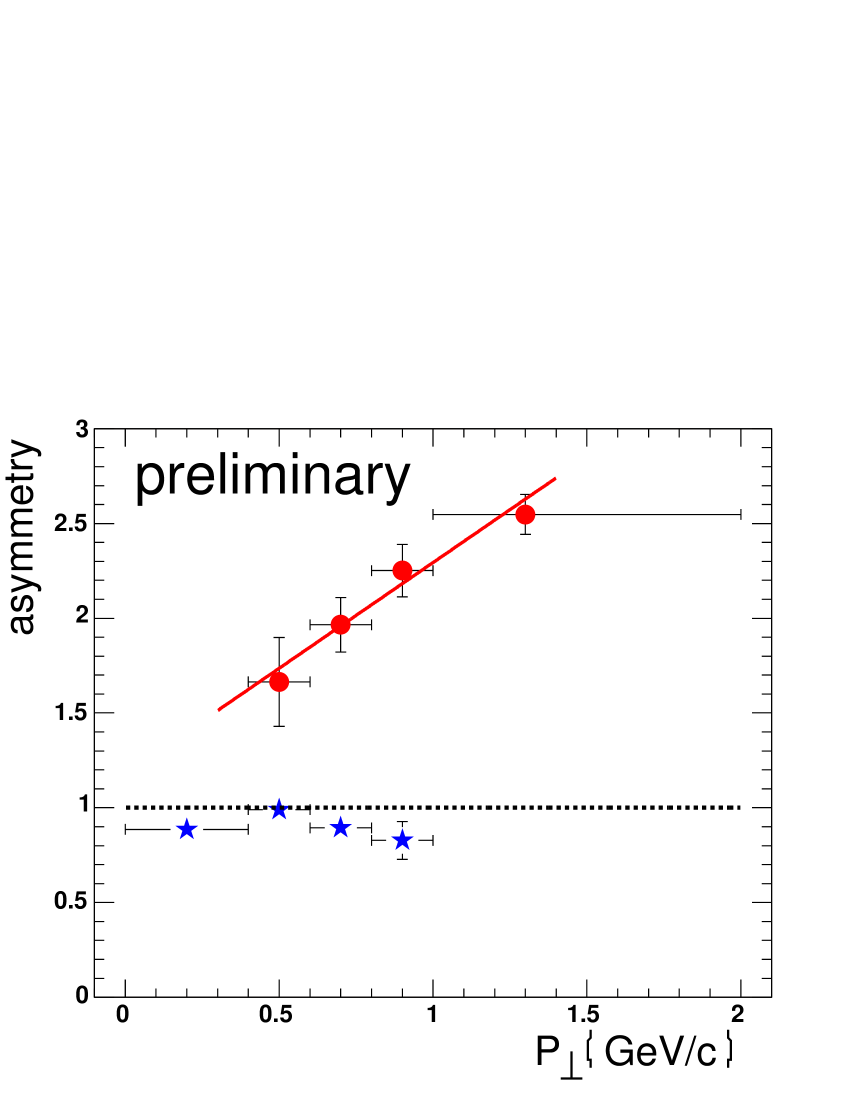
The shape of non-identical particle correlation functions , , reflects the shape of the relative source distributions . Particularly, a difference between the average freeze-out position or time of two particle species reveals itself as an asymmetry of the correlation function at small [12]. Slices of , p, and p correlation functions are shown in Fig. 7. The structures at low come from the mutual Coulomb interaction. The asymmetry in the pion-proton correlations indicates that the proton source is located at a larger radius than the pion source, or that protons are emitted earlier than pions. The asymmetry can be conveniently parametrized by fitting a Lorentz curve, which happens to match the shape, separately to the left and to the right half of the peak, and taking the ratio of the two widths. A pair generator with a 6.5 fm displacement between the sources of protons and pions can reproduce the asymmetry observed for pairs with a within 0.6-2 GeV/c. A detailed dependent analysis is in progress (Fig. 7).
7 Transverse momentum fluctuations
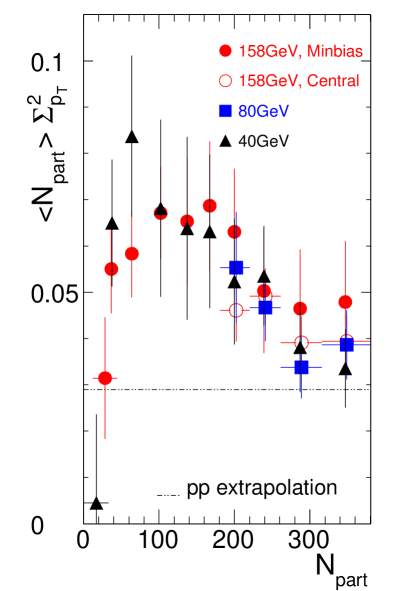
Enhanced event-by-event fluctuations of transverse momenta are considered to be one of the signatures of the vicinity to the critical point of the QCD phase transition. Unfortunately, the fluctuations observed so far turned out to be rather independent of beam energy [13]. On the other hand, the fluctuations seem to be a non-monotonic function of centrality (Fig. 8). The variable used there is the difference between the variances of the (events) and (tracks) distributions, scaled such to be zero in the case of independent particle emission [14], and normalized to the mean .
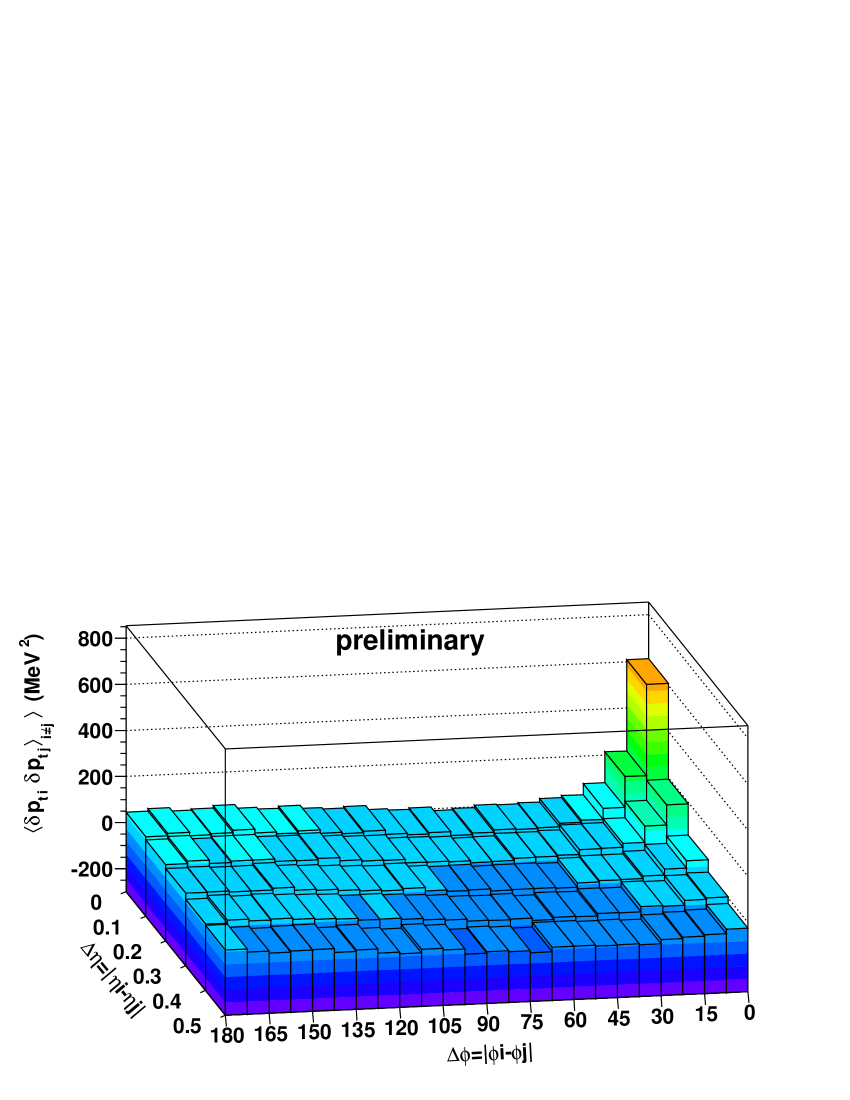
More insight into the origin of the observed fluctuations is gained by studying the transverse momentum covariance [15] between pairs of tracks of a given opening angle. The covariance map (Fig. 10)
reveals several structures and demonstrates that if the fluctuations were to be characterized by one single number the result would depend on the experiment’s acceptance. The landscape is dominated by the short range correlation peak at small opening angles, most probably originating from Bose-Einstein and Coulomb effects between pairs of particles emitted with similar velocities, and the broad maximum at =180o which contains back-to-back correlations like those observed at RHIC and the SPS [16]. The elliptic flow introduces a cos(2) modulation. The slight decrease with increasing , which can be reproduced in event mixing, comes probably from the () dependence.
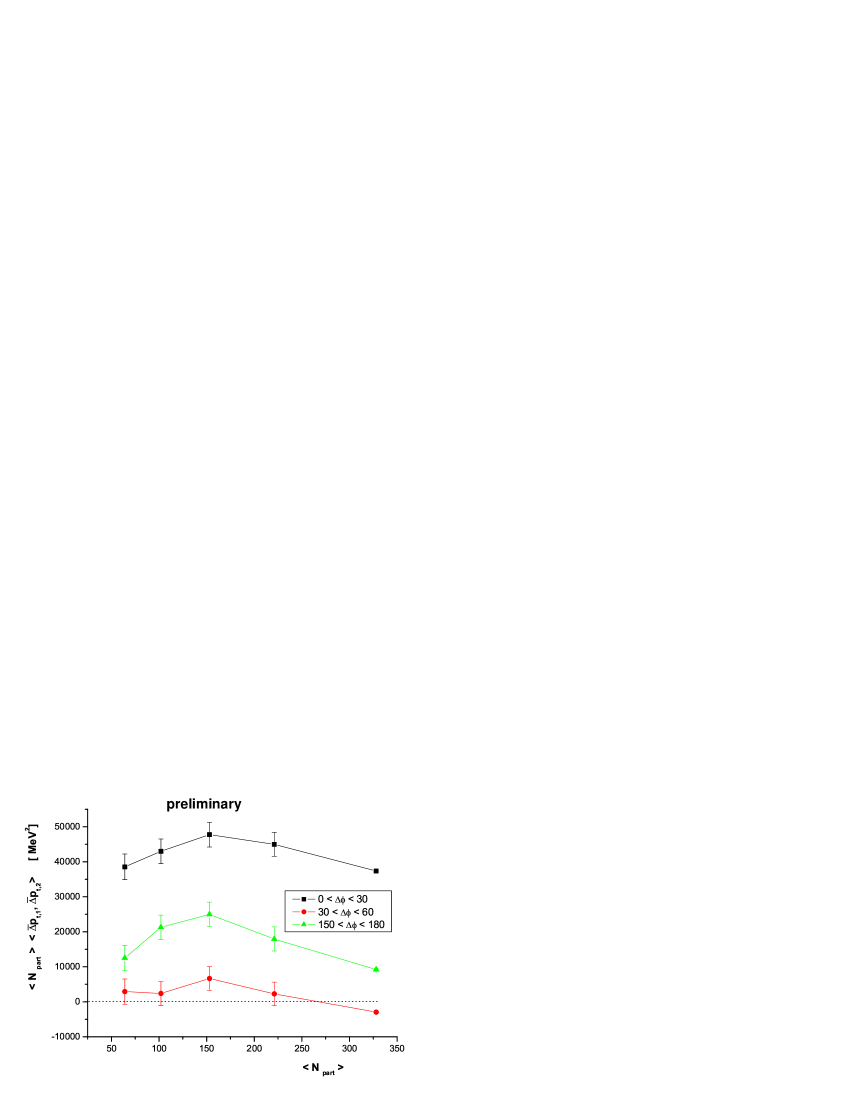
The overall fluctuations thus seem to be dominated by the short range and the away-side two-particle correlations which are not expected to be sensitive to the critical point. The non-monotonic centrality dependence of the overall fluctuations is indeed visible in the separate analysis of these two components (two upper sets of points in Fig. 10). Since the critical point fluctuations should be present for all opening angles the best strategy seems to be to focus on the fluctuations in the region of , free of the influence of the two mentioned components, and where the elliptic flow does not matter. The fluctuations in this region turn out to be close to zero and independent on centrality within the error bars (lowest set of points in Fig. 10). It would be interesting to analyze the beam energy dependence of this quantity.
8 Summary
The data of the upgraded CERES run confirms the existence of a dilepton excess in the range between the and the . With the improved mass resolution the data disfavors the dropping -meson mass scenario in its present implementation.
The discrepancy between the NA49 and NA50 measurements of the hadronic and leptonic decays of the meson is not manifest in the CERES data. The e+e- and K+K- decay channels are mutually consistent and are in agreement with the NA49 measurement.
The distributions of pions and protons at freeze-out are either displaced by about 6 fm or these two particle species are emitted, on average, at different times. This is the result of an analysis of the Coulomb correlations between pions and protons.
A differential analysis identifies the short range correlations and the away-side correlations as the dominant source of the event-by-event fluctuations. The pairs emitted with =45o, which might provide a direct probe of the critical point, do not contribute significantly to the fluctuations.
References
- [1] G. Agakichiev et al. (CERES), Phys. Rev. Lett. 75 (1995) 1272 and nucl-ex/0506002.
- [2] G. Agakichiev et al. (CERES), Eur. Phys. J. C 4, 231 (1998).
- [3] G.E. Brown and M. Rho, Phys. Rev. Lett. 66 (1991) 2720, Phys. Rep. 269 (1996) 333.
- [4] R. Rapp and J. Wambach, Adv. Nucl. Phys. 25 (2000) 1.
- [5] J. Milošević, this volume.
- [6] M. Płoskoń, poster in this conference, to be published in Acta Phys. Hung.
-
[7]
http:\\www.gsi.de\~misko\overlap\ - [8] A. Andronic, private communication.
- [9] K. Gallmeister et al., Nucl. Phys. A688 (2001) 939; B. Kämpfer, priv. communication.
- [10] D. Röhrich, J. Phys. G 27 (2001) 355.
- [11] S.C. Johnson, B.V. Jacak, and A. Drees, Eur. Phys. J C18 (2001) 645.
- [12] R. Lednicky et al., Phys. Lett. B 373 (1996) 30.
- [13] D. Adamova et al. (CERES), Nucl. Phys. A727 (2003) 97.
- [14] S. Voloshin, V. Koch, and H. Ritter, Phys. Rev. C 60 (1999) 024901.
- [15] S. Voloshin, nucl-th/0206052.
- [16] G. Agakichiev et al. (CERES), Phys. Rev. Lett. 92 (2004) 032301.