AS-TEXONO/05-08
Measurement of the Intrinsic Radiopurity
of 137Cs/235U/238U/232Th in
CsI(Tl) Crystal Scintillators
Y.F. Zhua,b,
S.T. Linb,c,
V. Singhb,d,
W.C. Changb,
M. Denizb,e,
W.P. Laib,
H.B. Lib,
J. Lia,b,f,
Y.L. Lia,
H.Y. Liaob,c,
F.S. Leeb,
H.T. Wongb,***Corresponding author
Mailing Address:
Institute of Physics, Academia Sinica, Taipei 11529, Taiwan;
Email: htwong@phys.sinica.edu.tw;
Tel:+886-2-2789-6789;
FAX:+886-2-2788-9828.,
S.C. Wub,
Q. Yuea
Z.Y. Zhoug
The TEXONO Collaboration
aDepartment of Engineering Physics, Tsing Hua University, Beijing.
bInstitute of Physics, Academia Sinica, Taipei.
cDepartment of Physics, National Taiwan University, Taipei.
dDepartment of Physics, Banaras Hindu University, Varanasi.
eDepartment of Physics, Middle East Technical University, Ankara.
fInstitute of High Energy Physics, Chinese Academy of Science, Beijing.
gDepartment of Nuclear Physics, Institute of Atomic Energy, Beijing.
Abstract
The inorganic crystal scintillator CsI(Tl) has been used for low energy neutrino and Dark Matter experiments, where the intrinsic radiopurity is an issue of major importance. Low-background data were taken with a CsI(Tl) crystal array at the Kuo-Sheng Reactor Neutrino Laboratory. The pulse shape discrimination capabilities of the crystal, as well as the temporal and spatial correlations of the events, provide powerful means of measuring the intrinsic radiopurity of as well as the , and series. The event selection algorithms are described, with which the decay half-lives of 218Po, 214Po, 220Rn, 216Po and 212Po were derived. The measurements of the contamination levels, their concentration gradients with the crystal growth axis, and the uniformity among different crystal samples, are reported. The radiopurity in the and series are comparable to those of the best reported in other crystal scintillators. Significant improvements in measurement sensitivities were achieved, similar to those from dedicated massive liquid scintillator detector. This analysis also provides in situ measurements of the detector performance parameters, such as spatial resolution, quenching factors, and data acquisition dead time.
PACS Codes: 29.40.Mc, 29.25.R, 07.05.Kf.
Keywords: Scintillation detector, Radioactive sources, Data analysis.
1 Introduction
The merits and physics potentials for crystal scintillators in low-energy low-background experiments were recently discussed [1]. This detector technology has been adopted in double beta decay, dark matter and reactor neutrino experiments, and considered for low energy solar neutrino detection. An important common issue is the contamination of radioactive isotopes in the crystals. This article reports measurements of the intrinsic radiopurity in CsI(Tl) crystals.
The measurements were performed at the Kuo-Sheng (KS) Nuclear Power Plant where a laboratory located at a distance of 28 m from the reactor core has been built to study low energy neutrino physics [2]. A multi-purpose “inner target” detector space of 100 cm80 cm75 cm is enclosed by 4 passive shielding materials which have a total weight of 50 tons. The shielding provides attenuation to the ambient neutron and gamma background, and consists of, from inside out, 5 cm of OFHC copper, 25 cm of boron-loaded polyethylene, 5 cm of steel, 15 cm of lead, and cosmic-ray veto scintillator panels.
Different detectors can be placed in the inner space for different scientific goals. The detectors are read out by a versatile electronics and data acquisition (DAQ) system[3] based on 16-channel, 20 MHz, 8-bit Flash Analog-to-Digital-Convertor (FADC) modules. The readout allows full recording of all the relevant pulse shape and timing information for as long as 500 s after the initial trigger with a resolution of 1 s. The data are then read out and transferred to the host computer, and the average DAQ dead time is 5.13 ms per event. The timing information for every event was recorded with a resolution of 1 ms. The time differences between subsequent events and between different triggers within an event can be evaluated. Software procedures have been devised to extend the effective dynamic range from the nominal 8-bit measurement range provided by the FADC[4].
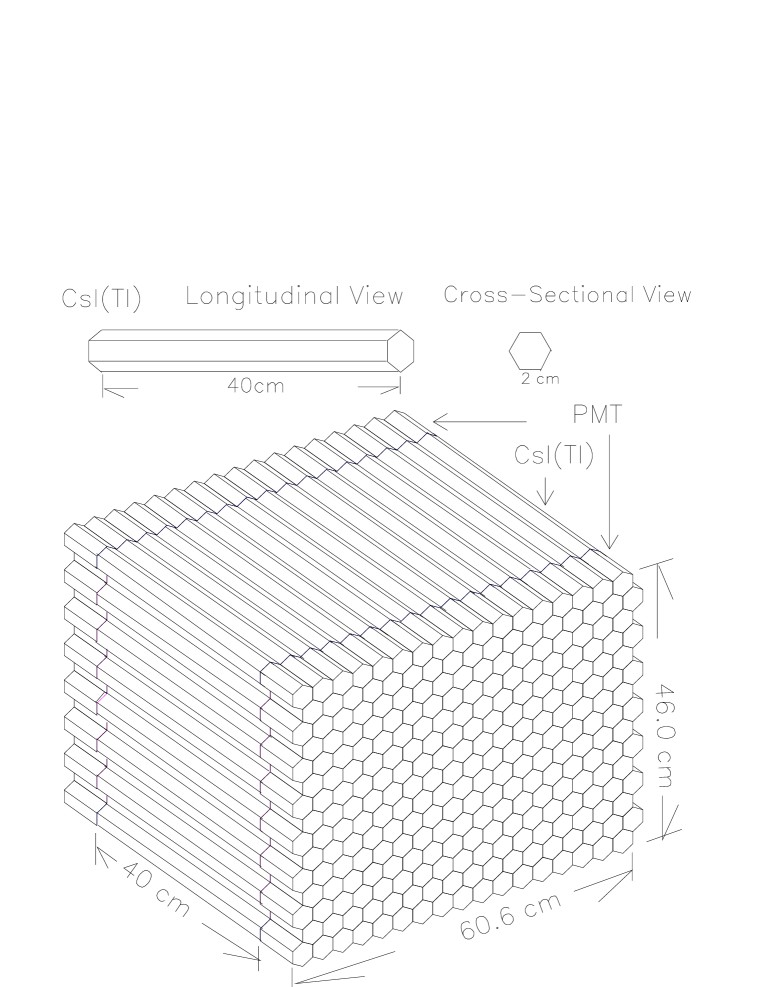
One of the detectors placed inside the inner target volume is an array of CsI(Tl) crystal scintillators[5], the schematic of which is displayed in Figure 1. Each crystal module is 2 kg in mass and consists of a hexagonal-shaped cross-section with 2 cm side and a length of 40 cm. The light output are read out at both ends () by custom-designed 29 mm diameter photo-multiplier tubes(PMTs) with low-activity glass. The sum and difference of the PMT signals give information on the energy and the longitudinal Z-position of the events, respectively. Performance of the prototype modules was published in Ref. [6].
A total of 186 kg (or 93 modules) was commissioned for the 2003 data taking. The physics goal is to measure the Standard Model neutrino-electron scattering cross sections, and thereby to provide a measurement of at the untested MeV range. The strategy [7] is to focus on data at high (2 MeV) recoil energy where the uncertainties due to the reactor neutrino spectra are small. The large target mass compensates the drop in the cross-sections at high energy.
This article focuses on the measurements of the intrinsic level as well as those for the , and series in the CsI(Tl) crystals using the correlated events from - and - decay sequences. Our work complements and extends the scope of those previous efforts on this [8, 9] and other crystal scintillators: NaI(Tl) [11, 12, 13], CdWO4 [14], GSO(Ce) [15], CeF3 [16], BaF2 [17] and CaF2(Eu) [18]. The achieved sensitivities match the best among these results as well as those from massive liquid scintillator facility [19]. Several detector parameters can be derived from these measurements, providing a means of in situ monitoring of the detector calibration and performance.
In addition, another CsI(Tl) detector array of mass 200 kg is being prepared in the Yang-Yang Underground Laboratory in South Korea to look for Cold Dark Matter [9]. Knowledge of the intrinsic radioactivity in CsI(Tl) is essential to both experiments. The methods devised are applicable to a wide spectrum of low-background experiments where / discrimination is possible and the detailed timing information are available.
2 Intrinsic 137Cs Level
The isotope is produced artificially as fission waste from power reactors and atomic weapon tests. Cesium compounds are highly soluble and hence can easily be introduced into cesium products during the processing from cesium ore (like pollucite). Once introduced, there is no chemical means to separate from the stable 133Cs. This is the dominant one background contribution to Dark Matter experiments using CsI(Tl) crystals as target [9].
The isotope decays via [10]:
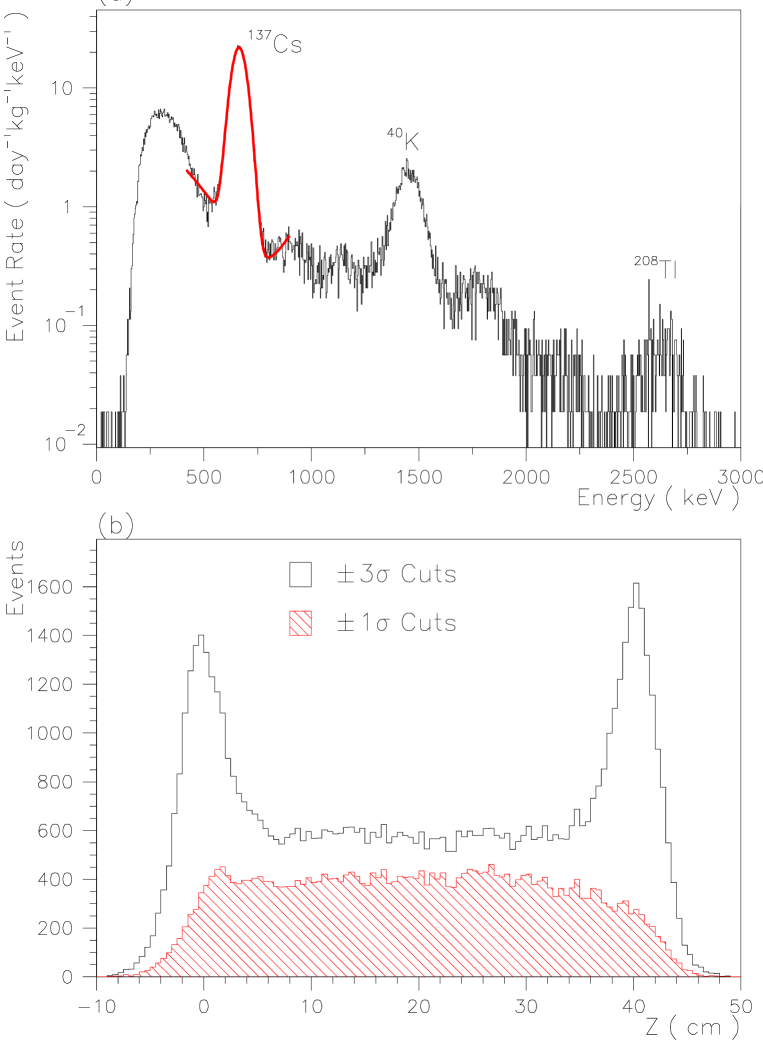
with the emission of a -ray of energy 662 keV. A total of 31.3 kg-day of CsI(Tl) data was analyzed. The spectrum is displayed in Figure 2a, showing a distinct line at this energy with a root-mean-square (RMS) resolution of 5.1%. Other naturally-occuring -lines, like those from 40K and 208Tl, can also be observed.
The Z-position distribution of the 137Cs events are shown in Figure 2b. Events within of the -peak give excess on both ends of the 40-cm long crystals due to external background. The uniform distribution after a cut indicates the source of is internal to the crystals.
Simulation studies give an efficiency of 42% for full capture of the 662 keV -ray in a single crystal. Accordingly, an average activity of 612 mBq kg-1, or equivalently a contamination level of g/g, can be derived for the CsI(Tl) crystals. The RMS spread of the activity among the 31 crystals studied is 30%.
Alternatively, the radiopurity of the CsI powder with which the CsI(Tl) crystals were produced have been measured with a high-purity germanium detector. The measured abundance is g/g, consistent with the in situ results.
3 Pulse Shape Discrimination in CsI(Tl) Crystals
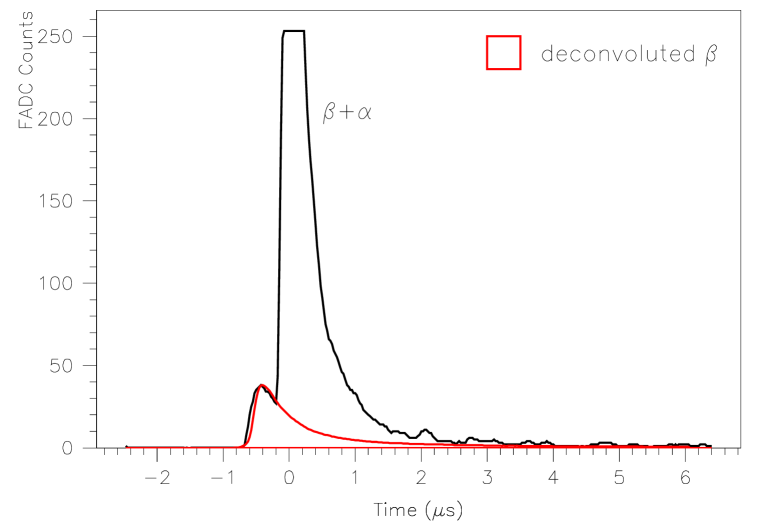
It has been well-studied [6, 20] that the light emission profiles of scintillating CsI(Tl) crystals exhibit different shape for -rays and electrons (that is, minimum ionizing particles), as compared to that for -particles and nuclear recoils at the 100 keV regime . Heavily ionizing events due to -particles and nuclear recoils have faster decays than those from e/’s opposite to the response in liquid scintillator [21]. The average pulse shapes for both categories are depicted in Figures 3, where t=0 is defined by the trigger instant. This characteristic property makes particle identification possible with this scintillator [22].
Matured pulse shape discrimination (PSD) techniques have been devised at high energies where the photo-electrons are abundant. The “double charge method” [23] involves the comparison of the “total charge” () and the “partial charge” (), which are the total and partial integration of the pulse, respectively. In this analysis, and were evaluated by integrating the entire pulse from 0.75 to 12.8 s, and the tail from 5 to 12.8 s, respectively, with respect to the timing shown in Figure 3.
With the digitized pulse information measured by the FADCs, the mean time method is often used. The mean time is defined as
| (1) |
where is the FADC-amplitude at time-bin . The PSD capabilities to make / identification for MeV events are displayed in Figure 4a&b for both methods, indicating excellent separation. These features can be extended to the low energy regime where photo-electron statistics are limited, via advanced software techniques [24]. This is relevant to the Dark Matter experiments.
4 Intrinsic Radiopurity of U/Th Series
The , and decay series are naturally occurring, and exist in all materials at some levels. The processing of the raw materials to CsI(Tl) crystals can preferentially introduce or remove certain isotopes within these series such that secular equilibrium can be destroyed. A sensitive measurement of the spatially and temporally-correlated events within the decay series in CsI(Tl) crystals was performed. The measured activities were translated to contamination levels of their long-lived parent isotopes in the crystal. If secular equilibrium is assumed, the levels of , and can be derived.
The identification of the events provides event-by-event background rejection to the candidate events for neutrino or Dark Matter-induced interactions. Beyond that, they are extremely useful to perform in situ studies of detector performance parameters.
4.1 Decay Sequences
The five decay sequences (DS) of interest under studied are [10]:
-
DS1) Within the series, the - cascade from 222Rn
the event rate of which gives the concentration of 226Ra whose half-life () is 1600 y.
-
DS2) Within the series, the - cascade from 214Bi
the event rate of which gives the concentration of 226Ra with =1600 y.
-
DS3a,3b) The decay sequence 224Ra220Rn216Po within the series can be identified by a triple -- signature
the event rate of which gives the concentration of 228Th with =1.9 y.
-
DS4) Within the series, there is 64% branching ratio for 212Bi to decay via a - cascade
the event rate of which also gives the concentration of 228Th.
-
DS5a,5b) Though not expected to be dominant, the decay chain of 223Ra219Rn215Po in the 235U series has a triple -- sequence
the event rate of which gives the concentration of 227Th with =21.8 y.
4.2 Event Selection
A total of 40 crystals with a data size of 1725 kg-day taken at the KS Lab was studied. Various selection criteria for the decay sequences DS1-5 were devised and their efficiencies were measured, as summarized in Table 1. With the exception of the fast-cascade in DS4, the events were identified as or e/ (ID); the delayed events should be within four half-lives from the precedent ones (t); the measured energy of the -events should match that of expectations from Quenching Factor measurements (Eα) while the correlated events should have the same Z (Z=0). Events from DS4 were identified by the convoluted - pulse shapes.
| DS | Signatures | Decays | Selection | Background | Half-Life () | |
|---|---|---|---|---|---|---|
| Efficiency | -to-Signal | Nominal | Measured | |||
| 1 | - | |||||
| 0.93 | 0.51 | 3.10 min | 3.20.2 min | |||
| 2 | - | |||||
| 0.77 | 164 s | 1638 s | ||||
| 3a | - | |||||
| 0.86 | 55 s | 54.42.4 s | ||||
| 3b | 0.97 | 0.15 s | 0.1410.006 s | |||
| 4 | - | |||||
| 0.37 | 299 ns | 28337 ns | ||||
| 5a | - | |||||
| 0.78 | 3.96 s | No Signal | ||||
| 5b | 1.78 ms | DAQ Inactive | ||||
The energy spectrum of the -events is depicted in Figure 5. The measured energy is “quenched” due to recombinations between the ions and electrons such that it is less than that of /electrons at the same kinetic energy. The quenching factor measurements are discussed in details in Section 4.4. The small peak at 6 MeV measured energy is due to the energy sum of those - pairs in DS4 whose t are too small to be de-convoluted. Apart from this structure, the -spectrum shows a broad peak at about 2.5 MeV. The individual mono-energetic -emissions within the and series cannot be resolved. This poses difficulties and limits the accuracies to radiopurity measurements based only on the -spectra without the timing information.
The single rate is 0.0007 kg-1s-1 or one event per crystal per 11.9 min. This defines a time-range under which the identification of correlated -pairs would be possible, and justifies our selection of the five decay sequences for investigations.
The t distributions for the correlated-events from DS1,2,3a,3b are shown in Figure 6a-d, respectively. Events with delay up to four nominal decay half-lives were sampled, except for the DS2 - pairs in Figure 6b, where the maximum delay between triggers is 500 s constrained by the DAQ settings. In Figure 6a where DS1 -pairs with delay time as long as 12 minutes were selected, background due to accidental pairs and those from DS3a with missing DS3b were statistically subtracted. Selections for the other sequences followed from the criteria discussed. The t distributions are compared to exponential decay profiles, and the best-fit half-lives are tabulated in Table 1. All measurements are in excellent agreement with the standard values.
The sequence DS4 has of only 300 ns, such that both pulses will appear convoluted within the same readout time window of 12.5 s. An example of such signatures is displayed in Figure 7a. The cascade was therefore selected not by timing but by pulse shape analysis. The time difference between the and leading edges is depicted in Figure 7b, where the best-fit is 28337 ns, also in good agreement with reference values. As shown in Table 1, only 37% of the - events can be resolved. The remaining ones are convoluted and contribute to the 6 MeV peak in Figure 5.
The sequence DS5a,5b is another triple -cascade. However, the second decay with =1.78 ms is well inside the DAQ dead time window (starting from 500 s after the trigger for a duration of about 5 ms), such that this cannot be measured. The first decay, with =3.96 s, is measurable. The time-difference plot is shown in Figure 8. No evidence of an exponential decay was observed, such that only an upper limit to the series can be derived.
4.3 Radiopurity Levels
The measured intrinsic radiopurity levels can be presented in several ways and they are summarized in Table 2. The measured activity in can be converted to radiopurity level in units of “gram per gram (g/g)” of the parent isotopes in CsI(Tl). Assuming secular equilibrium, the contamination levels of and can also be derived and compared to other measurements. Results were derived from the 1725 kg-day of data taken with 40 crystals, and the quoted errors denote the uncertainties of the measured mean activities.
| DS | Measured Activity | Contaminations of | Contaminations of |
|---|---|---|---|
| (mBq kg-1) | Long-Lived Parents (g/g ) | Series† (g/g) | |
| 1 | |||
| 2 | |||
| 3a,3b | |||
| 4 | |||
| 5a | |||
| † assume secular equilibrium | |||
The most accurate measurements were derived from DS2 and DS3a,3b giving, respectively, average activities of and , corresponding to contaminations of and for 226Ra and 228Th, respectively. Assuming secular equilibrium, the and concentrations in CsI(Tl) are at the and levels, respectively. The scattered-plot for the and levels among the 40 crystals are shown in Figure 9. The RMS spreads are, respectively, 80% and 88% for the 226Ra and 228Th levels or alternatively the and contaminations in the case of secular equilibrium. No strong correlations between the two series were observed.
Comparison with other radiopurity measurements in CsI(Tl) is given in Table 3. The measured levels reported in this article are consistent with and improve over independent measurements using high purity germanium detectors on samples of CsI powder. Only upper limits of g/g and g/g could be derived for the and series, respectively, from the absence of their associated -lines. The measurements are also consistent with the previous results on CsI(Tl) crystals [8, 9], where the radiopurity levels were derived by fitting the various -activities to the measured -background spectra. Reduction of the measurement uncertainties is due to the stringent selection criteria for the time-correlated pairs which greatly suppress the background.
| Scintillators | Reference | Methods | ||
|---|---|---|---|---|
| ( g/g ) | ||||
| CsI(Tl) | This Work | DS2,3a,3b,4 | 0.820.02 | 2.230.06 |
| This Work | HPGe | 7600 | 730 | |
| [8] | 6.0 | 19 | ||
| [9] | 0.390.09 | 4.50.5 | ||
| NaI(Tl) | [11] | DS2 | 0.38 | 1.0 |
| [12] | DS2,3a | 4.00.2 | 2.40.5 | |
| [13] | DS2,3a | 3.00.1 | 171 | |
| CdWO4 | [14] | DS2,3a | 0.4 | 9.40.7 |
| GSO(Ce) | [15] | DS2,3a | 11020 | 2.90.3 |
| CeF3 | [16] | DS2,3a | ||
| BaF2 | [17] | DS2,4 | ||
| CaF2(Eu) | [18] | DS2,3a | 892080 | 24.30.4 |
| Liquid | ||||
| Scintillator | [19] | DS2,3a | ||
A comparison of the measured intrinsic radiopurity levels of and with those in other crystal scintillators as well as in the kilo-ton low-background liquid scintillator CTF (Counting Test Facility) detector [19] at Gran Sasso is given in Table 3. The purity of the CsI(Tl) crystals with respect to these series is comparable with the best measured for NaI(Tl) and CdWO4 and exceeds those of the other crystals. Nevertheless, contaminations in all crystals are much higher than those in liquid scintillator.
The sequences (DS1, DS2) and (DS3a,3b, DS4) originate from the same long-lived parent isotope: 226Ra and 228Th, respectively. As shown in Table 2 The agreement between their measured activities are excellent. Alternatively, the ratios between DS4 to DS3a,3b give the branching ratio of the branch within the series. The measured branching ratio is 684%, consistent with the expected value of 64%.
The absence of signals for DS5a, as shown in Figure 8, was converted into upper limits of in the measured activity, corresponding to g/g in the contaminations of 227Th. Equilibrium within series imply an upper limit of g/g can be derived for contaminations in the CsI(Tl) crystals.
Given in Table 4 is an alternative view to assess the merits of our measurements by projected sensitivities in the hypothetical scenario where no correlated events are observed and only upper limits can be derived. This was indeed the case for DS5a. The accidental rates are due to uncorrelated event-pairs which survive the various selection cuts and fall into time windows corresponding to four half-lives. One can derive from the rates the limiting sensitivities in , as well as the upper limits of the radiopurity levels of the decay parents and the two series. The limits represent the levels above which the / contaminations of a test sample can be detected by the present methods at the measured accidental background rates. The restrictive selection criteria adopted in this work (ID+t+Z+Eα) greatly suppress the accidental background and enhance the the detection sensitivities for the correlated decay sequences in DS2,3a,3b,4. The achieved levels of g/g are comparable to those of massive liquid scintillator [19] listed in Table 3.
| DS | Accidental Rate | Limiting Sensitivity | Contaminations of | Contaminations of |
| (kg-1day-1) | (mBq kg-1) | Long-Lived | Series† (g/g) | |
| Parents (g/g ) | ||||
| 1 | 0.53 | |||
| 2 | 0.0029 | |||
| Combined for Series: | ||||
| 3a,3b | ||||
| 4 | ||||
| Combined for Series: | ||||
| 5a | 0.26 | 0.003 | ||
| † assume secular equilibrium | ||||
These cascade events were used to provide measurements of several important parameters on crystal properties and detector performance. In the following sub-sections, we adopted for analysis a subset of the crystals (6 and 13 crystals out of 40 for the and series,respectively) which have sufficiently large event samples to provide statistically meaningful measurements.
4.4 Quenching Factor Measurements
The ionization charge densities are much higher for -particles than those for electrons or photons, giving rise to enhanced recombination rates and therefore the light yield is reduced. The quenching factor(QF) of a scintillator is the ratio of measurable light yield compared to that due to electrons/photons of the same energy:
| (2) |
where is the measurable “electron-equivalent” energy of the -particles and is Q-value of decays which is also the kinetic energy of the ’s. The quenching is energy-dependent, and is usually described by two parameters (a,b) in the form [21]:
| (3) |
The identified -events from the correlated pairs provide a background-free sample for the measurement of QF. The value of is exactly known and the entire volume of the crystal is sampled, as compared to measurements with an external -source which are sensitive only to a localized sites on the crystal surface.
Tabulated in Table 5 are the measured QF for the five ’s from the various cascades studied in this work. The ’s from DS1, DS2, DS3a,3b are isolated events and their light yield can be readily measured by integrating the pulses. The energy measurements for ’s in DS4, however, involve de-convolutions of the - pulses shown in Figure 7a, and therefore are subjected to bigger uncertainties. The energy resolutions of the -events () are also shown, where is the RMS of the respective peaks shown in Figure 5.
| DS | Decays | (MeV) | (MeV) | QF | |
|---|---|---|---|---|---|
| 1 | 222Rn 218Po | 5.590 | 2.760.02 | 0.4940.004 | 0.076 |
| 3a | 224Ra 220Rn | 5.789 | 2.920.02 | 0.5040.003 | 0.074 |
| 1 | 218Po 204Pb | 6.115 | 3.090.02 | 0.5050.003 | 0.097 |
| 3a | 220Rn 216Po | 6.405 | 3.330.02 | 0.5200.003 | 0.069 |
| 3b | 216Po 212Pb | 6.907 | 3.670.02 | 0.5320.003 | 0.068 |
| 2 | 214Po 210Pb | 7.834 | 4.330.03 | 0.5530.003 | 0.11 |
| 4 | 212Po 208Pb | 8.954 | 5.080.05 | 0.5680.006 | 0.14 |
It can be seen that the quenching behaviour are different for inorganic crystal scintillators and organic liquid scintillators. The QF is large in crystal scintillators ( for CsI(Tl) for -particles in the MeV range) compared to that for liquid scintillator, typically at the QF0.1 range [25]. In addition, the quenched pulses for -particles have faster decay times compared to those from electrons/photons in crystal scintillators, as indicated in Figure 4, while the reverse is true for liquid scintillators. The quenching for nuclear recoils in CsI(Tl) at the keV energy range is relevant to Dark Matter searches, and have been measured (QF0.2) by various groups [9, 26].
The variations of QF with the kinetic energy of the ’s are displayed in Figure 10a. The measured quenching parameters a=0.250.01 and b=0.330.02 MeV-1 provide good fits to the data. The RMS variation for the QF among the 13 crystals studied is at the 6.3% level. The variations of with are displayed in Figure 10b. The energy resolution is statistically-limited in four of the data points where . The worse resolution of the from 218Po in DS1 is due to its long half-life such that the sample is contaminated by accidental events. Energy measurement of the 214Po- in DS2 is affected by the sampling procedures of this particular data acquisition system the pedestals for the delayed events within 500 s of the primary trigger were not recorded and uncertainties were therefore introduced. Measurement of the 212Po- in DS4 involves the de-convolution of the - pulse shapes, which gives additional contributions to the energy resolution.
4.5 Spatial Resolution
The longitudinal “Z-position” of an event can be derived from the difference of the PMT signals between the left () and right () sides [6, 27]:
| (4) |
where R is a dimensionless parameter linearly proportional to Z. Data taken with external collimated -sources prior to installation provided measurements of the Z-resolutions (=2 cm) above 400 keV. This approach is limited by the intrinsic spread of the photon interaction sites within the crystal due to multiple Compton scatterings. A better in situ method is through the study of the measured position difference (Z) of the correlated - and - pairs which are emitted at the same site. The Z distributions of - from DS2 and the two - pairs from DS3a,3b for the combined data are depicted in Figure 11a&b. Both are centered at Z=0, indicating that the selected pair of events were indeed originated at the same site. The resolution , as given by the RMS of the distributions, are 2.2 cm and 1.3 cm for the - and - events, respectively, while the RMS spread of among the crystal samples are 19% and 24%.
The - samples provide a more accurate description in the studies of the intrinsic spatial resolution, since both of the -pairs are originated at the same site. The -events in DS2, on the other hand, are accompanied by other -emissions such that their exact vertices are not well-defined. This explains the worse Z distribution for the - samples.
4.6 Contamination Gradient with Crystal Growth Axis
Crystal growth is itself an purification process. As a result, the impurity concentrations in the solution increase during the growth process, such that residual contaminations inside the crystals are expected to increase with the crystal growth axis. This is verified in Figure 12a&b where the Z-position distributions of the event rates of DS2 and DS3a,3b are depicted, corresponding respectively to the gradients of the 226Ra and 228Th levels. The measured gradients of the combined data are for 226Ra and for 228Th, while the RMS spread among the samples are 33% and 104%, respectively. This behaviour is in contrast to the uniform Z-position distribution of 137Cs shown in Figure 2b, since the trace contaminations in 137Cs cannot be separated from the natural 133Cs by any chemical means.
4.7 Data Acquisition Dead Time
The event samples can also be used to measure or monitor the data acquisition dead time (DT). The fraction DT/(1-DT) is the ratio of recorded double- events in DS3a where the third one is missing to the triple- events where the entire sequence DS3a and DS3b are reconstructed. The measured value is DT=91%, in good agreement to DT=9.5% derived by an alternative method using random trigger events [3].
5 Summary and Conclusion
We report in this article measurements of the intrinsic radiopurity in CsI(Tl). In addition to energy measurements and particle identifications, the selection of spatially and temporally correlated event-pairs within the and series can greatly suppress accidental background and enhance the measurement capabilities. Sensitivity levels comparable to dedicated massive low-background liquid scintillator detector were achieved. In particular, the -pairs correlated by time as long as 10 minutes were successfully identified. The CsI(Tl) crystals measured in this work are among the cleanest compared to the other crystal scintillators in the and contaminations. The methods and results will be valuable references to other low-background experiments where the suppression and measurements of the and background are necessary.
We are grateful to the referee for pointing out a numerical error. This work was supported by contracts 92-2112-M-001-057 and 93-2112-M-001-030 from the National Science Council, Taiwan, and 19975050 from the National Science Foundation, China.
References
- [1] H.T. Wong et al., Astropart. Phys. 14, 141 (2000).
- [2] H.T. Wong, Mod. Phys. Lett. A 19, 1207 (2004).
- [3] W.P. Lai et al., Nucl. Instrum. Methods A 465, 550 (2001).
- [4] Q. Yue et al., Nucl. Instrum. Methods A 511, 408 (2003).
- [5] H.B. Li et al., Nucl. Instrum. Methods A 459, 93 (2001).
- [6] Y. Liu et al., Nucl. Instrum. Methods A 482, 125 (2002).
- [7] H.B. Li and H.T. Wong, J. Phys. G 28, 1453 (2002).
-
[8]
U. Kilgus, R. Kotthaus, and E. Lange, Nucl. Instrum. Methods
A 297, 425, (1990);
R. Kotthaus, Nucl. Instrum. Methods A 329, 433 (1993). -
[9]
H. Park et al., Nucl. Instrum. Methods A 491, 460 (2002);
T.Y. Kim et al., Nucl. Instrum. Methods A 500, 337 (2003). - [10] R.B. Firestone and L.P. Ekström, Table of Radioactive Isotopes, http://ie.lbl.gov/toi/ (2004).
- [11] R. Bernabei et al., Nuovo Cim. A 112, 545 (1999).
- [12] J.C. Barton, Appl. Radiat. Isot. 47, 997 (1996).
-
[13]
S. Umehara et al., Nucl. Instrum. Methods A 490, 271 (2003);
K. Fushimi et al., Nucl. Instrum. Methods A 491, 163 (2003). -
[14]
F.A. Danevich et al., Phys. Rev. C 62, 045501 (2000);
F.A. Danevich et al., Phys. Rev. C 68, 035501 (2003). - [15] S.C. Wang, H.T. Wong and M. Fujiwara, Nucl. Instrum. Methods A 479, 498 (2002).
- [16] P. Belli et al., Nucl. Instrum. Methods A 498, 352 (2003).
- [17] R. Cerulli et al., Nucl. Instrum. Methods A 525, 535 (2004).
- [18] I. Ogawa et al., Nucl. Phys. A 730, 215 (2004).
- [19] G. Alimonti et al., Nucl. Instrum. Methods A 406, 411 (1998).
-
[20]
H. Grassmann, E. Lorentz and H.G. Moser,
Nucl. Instrum. Methods 228, 323 (1985);
P. Schotanus, R. Kamermans, and P. Dorenbos, IEEE Trans. Nucl. Sci. 37, 177 (1990). - [21] See, for example, J.B. Birks, Theory and Practice of Scintillation Counting, Pergamon (1964).
-
[22]
J. Alarja et al., Nucl. Instrum. Methods A 242,
352 (1982);
F. Benrachi et al., Nucl. Instrum. Methods A 281, 137 (1989). -
[23]
C.L. Morris et. al., Nucl. Instrum. Methods 137,
397 (1976);
M.S. Zucker and N. Tsoupas, Nucl. Instrum. Methods A 299, 281 (1990). - [24] S.C. Wu et al., Nucl. Instrum. Methods A 523, 116 (2004).
- [25] S.C. Wang et al., Nucl. Instrum. Methods A 432, 111 (1999).
-
[26]
Pecourt et al., Astropart. Phys. 11, 457 (1999);
V.A. Kudryavtsev et al., Nucl. Instrum. Methods A 456, 272 (2001);
M.Z. Wang et al., Phys. Lett. B 536, 203 (2002). - [27] D.Z. Liu et al., High Energy Phys. & Nucl. Phys. 28, 186 (2004).


(a)
(b)


(a)

(b)


