Central-to-peripheral nuclear modification factors in Pb–Pb collisions at 17.3 GeV
Abstract
We present central-to-peripheral nuclear modification factors, , for the distributions of , , , and negatively charged particles, measured at central rapidity in Pb–Pb collisions at top SPS energy. The data cover the 55% most central fraction of the inelastic cross section. The and are similar in shape to those measured at at RHIC, though they are larger in absolute value. We have compared our data to a theoretical calculation. The prediction overestimates the data at –, unless sizeable parton energy loss is included in the calculation.
keywords:
nucleus–nucleus collisions , strange particlesPACS:
12.38.Mh , 25.75.Nq , 25.75.DwNA57 Collaboration
, , , , , , , , , , , , , , , , , , , , , , , , , , , , , , , , , , , , , , , , , , , , , , , , , , , , , , , , , , , , , , , , , , , , , , , , , , , , , , and
1 Introduction
The quenching of high transverse momentum () particles in central heavy-ion collisions is one of the main discoveries at BNL-RHIC. The effect is quantified using the nuclear modification factor:
| (1) |
where is the average number of nucleon–nucleon (NN) collisions for nucleus–nucleus (AA) collisions in a given centrality class C. The nuclear modification factor would be equal to unity if the AA collision were a mere superposition of independent nucleon–nucleon collisions. In central Au–Au collisions at a c.m.s. energy per nucleon–nucleon pair of , the PHENIX and STAR experiments have measured a suppression by a factor 4–5 with respect to unity in for , independent of the particle species [1]. A similar suppression at high is observed also in the central-to-peripheral nuclear modification factor
| (2) |
where a class P of peripheral nucleus–nucleus collisions replaces the pp reference (see e.g. [2]). The measured suppression is interpreted as being due to energy loss of the hard partons traversing the high-density QCD medium expected to be formed in high-energy heavy-ion collisions [3]. Parton energy loss would predominantly occur via the mechanism of medium-induced gluon radiation [4, 5].
Preliminary results [6] from the RHIC run at show a suppression by about a factor 3, not much smaller than that observed at . This motivates the search for parton energy loss effects at even lower c.m.s. energy, i.e. in Pb–Pb collisions with at CERN-SPS. Possible indications of such effects were found by the WA98 Collaboration [7], who observed a suppression of the . In addition, a recent analysis [8], using the WA98 Pb–Pb data [7] and a parameterization of a wide compilation of pp data at similar energy available in the literature, favours a scenario of significant energy loss.
We investigate the presence of energy loss effects in Pb–Pb collisions at by measuring for , and particles, and for unidentified negatively charged particles, . The relative behaviour of the patterns for and particles is also expected to be sensitive to parton coalescence effects [9] in the hadronization dynamics. It has been suggested that these effects occur at RHIC energy (see e.g. [10]).
2 Apparatus, data sets and analysis
The NA57 apparatus, described in detail in [11], was designed to study the production of strange and multi-strange particles in fixed-target heavy-ion collisions by reconstructing their weak decays into final states containing charged particles only. Tracks are reconstructed in the 30 cm-long silicon telescope: an array of pixel detector planes with a cross section of placed inside a 1.4 T magnetic field normal to the beam direction. The telescope is inclined in the non-bending plane by a 40 mrad angle relative to the beam line and it points to the target located 60 cm from the first detector plane. The acceptance covers about half a unit in rapidity at central rapidity and transverse momentum larger than about . For the Pb–Pb runs, the centrality trigger, based on charged multiplicity, was set so as to select approximately the most central 60% of the inelastic collisions.
The results presented in this letter are based on the analysis of data collected during the 1998 (about events) and 2000 (about events) Pb–Pb runs with beam momentum of 158 .
| Class (% ) | ||
|---|---|---|
| 0–5.0% | ||
| 10.0–20.0% | ||
| 20.0–30.0% | ||
| 30.0–40.0% | ||
| 40.0–55.0% |
The collision centrality is determined using the charged particle multiplicity in the pseudorapidity range , sampled by the microstrip silicon detectors (MSD) as described in [12, 13]. is related to the centrality assuming (a modified Wounded Nucleon model) [12], where is the number of participants, i.e. nucleons participating in the primary nucleon–nucleon collisions, estimated from the Glauber model [14]. The distribution is well described by a Wounded Nucleon model fit with [13]. The inelastic cross section extracted from the fit [12], using an inelastic non-diffractive NN cross section [15, 16], is b. Five centrality classes are defined, with limits corresponding to given fractions of . For each class the average values of and are calculated from the Glauber model, with Pb nucleus Woods-Saxon density-profile parameters as given in [17]. In Table 1 we present the definitions of the five centrality classes along with the corresponding values of and with their systematic errors, estimated by varying the parameter in the range [1.0,1.1], the Woods-Saxon parameters within their tabulated uncertainties and the inelastic non-diffractive NN cross section at within its systematic error estimated to be 1.5% [15, 16]111The values given in Table 1 for the most central and the most peripheral classes differ slightly from those published in [13] due to a refined treatment of the trigger effect in the fit of the multiplicity distribution done for the present analysis.. Note, however, that the contribution due to the uncertainty on is negligible for , while for it ranges from 1.5% in the most central class to 1.1% in the most peripheral, but it cancels out in the ratio used for .
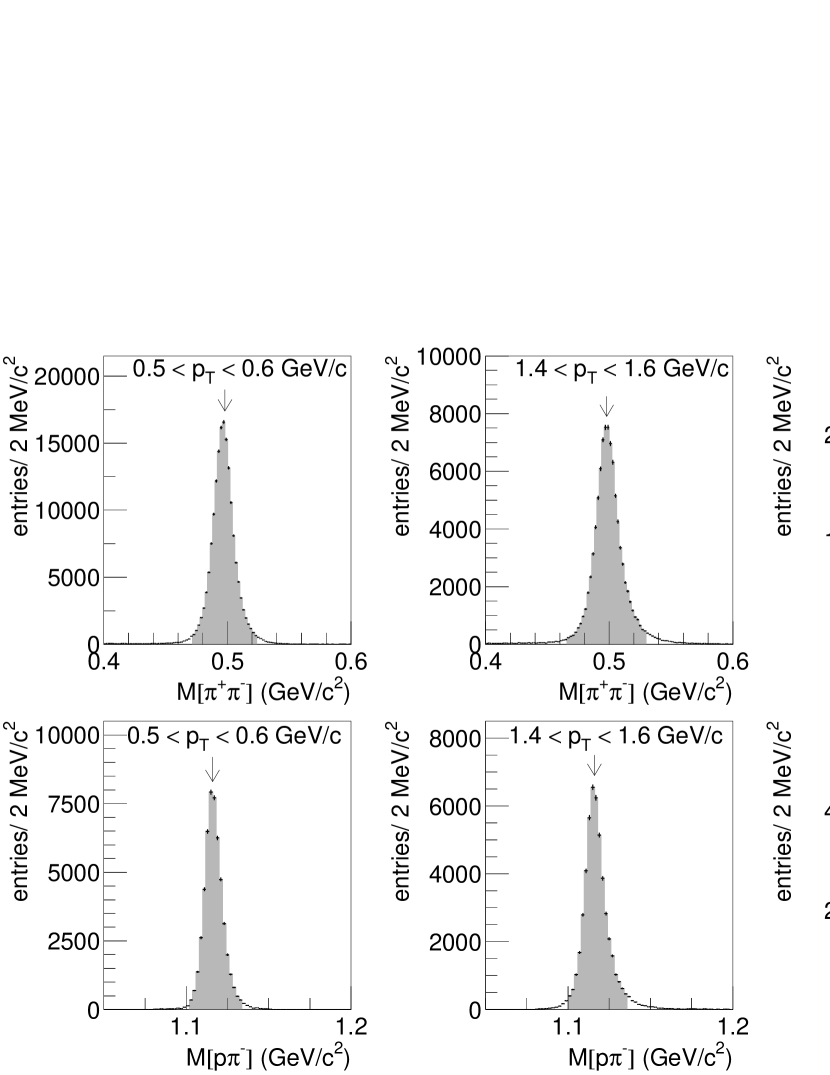
Strange particles are reconstructed using their decay channels into charged particles: , , and . The selection procedure is described in detail in [18, 19]. The main criteria are the following: (a) the two decay tracks are compatible with the hypothesis of having a common origin point; (b) the reconstructed secondary vertex is well separated in space from the target; (c) the reconstructed candidate points back to the primary vertex position. For , the two decay tracks are required to miss the interaction vertex by applying a -dependent cut on the product of their impact parameters (distances of closest approach to the interaction vertex in the bending plane). Ambiguities among , and are eliminated by means of cuts [18] on the Podolanski-Armenteros plot [20]. The final invariant mass distributions for and candidates in different ranges are shown in Fig. 1. The shaded areas correspond to the windows used for this analysis; the size of these windows is smaller at low , where the invariant mass resolution is better. The statistics amounts to , , and . We have estimated and subtracted the combinatorial background using the event-mixing technique on a subsample of events representative of the full statistics [19]. The background fraction in the selected mass window is negligible for our most peripheral class (40–55%) and it increases going to more central classes, where it also increases from low to high transverse momentum. In the worst case, in class 0–5%, the subtracted background fraction amounts to: for with ; for with ; for with .
Negatively charged particles, , are selected from a sample of good-quality tracks (clusters in more than 80% of the telescope planes, less than 30% of the clusters shared with other tracks) using an impact parameter cut to ensure they come from the interaction vertex. The residual contamination of secondary tracks (decay products of weakly-decaying particles) has been estimated to be of about 2%, independent of , for the most central class of events, and lower for the other classes. The statistics amounts to particles.
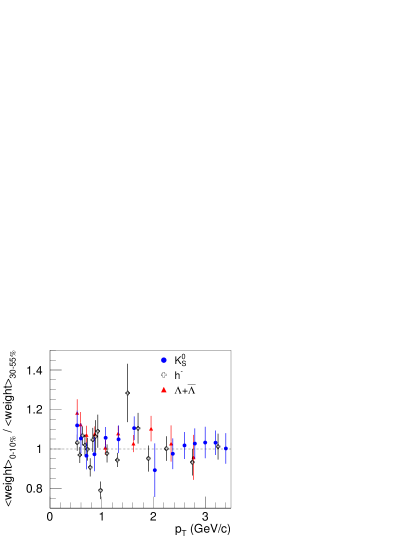
We calculate , Eq. (2), using distributions which are unweighted, i.e. not corrected for geometrical acceptance and reconstruction/selection efficiency. For other analyses, in particular for the measurement of the -integrated strange particle production yields [21], we adopted a procedure, specifically developed for rarer signals like and , in which every selected particle was assigned a correction weight, calculated on the basis of a Monte Carlo simulation [19]. This correction is very time consuming and, for the more abundant signals (, and ), it was calculated only for a representative subsample of the available statistics. For the present study, we have verified that these weights do not depend on the event centrality over the full transverse momentum range covered (see Fig. 2). Using unweighted spectra results in a negligible systematic error on as compared to the other contributions discussed in the following.
3 Results
We use class 40–55% as the reference peripheral class in the denominator of , see Eq. (2), and vary the ‘central’ class in the numerator from 0–5% to 30–40%. We estimated possible residual systematic effects by comparing the results corresponding to the year 1998 sample and to the year 2000 sample, which were also processed with different versions of the reconstruction software. We find compatible results, with point-to-point differences smaller than 10% for , and . We assign ‘reconstruction’ systematic errors of 5% for all four species. For strange particles, a small contribution to the systematic errors has been recognized as due to the procedure used to remove fake tracks, which yield duplicated candidates, particularly in central collisions that have higher track density222For the analysis, fake tracks were avoided by imposing tighter track-quality conditions.. For , and , the resulting error, estimated to be at most 3% at high for the ratio 0–5%/40–55% and smaller for the other ratios, has been added in quadrature to the ‘reconstruction’ systematic error and to the systematic error due to background subtraction, which is also at most 3%.
Figure 3 shows our results for four different ‘central’ classes (C). The error bars are obtained as a quadratic sum of the statistical errors and the -dependent systematic errors (). The shaded bands centered at represent the -independent systematic error due to the uncertainty in the ratio , while the shaded bands at low represent the values corresponding to -scaling, with the band indicating the systematic error due to the uncertainty in the ratio . We first focus on the 0–5%/40–55% ratio. At low (), the , and patterns are compatible with -scaling, while the points are clearly below. As increases, for the approaches one; for the behaves differently from the above , reaching a value of about 1.5, as does the . For values below , the for negative particles is dominated by negative pions, and stays below the corresponding values for . At higher the lies between those for and ; in this region there may be significant and contributions in the sample of negative particles (note that for in central Au–Au collisions at [22]). For less central collisions, the exhibit a small enhancement in the range , while within errors the for the other particles do not vary with respect to 0–5%/40–55% .
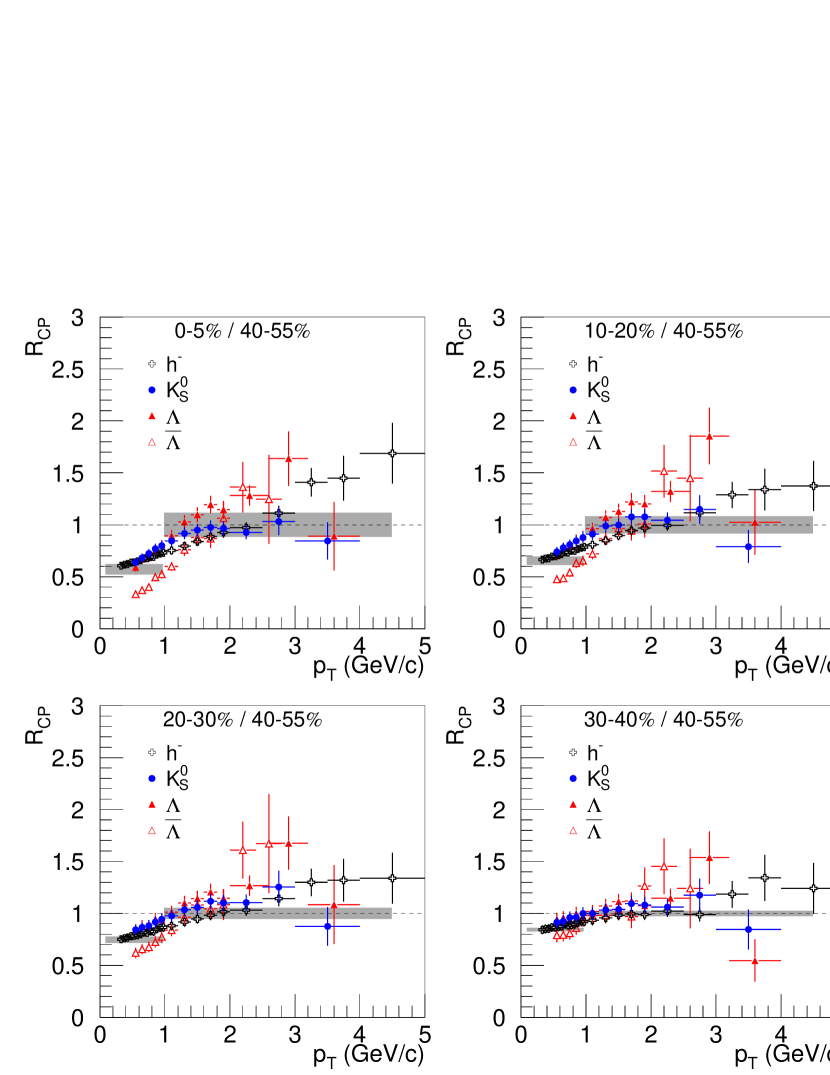
The difference between the and the at low , already observed in the centrality dependence of the -integrated yields in Pb–Pb collisions [23], is pronounced. On the basis of the symmetry of the apparatus and of the signal extraction procedure, we are confident that the effect is not caused by an experimental bias. It may be due to a centrality-dependent absorption effect of in a nucleon-rich environment. In this respect, note that at SPS energy the ratio is measured to be lower by a factor about 2 in lead–lead with respect to sulfur-induced collisions [24] and the yield per participant is measured to be lower by a factor in p–Pb [18] with respect to p–Be collisions [23].
4 Comparisons and discussion
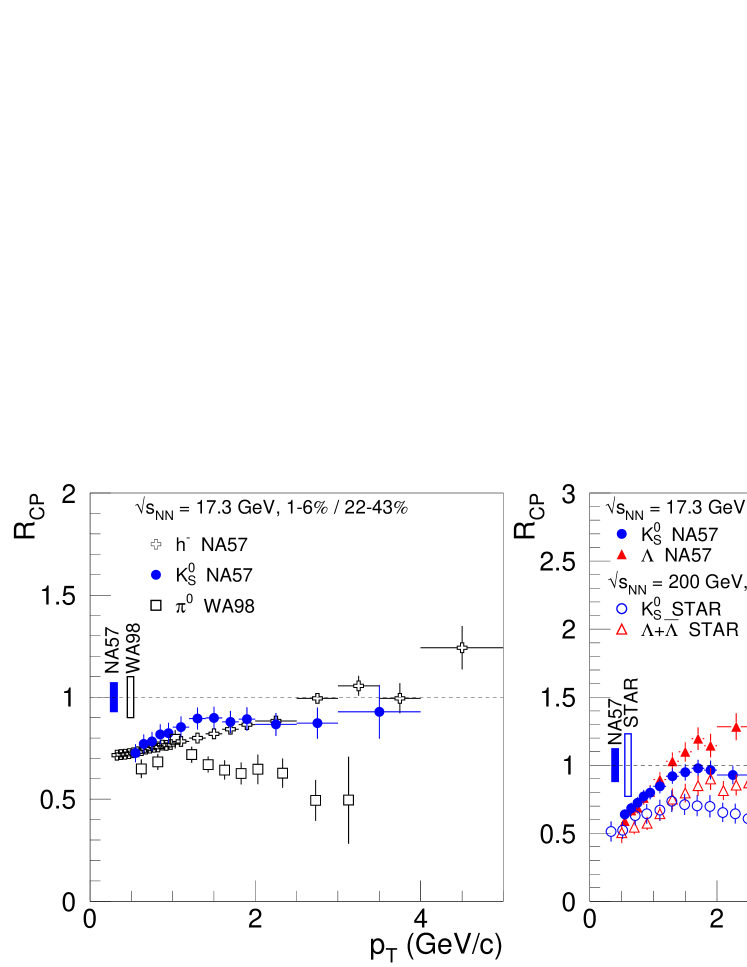
In Fig. 4 we compare our results to measurements at the SPS and at RHIC. In the left-hand panel, the WA98 data [7] for the ratio 1–6%/22–43% in Pb–Pb collisions at are plotted together with the NA57 and data for the same centrality classes333In the WA98 publication [7], the centrality classes are defined using percentiles of the measured minimum bias cross section, . Here, we rename the classes in terms of percentiles of the inelastic cross section, . The values used by the two experiments for the inelastic cross section are very similar: 7.26 b for NA57 and 7.41 b for WA98.. Using these classes, the is approximately constant at 0.9 for and is significantly larger than that measured by the WA98 Collaboration for (), even when taking into account the normalization systematic errors, independent for the two experiments. The data from NA57 are compatible, within the systematic errors, with the data from WA98 for , where the sample is expected to be dominated by . For higher , have a larger than ; this may be due to increasing contributions from and in the sample. At top RHIC energy, , the kaon (as measured by PHENIX [25] and STAR [2]) is larger than that of neutral pions (PHENIX [25]) for , while they are similar for higher transverse momenta. The observed difference in between kaons and pions at SPS energy, and at RHIC energy for low , is reminiscent of the ‘Cronin enhancement’ above -scaling originally observed for in proton–nucleus (pA) collisions at values up to [26]. This enhancement, commonly interpreted as due to initial-state multiple scattering (partonic intrinsic transverse momentum broadening), was in fact found to increase according to the hierarchy pions–kaons–protons [26]. At RHIC energy, owing to the hardening of the distributions, the effect would be reduced compared to lower energies, as confirmed by preliminary results on the particle-species dependence of the d–Au (similar to proton–nucleus) at [27].
The comparison for and at SPS and RHIC (STAR data for Au–Au at [2]) is presented in the right-hand panel of Fig. 4. In the range covered by our data, up to , the relative pattern for and is similar at the two energies, while absolute values are higher at SPS than at RHIC, where parton energy loss is believed to have a strong effect. Part of the difference between the values at the two energies may be due to different nuclear modification of the parton distribution functions (PDFs). In fact, in the range relevant for parton production at a given at the SPS, e.g. for , nuclear PDFs are expected to be enhanced by about 10–20% (anti-shadowing), while almost no effect is expected for the smaller values, , relevant for the same values at RHIC energy (see e.g. [28]). At RHIC, the larger for with respect to kaons [2] or, more generally, for baryons with respect to mesons [25], in the intermediate range, –, has been interpreted as due to parton coalescence [10, 9] in a high-density medium with partonic degrees of freedom. Our data show that a similar – pattern is present also at . We note that such a pattern may also be explained in terms of larger Cronin effect for with respect to kaons.
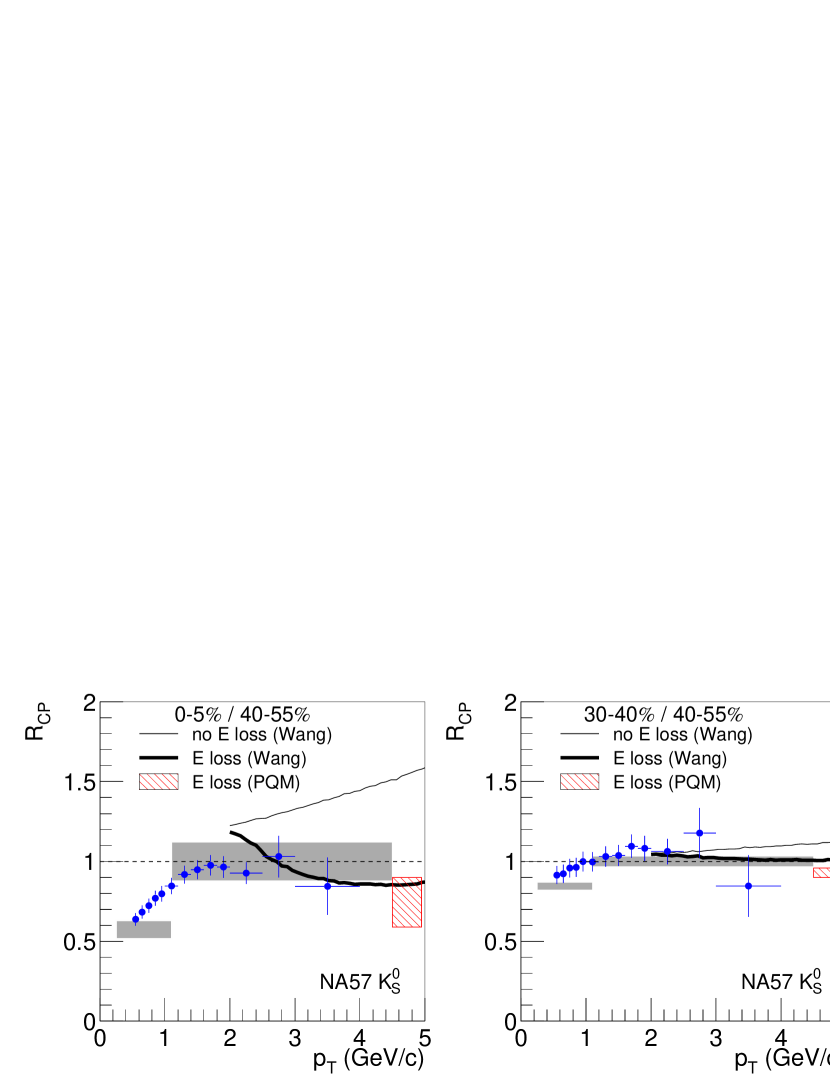
In Fig. 5 we compare our data to predictions provided by X.N. Wang [29], obtained from a perturbative-QCD-based calculation [4, 30], including (thick line) or excluding (thin line) in-medium parton energy loss. The initial gluonic rapidity density of the medium, , was scaled down from that needed to describe RHIC data, according to the decrease by about a factor 2 in the charged multiplicity per unit of rapidity from RHIC to SPS energy. For the 0–5%/40–55% , the curve without energy loss shows a large enhancement, increasing with . In the calculation this enhancement arises principally from initial-state partonic intrinsic transverse momentum broadening, which is assumed to be proportional to the number of scatterings that the two colliding partons suffer inside the nuclei before the hard scattering, and thus larger for central than for peripheral collisions [30]. The magnitude of the broadening is tuned on the basis of the original Cronin effect data [26]. A ‘Cronin-like’ enhancement is observed in the d–Au central-to-peripheral nuclear modification factor for charged kaons at RHIC energy [27], while it is not present in our nucleus–nucleus data. The curve that includes energy loss, scaled down from RHIC as explained above, describes the data better. Moving to less central collisions the predictions with and without energy loss get closer to one another, and both are compatible with the data. As a cross-check, we compare the value predicted by X.N. Wang with energy loss to the prediction of an independent model of parton energy loss, the Parton Quenching Model (PQM), based on the BDMPS formalism [5], that describes several energy-loss-related observables at RHIC energies [31]. Since the PQM model does not include initial-state effects, the predicted was rescaled using the Wang baseline without energy loss (thin line). The PQM result has an uncertainty due to the fact that the medium-induced energy loss becomes of the order of the initial parton energy [31]; since this uncertainty is larger for low-energy partons, the calculation result is meaningful for only. The PQM result, shown in Fig. 5 by the hatched areas, agrees with the Wang calculation with energy loss (thick line). The two models predict a similar energy loss effect at SPS energy, i.e. a reduction of the 0–5%/40–55% (for ) by about a factor 2, with respect to the value calculated without energy loss.
5 Conclusions
Central-to-peripheral nuclear modification factors for , , and in Pb–Pb collisions at top SPS energy have been measured as a function of up to about . At low , agrees with scaling for all the particles under consideration, except the , for which the yields at low are found to increase slower than the number of participants. For , , and show a pattern similar to that observed in Au–Au collisions at top RHIC energy, although the values are found to be larger at SPS. At RHIC, this pattern has been interpreted in the framework of models that combine parton energy loss with hadronization via coalescence, at intermediate , and via fragmentation, at higher . The measured 0–5%/40–55% is not reproduced by a theoretical calculation that includes only initial-state nuclear effects. The data can be better described by including final-state parton energy loss as predicted for SPS energy on the basis of RHIC data.
Acknowledgments.
We thank V. Greco, X.N. Wang and U.A. Wiedemann for fruitful discussions and T. Peitzmann for making available to us the WA98 data.
References
- [1] S.S. Adler et al., PHENIX Coll., Phys. Rev. C 69 (2004) 034910; J. Adams et al., STAR Coll., Phys. Rev. Lett. 91 (2003) 172302.
- [2] J. Adams et al., STAR Coll., Phys. Rev. Lett. 92 (2004) 052302.
- [3] I. Arsene et al., BRAHMS Coll., nucl-ex/0410020; K. Adkox et al., PHENIX Coll., nucl-ex/0410003; B.B. Back et al., PHOBOS Coll., nucl-ex/0410022; J. Adams et al., STAR Coll., nucl-ex/0501009.
- [4] M. Gyulassy and X.N. Wang, Nucl. Phys. B 420 (1994) 583; Phys. Rev. Lett. 68 (1992) 1480.
- [5] R. Baier, D. Schiff and B.G. Zakharov, Ann. Rev. Nucl. Part. Sci. 50 (2000) 37; C.A. Salgado and U.A. Wiedemann, Phys. Rev. D 68 (2003) 014008.
- [6] D. d’Enterria [PHENIX Coll.], J. Phys. G 31 (2005) S491; J. Klay [STAR Coll.], J. Phys. G 31 (2005) S451.
- [7] M.M. Aggarwal et al., WA98 Coll., Eur. Phys. J. C 23 (2002) 225.
- [8] D. d’Enterria, Phys. Lett. B 596 (2004) 32.
- [9] S.A. Voloshin, Nucl. Phys. A 715 (2003) 379; R.C. Hwa and C.B. Yang, Phys. Rev. C 67 (2003) 064902; R.J. Fries, B. Muller, C. Nonaka and S.A. Bass, Phys. Rev. C 68 (2003) 044902; V. Greco, C.M. Ko and P. Levai, Phys. Rev. C 68 (2003) 034904.
- [10] P.R. Sorensen [STAR Coll.], J. Phys. G 31 (2005) S889.
- [11] V. Manzari et al., NA57 Coll., J. Phys. G 25 (1999) 473.
- [12] F. Antinori et al., NA57 Coll., Eur. Phys. J. C 18 (2000) 57.
- [13] F. Antinori et al., NA57 Coll., J. Phys. G 31 (2005) 321.
- [14] R.J. Glauber and G. Matthiae, Nucl. Phys. B 21 (1970) 135; A. Bialas, M. Bleszyński and W. Czyz, Nucl. Phys. B 111 (1976) 461.
- [15] A.S. Carroll et al., Phys. Lett. B 61 (1976) 303.
- [16] R. Gottgens et al., Z. Phys. C 19 (1983) 283.
- [17] C.W. de Jager, H. de Vries and C. de Vries, Atom. Data Nucl. Data Tabl. 14 (1974) 479.
- [18] E. Andersen et al., WA97 Coll., Phys. Lett. B 433 (1998) 209; R.A. Fini et al., WA97 Coll., J. Phys. G 27 (2001) 375.
- [19] F. Antinori et al., NA57 Coll., J. Phys. G 30 (2004) 823.
- [20] J. Podolansky and R. Armenteros, Phil. Mag. 45 (1954) 13.
- [21] F. Antinori et al., NA57 Coll., Phys. Lett. B 595 (2004) 68.
- [22] S.S. Adler et al., PHENIX Coll., Phys. Rev. Lett. 91 (2003) 172301.
- [23] G.E. Bruno et al., NA57 Coll., J. Phys. G 30 (2004) S717.
- [24] D. Evans et al., WA94 Coll. and WA85 Coll., J. Phys. G 25 (1999) 209.
- [25] S.S. Adler et al., PHENIX Coll., Phys. Rev. C 69 (2004) 034909.
- [26] J. Cronin et al., Phys. Rev. D 11 (1975) 3105; D. Antreasyan et al., Phys. Rev. D 19 (1979) 764.
- [27] F. Matathias et al., PHENIX Coll., J. Phys. G 30 (2004) S1113; D. Kotchetkov et al., PHENIX Coll., J. Phys. G 30 (2004) S1317.
- [28] K.J. Eskola, V.J. Kolhinen and C.A. Salgado, Eur. Phys. J. C 9 (1999) 61.
- [29] X.N. Wang, private communication.
- [30] X.N. Wang, Phys. Rev. C 61 (2000) 064910; Phys. Rev. Lett. 81 (1998) 2655; Phys. Lett. B 595 (2004) 165.
- [31] A. Dainese, C. Loizides and G. Paić, Eur. Phys. J. C 38 (2005) 461; private communication.