Flux profile scanners for scattered high–energy electrons
Abstract
The paper describes the design and performance of flux integrating Cherenkov scanners with air–core reflecting light guides used in a high–energy, high–flux electron scattering experiment at the Stanford Linear Accelerator Center. The scanners were highly radiation resistant and provided a good signal to background ratio leading to very good spatial resolution of the scattered electron flux profile scans.
keywords:
Electron flux profile scanner , Cherenkov detector , air–core reflecting light guide.PACS:
29.40.Ka, , , , , , , , , , , , ††thanks: Present address: 5037 Great Ocean Rd., Lavers Hill, Victoria, Australia 3238. ††thanks: Corresponding author. Department of Physics, Smith College, Northampton, MA, 01063, USA, Tel: 413 585 3882, FAX 413 585 3786, E–mail: pdecowski@smith.edu. ††thanks: Present address: 97 Mt. Warner Rd., Hadley, MA 01035, USA. ††thanks: Present address: Physics Dept., 590 Commonwealth Ave., Boston University, Boston, MA 02215, USA. ††thanks: Present address: St. Norbert College, De Pere, WI 54115, USA. ††thanks: Deceased.
1 Introduction
Electron–electron (Møller) scattering at GeV beam energies gives rise to a far–forward angular distribution of scattered electrons. If hydrogen targets are used, small–angle electron scattering from protons must be distinguished from the signal of interest which is the electron–electron scattering. This report describes detectors built to measure the spatial distribution and relative integral flux of scattered electrons from intense incident beams of 48.3 and 45.0 GeV electrons incident upon a liquid hydrogen target in the E158 experiment at the Stanford Linear Accelerator Center [1].
The detector design confronted two main challenges. First, the intensity of the scattered electron flux of interest ( electrons/s/cm2 at a duty cycle of ) created a very harsh radiation environment. This precluded the use of components that would be exposed for significant periods to the scattered beam, including photomultiplier tubes. Second, within the scattered beam the particle flux varied by more than an order–of–magnitude. The detector therefore needed to have fine granularity without being influenced by the magnitude of the flux nearby.
The active detector element was fused silica that produced Cherenkov light and was preceded by a tungsten pre–radiator. Such detectors are not only radiation–hard, but they also have a directional response that can be exploited to suppress background. Cherenkov light from the fused silica was directed by means of a reflective air–core light–guide to a photomultiplier tube (PMT) safely located outside the scattered beam, 50 cm from the radiator. Conventional solid light–guide materials were unacceptable. Such light guides would produce abundant Cherenkov light on their own and could scintillate. Furthermore, they would degrade or discolor because of the intense radiation background. The light produced inside such light guides could exceed the small signal produced when the detector’s active element but not the light guide is located in a region of relatively low scattered beam intensity. The air–core light guides we developed consisted of hollow–tubes lined with reflective Alzak sheet [2]. Alzak has an optical finish produced by electrochemically brightening and anodizing a high purity aluminum alloy. It also has high permanent reflectivity and good resistance to corrosion and abrasion.
These detectors were mounted on electromechanical movers that allowed the detector element to be moved remotely through the scattered beam. In one application this enabled us to determine the full spatial profile of the scattered beam intensity. Of course, the same result could also have been achieved by using an array of detectors and light–guides. However, this would have required periodic cross–calibrations of the responses of the various detectors. The use of a single, or, at most, a small number of scanning detectors not only avoided this chore, but also facilitated the removal of the detectors from the scattered beam profile during data acquisition with other detectors.
These detectors were developed for SLAC experiment E158 [1] whose objective was to determine the weak mixing angle by the measurement of parity–violation in the Møller scattering of polarized electrons from electrons in a liquid hydrogen target. This experiment employed a forward spectrometer, and the polarization asymmetry of the Møller cross section was determined by flux–integration of the forward–scattered electron beams of different helicities. Due to the design of the E158 spectrometer, scattered electrons were constrained to two forward–directed circular bands between 4.4 and 7.5 mr surrounding an intense background of forward photons generated by bremsstrahlung within the target. Near the main E158 calorimeter detector, the radial distribution of the scattered electron ranged from 18–35 cm, with Møller electrons confined to an inner band of radius 18–24 cm containing about electrons per beam pulse. Outside the Møller band was a concentric band of electrons produced by the scattering of the incident electrons off the protons in the hydrogen target.
2 Small–probe Cherenkov detectors
2.1 General Discussion
The primary function of these detectors was to carefully map the relative spatial distribution of the scattered beam before it was absorbed in the Møller calorimeter. This mapping constituted the principal means of ensuring that the beam was centrally aligned at the detector, and that the inner ring of Møller electrons was clearly separated from the outer ring of e–p electrons. These measurements were critical for tuning the spectrometer during detector commissioning.
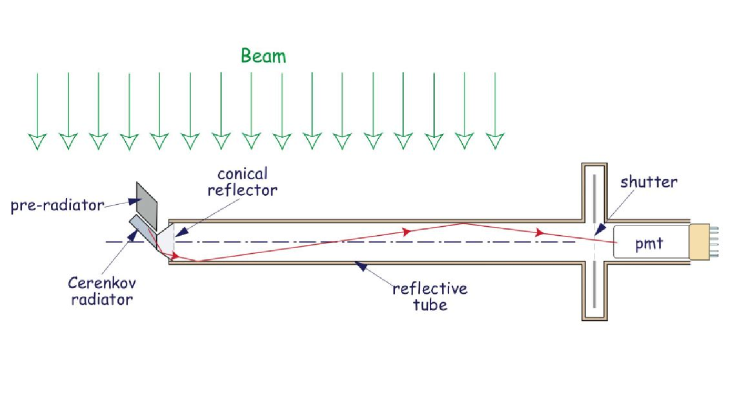
Figure 1 illustrates the essential features of these detectors. The active element was a mm3 piece of fused silica. This was oriented at an angle of 45∘ with respect to the incident beam in order to match the Cherenkov angle for relativisitic electrons in fused silica. In order to increase the sensitivity of the device, a rhombic mm3 tungsten pre–radiator was mounted on the upstream side of the radiator. Cherenkov photons emerging from the end of the radiator were reflected along a tube lined with a reflective Alzak [2] foil until they were detected by a photomultiplier tube (PMT). For each beam pulse the total charge collected on the PMT anode was digitized by the LeCroy 2249W ADC.
2.2 Design Considerations
Extensive Monte–Carlo simulations were made to optimize the design of the detector. These revealed that even though the fused silica radiator was aligned to match the opening angle of the Cherenkov light cone, the overwhelming majority of detected Cherenkov photons were multiply reflected inside the radiator. Because not all of these reflections proceeded by total internal reflection, wrapping the radiator in reflective foil increased the sensitivity of the device by about 10%.
Due to the multiple reflections inside the radiator, Cherenkov photons emerge from the end of the radiator with a large range of angles. Simulations showed that a reflector cone surrounding the end of the radiator would be effective in deflecting Cherenkov photons towards the PMT, thereby increasing the sensitivity of the device.
Two provisions were made to help identify and determine experimental backgrounds. First, as indicated in Fig. 1, an electromechanical shutter was installed immediately in front of the PMT. With the shutter open, reflected Cherenkov photons could enter the PMT and interact in its photocathode. When shut, however, the shutter intercepted those photons permitting a measurement of the background due to ionizing radiation hitting the PMT. The second provision, not indicated in Fig. 1, was the capability of being able to move the pre–radiator from the upstream to the downstream side of the radiator. This allowed us to ensure that the signal was due to the beam directly striking the pre–radiator, rather than from secondary interactions of the beam in other nearby components of our experimental setup.
The key variables affecting the sensitivity were the internal diameter and length of the reflector lined tube, and the properties of the radiator, pre–radiator, and reflecting surfaces. One concern was that rolling the Alzak sheet to form a small–radius tubular light–guide could degrade the 95% reflectivity specified for our Alzak material. However, as indicated in Fig. 2, which compares measured and simulated [3] photon transmission in a 19 mm diameter tube of varying length, this concern was unfounded: a reflectivity of 93% gives excellent agreement between experiment and theory.
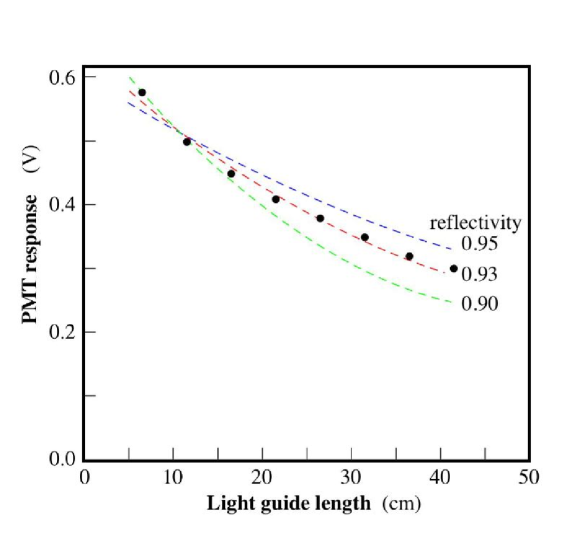
Figure 3 shows the simulated Cherenkov light collection as a function of light guide diameter and cone opening angle. Only photons in the wavelength range 350 – 440 nm were considered, corresponding to a quantum efficiency of 25% for most photocathode materials. The photons were assumed to undergo specular reflection within the light–guide cone and tube until they reached the PMT entrance window located 50 cm from the radiator. Photons that struck the PMT window at large angles of incidence failed to be transmitted through to the photocathode.
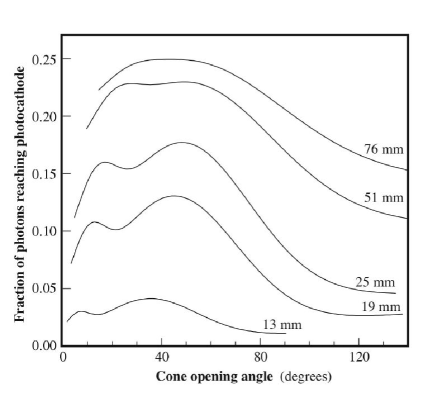
As expected, for small tube diameters the calculated collection efficiency drops due to the large number of reflections required for propagation along the full length of the tube. The light collection generally has a broad maximum for cone opening angles of 35∘–60∘.
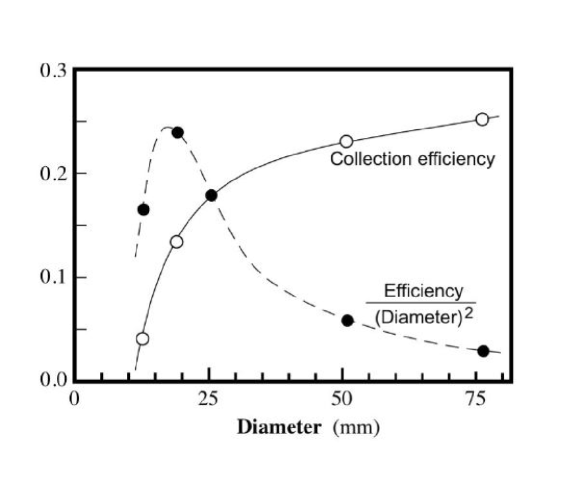
Although large matching light guide and PMT diameters favor high collection efficiency, they also make the detector more susceptible to background arising from the flux of particles traversing the light guide between the radiator and PMT photocathode, as well as to secondary radiation interacting directly in the PMT photocathode. In part, the corresponding signal–to–background ratio may be quantified by the ratio of the collection efficiency to the volume of the light guide or PMT window. An equivalent figure–of–merit, indicated in Fig. 4, is the collection efficiency divided by the square of the light guide or PMT diameter. The corresponding ratio is seen to be optimal for a PMT diameter close to that of the 19 mm diameter tube used in our design. Somewhat different models for the background generation do not significantly alter this conclusion.
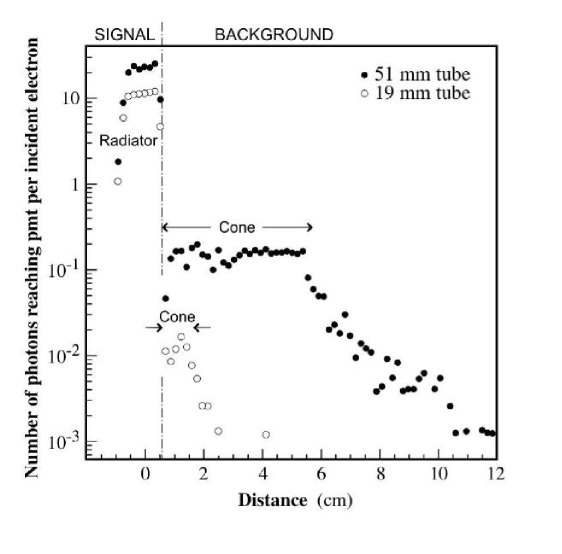
Cherenkov and scintillation photons produced in the air contained within the light guide constitute most of the background. In contrast to the Cherenkov photons that are radiated at an angle of only 1.4∘ in air relative to the initial electron direction, scintillation photons are isotropically distributed. Using results of ref. [4], one can estimate that a minimum ionizing particle passing through one cm of air produces about 0.0066 photons/sr in the wavelength range matching the photomultiplier cathode sensitivity. Assuming a 2 sr solid angle of photon collection in the 19 mm diameter reflective–tube and the 1.5 cm average path of the electron traversing it, yields one scintillation photon reaching the PMT per about 20 passing electrons. This number should be compared with about 200 Cherenkov photons reaching the PMT per electron passing through the radiator, as will be discussed, and is shown in Fig. 6. Therefore under condition of uniform illumination, each cm of the tube would contribute about 0.06% to the signal from the Cherenkov light produced within the radiator. This number is sufficiently low to assure that even with an electron flux density varying by two orders of magnitude, the scintillation contribution from air in the light guide will not exceed a few percent.
Due to the small angle of Cherenkov photons produced in air, Cherenkov radiation produced within the light guide was of little concern over most of the length of the light guide tube: these photons just reflect back and forth, transverse to the tube axis.
On the other hand, Cherenkov photons produced within the reflective cone adjacent to the radiator are not similarly trapped; such photons may – with just one or two reflections – enter the PMT window. Figure 5 shows the results of simulations of Cherenkov production in the radiator and in the air–core light guide under uniform electron flux irradiation for two light–guide diameters, 19 and 51 mm, assuming identical mm3 radiators of fused silica. As indicated, the larger diameter tube has a collection–efficiency for light produced in the radiator that is better by a factor of two. However, due to the much smaller air volume within its cone, the background produced within the light–guide of the 19 mm diameter tube is smaller by about two orders–of–magnitude, a striking improvement of scanner flux profile resolution, well worth the cost of the reduced signal in the narrower tube.
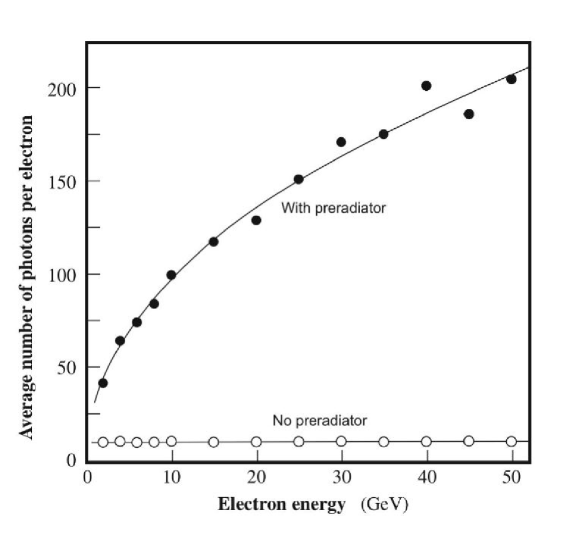
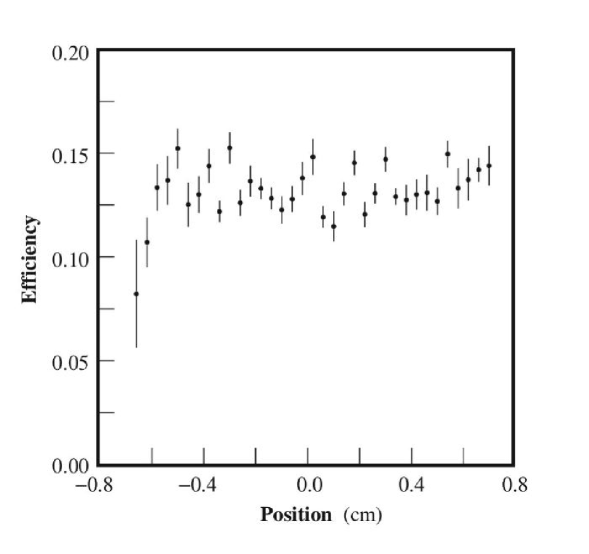
As indicated in Fig. 6, the addition of the tungsten pre–radiator immediately upstream of the fused quartz radiator makes the detector much more responsive. The signal–to–background ratio is similarly improved. In addition, the pre–radiator enhances the directionality of the detector response, making it relatively insensitive to electron back–splash and other off–axis backgrounds. Finally, results of simulations shown in Fig. 7 demonstrate the uniformity of the light collection as a function of the Cherenkov production position within the radiator.
2.3 Construction
Figure 8 shows the final version of the scanning Cherenkov detector that was built for experiment E158. Cherenkov light was produced in a fused silica radiator measuring mm3, canted at an angle of 45∘ to the incoming electron beam. As noted above, the 45∘ alignment of the quartz with respect to the beam served to optimize the response of the Cherenkov detector to the incoming beam and reduce sensitivity to background. Due to the high intensity of the scattered beam, the PMT that collects this Cherenkov light was situated just outside the E158 phase–space, about 50 cm from the radiators.
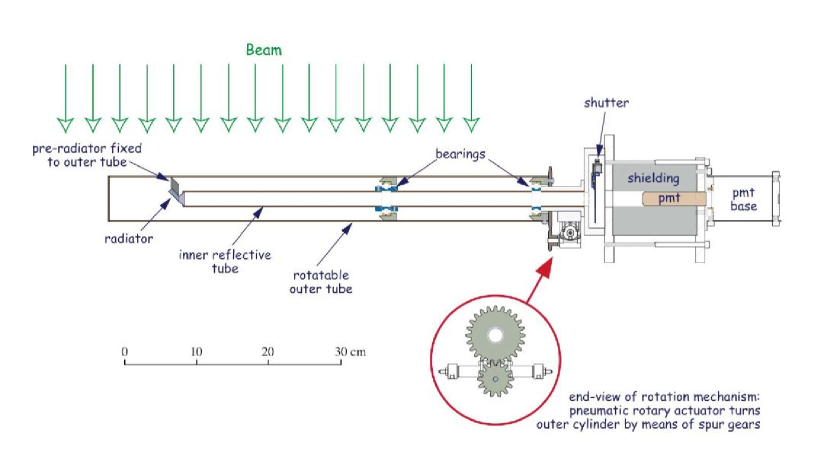
The inner tube was aluminum, with an inner diameter of 20.5 mm and a wall thickness of 0.08 mm. It was lined with a rolled sheet of Alzak–surfaced aluminum. The sheet we used was difficult to roll because it was 0.3 mm thick; if available, thinner stock would be preferred.
The electromechanical shutter [5] had a circular aperture of 25.4 mm. Normally the shutter was open, but when closed it allowed us to check for background generated by stray ionizing radiation directly hitting the 19 mm diameter PMT [6]. In order to reduce this background the sides of the PMT were shielded by 4 cm of tungsten.
2.4 Motion
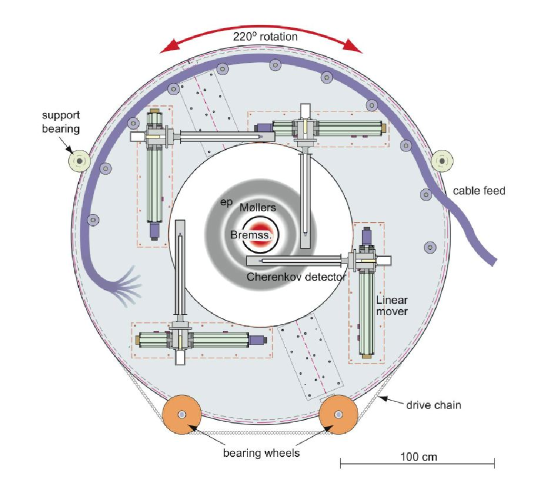
As described above, in experiment E158 the electrons scattered from the protons and from the electrons in the hydrogen target formed two concentric circular bands surrounding an intense forward–directed bremsstrahlung background. In order to scan the two bands, Cherenkov detectors were positioned 90∘ apart on a rotatable annulus of outer diameter 246 cm as shown in Fig. 9. The detectors were mounted on four linear movers [7] so that they could be moved radially relative to the beam axis. The annulus could be rotated through an angle of 220∘ thus allowing the entire profile of the scattered electrons to be measured. In order to avoid beam interception during the experimental runs, the Cherenkov detectors were moved to a radial position beyond the scattered electron beam.
The annulus [8] had an outside aluminum rim of 44 mm radial thickness and 108 mm depth onto which was welded a 6 mm thick circular aluminum plate. For ease of transport and flexibility in assembly, it separated into two halves joined together by fish plates and by tension blocks welded under the rim. The annulus was entrapped and supported by a pair of large brass bearing wheels, and was rotated by means of turning a sprocket wheel that engaged a roller chain fixed in a groove machined into the edge of the rim. The sprocket wheel itself was driven through a 20:1 reduction gear by a stepping motor mounted on the support frame for the annulus. When assembled at SLAC with its full complement of detectors, the roundness of the annulus was measured to be better than 0.25 mm.
The annulus rotation and the linear translation of the Cherenkov scanners were remotely controlled by means of a LabView Flexmotion [9] application. The Cherenkov scanners were equipped both with optical rotary encoders for the motion control, and with linear potentiometers [10] for providing position information into the data acquisition system.
2.5 Performance
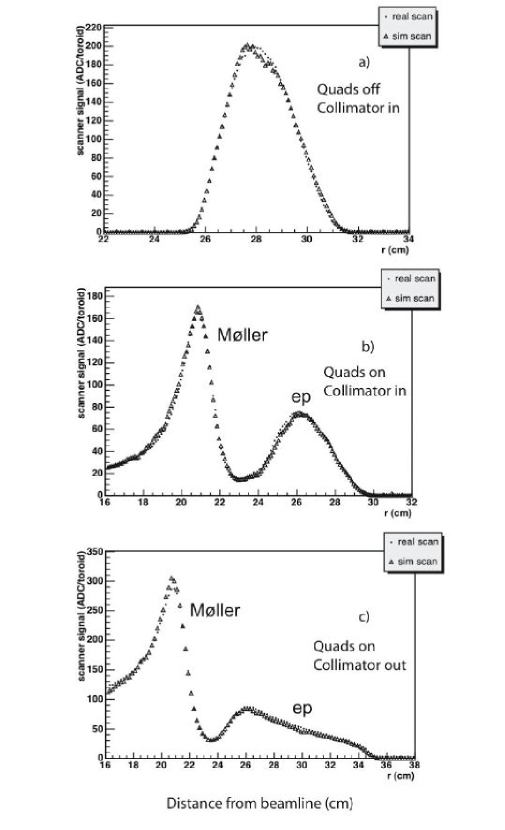
The scanner system worked well throughout the two–year period of this experiment. Apart from the commissioning periods when it was used extensively, the scanner was typically used for beam profile checks about twice each day. Despite the large integrated luminosity of this experiment, no degradation was observed in the scanner performance. Fig. 10 shows results of radial scans during the E158 magnetic spectrometer commissioning, and a typical scan during the production run. They are compared with the results of the GEANT Monte Carlo simulations of the spectrometer response. Very good agreement between measured scans and simulations gives account of a good control in simulations of all effects influencing the spectrometer performance.
3 Cherenkov Polarimeter
3.1 Introductory Remarks
In experiment E158 the polarization of the incident electron beam was determined by measuring Møller scattering from magnetized iron foils mounted at 20∘ with respect to the beam and ranging in thickness between 20 and 100 m. For such thin targets, the Møller count rate was reduced by a factor of 200 compared to the rate from the 1.5 m long liquid hydrogen target used in the experiment. In order to eliminate the e–p background and define a certain kinematics acceptance, a collimator was used which limited the scattered beam to an area of 7 x 1 cm2 in the detector plane. The Møller calorimeter was not suitable for polarimetry measurements because its size and geometry did not match the collimator geometry. On the other hand, the reduction of the scattered flux intensity would have made it difficult to acquire the desired precision with the small scanning Cerenkov detector described in section 2.
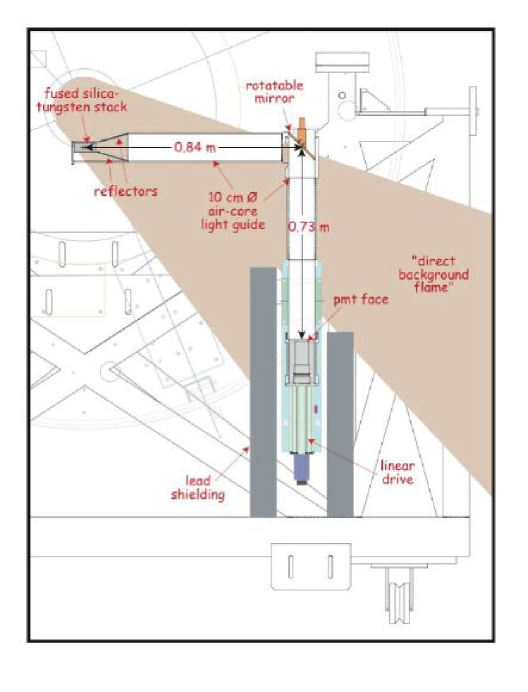
Hence a second air–core detector was designed that featured a much larger and thicker active element. Nevertheless, the overall concept for this polarimeter was similar to that of the smaller air–core Cerenkov scanners. As shown in Fig. 11, the air–core light guide of the polarimeter was a 10 cm internal diameter tube whose internal surface was lined with Alzak [2]. Cerenkov photons were reflected around a 90∘ angle in the tube by means of an Alzak–surfaced rotatable mirror that could be set to bisect the angle between the horizontal and vertical tubes. This arrangement has two benefits. First, by rotating the mirror 180∘ about a vertical axis, Cherenkov photons that would normally be reflected towards the PMT were obstructed. This allowed a measurement of the background due to radiation interacting directly in the pmt. Effectively then, the rotatable mirror served the same function as the shutter in the scanning Cherenkov detector. The second feature, a significant improvement over the more compact Cherenkov scanner, is that the 90∘ angle in the light–guide permitted the photocathode of the PMT to be shielded from line–of–sight background originating in the vicinity of the beam pipe. In our case the shielding was provided by 10 cm of lead surrounding the detector.
The active element of the polarimeter consisted of alternating layers of fused silica and tungsten of total thickness of 13 radiation lengths.
3.2 Design
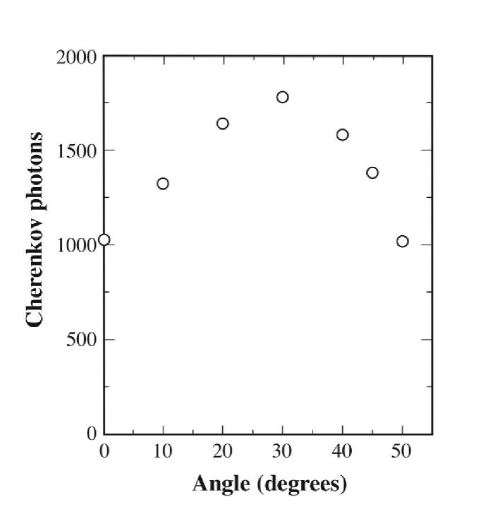
The transverse size of the active element was optimized to match the 7 x 1 cm2 image produced by special spectrometer optics used in the polarimetry measurements. In order to allow for the transverse development of the electromagnetic shower within the detector, the size of the fused silica–tungsten stack was made slightly larger than this. Each of the six fused silica plates measured 9.3 x 3.5 x 0.6 cm3 , and the tungsten plates, 7 in all, 9.8 x 3.5 x 0.6 cm3 . As shown in Fig. 12, this stack was tilted relative to the beam by 30∘, an angle calculated to optimize the response of the detector. The calculated dependence on angle is shown in Fig. 13.
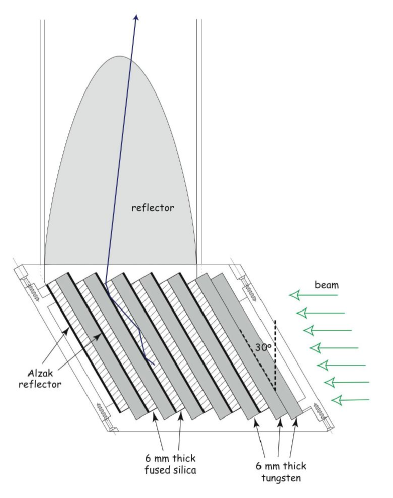
Extensive GEANT [3] Monte–Carlo calculations were made to optimize the details of the detector. These calculations guided the choice of the number and thicknesses of the fused silica and tungsten layers, as well as their orientation relative to the beam. In addition to the Alzak lining of the light–guide tube, the simulations also favored the use of reflective surfaces elsewhere in the detector. For example, calculations showed that reflective foils laid against each fused silica plate increased the response of the detector by about 30%. The simulations also showed the efficacy of two planar reflectors, semi–elliptical in shape, installed above and below the detector element at an angle of 15∘ to the tube axis. Cherenkov photons emerging from the fused silica layers were reflected by these Alzak reflectors such that they followed paths more parallel to the axis of the air–core light guide. This reduced the number of reflections each ray underwent, thus improving the light collection.
The adopted design provided not only large signal strength, but also the necessary energy resolution to discriminate against low energy backgrounds. As indicated in Fig. 14, the response of the calorimeter is also reasonably linear in a range of 10–100 GeV, though the relative signal drops considerably for low and for high energies. The drop at low energies aids in reducing background.
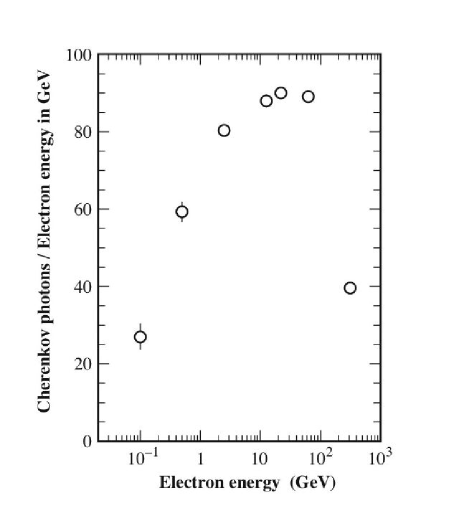
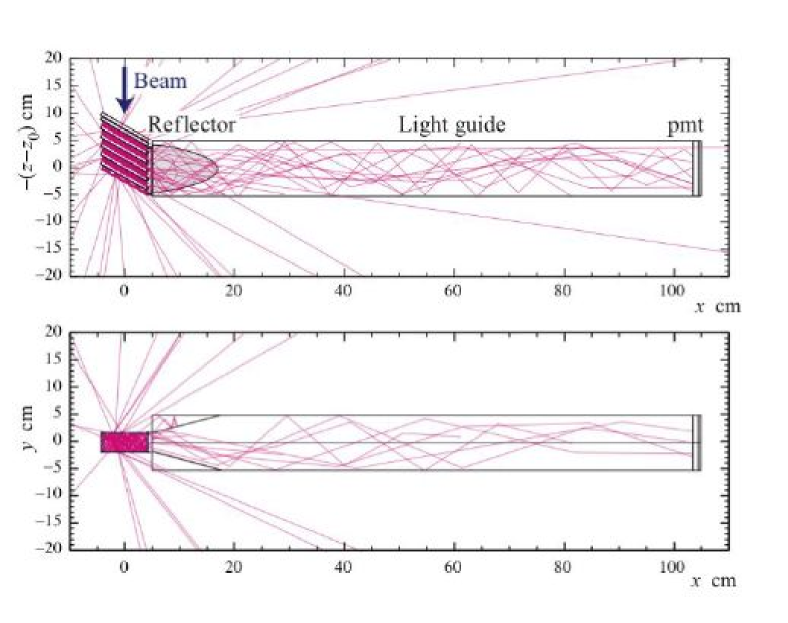
Figure 15 shows two perspectives of the simulated response of the detector to the absorption of a 22 GeV electron. No shower products are shown other than the Cherenkov photons. Moreover, for clarity, only 0.5% of the expected number of photons were simulated.
The simulations, for a 1 m long straight air–core light guide with a 10 cm internal diameter and a 10 cm phototube indicated that about 1800 Cherenkov photons reach the PMT for every 22 GeV Møller electron absorbed in the detector. Because the constructed light guide was 1.6 m long with a 90∘ bend, and a 5 cm Hamamatsu PMT [11] was used, in practice, the yield was considerably lower. Moreover, the window material of the PMT was not of a type that favors high ultraviolet transmission, and hence a fraction of the Cherenkov photons were absorbed before reaching the PMT photocathode. However, these losses were considered acceptable in view of the large flux of Møller–scattered electrons incident upon the polarimeter (a few hundred electrons per 1011 electrons in the beam pulse).
3.3 Some practical information
The rotatable mirror was fabricated by bolting a 6.3 mm thick brass plate to the 45∘–beveled end of a 33 mm diameter aluminum shaft. By turning the shaft in a lathe, the plate was machined to the required elliptical profile. An Alzak foil was fixed to the brass plate to provide the reflective surface. The assembly was rotated by a 180∘ pneumatic actuator [12], and limit switches were added to indicate the mirror position.
When not in use, the polarimeter was moved outside of the scattered beam region. As for the Cherenkov scanners, this motion through a radial distance of 0.5 m, was provided by a linear mover [7] equipped with limit and home switches, and rotary and linear position encoders. The square rails of the linear mover were well–suited for resisting the appreciable torque imposed by the 5 kg of tungsten supported a distance of 85 cm off to the side of the mover’s axis.
As with the Cherenkov scanners, the motion of the polarimeter was controlled by a National Instruments Flexmotion [9] with its linear potentiometer providing position information to the data acquisition system.
3.4 Performance
Figure 16 shows results for two radial scans for an unpolarized carbon target. One scan was made with the mirror set for transmission, the other for the mirror obstructing Cherenkov photons. This lack of a sizeable signal in the obstructed case confirms that background due to radiation interacting directly in the PMT was insignificant.
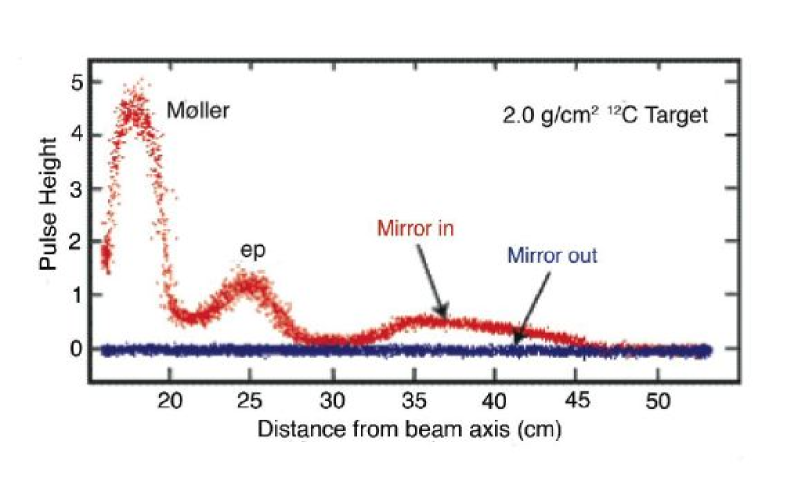
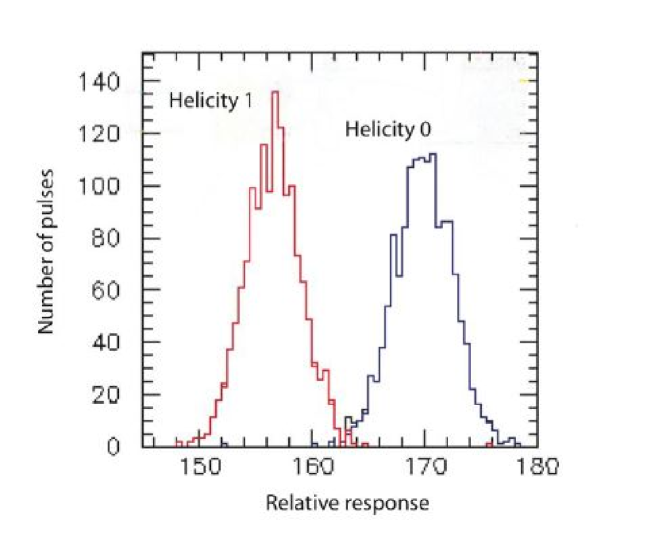
Figure 17 shows the polarimeter response distribution obtained using a polarized foil. In one case the beam polarization is aligned with the polarization of target electrons, (total helicity 1), in the other case the polarizations are opposite (total helicity 0). The response is normalized according to the charge in each accelerator beam pulse, as measured by a toroidal coil. The difference in responses arises from the dependence of the Møller cross section on the total helicity. The data were used to determine the extent of the polarization of the incident electron beam. In our case this ranged from 80–90%, with a statistical uncertainty of about 4% for a 20 minute run.
4 Summary
The scanners described in the paper turned out to be very useful in commissioning the experiment and controlling properties of scattered beam and backgrounds in the E158 detector system in which electron flux scattered from the beam carrying 0.5MW of power was measured at an extremely small angle of 0.3∘. The scanners were highly radiaton resistant and provided very good spatial resolution of the flux profile. Knowledge of precise radial and azimuthal flux distributions was critical for good understanding of the detector system and minimizing backgrounds in the main calorimeter.
5 Acknowledgements
This work was supported by Department of Energy contract DE–AC03–76SF00515, and by the Division of Nuclear Physics at the Department of Energy and the Nuclear Physics Division of the National Science Fundation in the United States.
References
- [1] SLAC proposal E158: “A Precision Measurement of the Weak Mixing Angle in Møller Scattering”, K.S. Kumar et al. (1997), url] http://www.slac.stanford.edu/grp/rd/epac/Proposal/E158.pdf P.L. Anthony et al., Phys. Rev. Lett., 92, 181602 (2004).
-
[2]
MIRO 2, ALANOD Aluminium–Veredlung GmbH & Co. KG, Ennepetal, Germany.
Alzak is a registered trademark of the Aluminum Company of America (ALCOA). - [3] GEANT v. 3.21, CERN Program Library.
- [4] S. Bertolucci et al., ”Scintillation in Gases Commonly Used as Cherenkov Radiators”, DESY preprint 75/16, July 1975.
- [5] Uniblitz shutter. Vincent Associates, Rochester N.Y., USA.
- [6] Thorn EMI, model 9083A. Electron Tubes Limited, Ruislip, Middlesex, England.
- [7] Parker–Daedal, model 404XR.
- [8] Fabricated to our specifications by Western Mass Machining, of Holyoke, Massachusetts.
- [9] National Instruments, Inc., Austin, TX, USA.
- [10] Unimeasure Inc., Corvallis, OR, USA.
- [11] Hamamatsu Photonics, model R2154–02 (2 inch). Hamamatsu City, Japan.
- [12] Bimba Manufacturing Company, Monee, IL, USA.