Precise Determination of the Neutron Magnetic Form Factor to Higher
Abstract
The neutron elastic magnetic form factor has been extracted from quasielastic scattering from deuterium in the CEBAF Large Acceptance Spectrometer, CLAS [1]. The kinematic coverage of the measurement is continuous over a broad range, extending from below 1 to nearly 5 in four-momentum transfer squared. High precision is achieved by employing a ratio technique in which most uncertainties cancel, and by a simultaneous in-situ calibration of the neutron detection efficiency, the largest correction to the data. Preliminary results are shown with statistical errors only.
1 INTRODUCTION
The elastic form factors of the proton and neutron are fundamental quantities which have been studied for decades. The dominant features of the larger form factors , , and were established in the 1960’s: the dipole form gives a good description, corresponding to an exponential falloff in the spatial densities of charge and magnetization. In the intervening decades, obtaining higher precision measurements of these quantities has been one thrust of the field, while new directions have also emerged, especially over the past decade. These include precise measurements of the neutron electric form factor [2], and extractions of the strange electric and magnetic form factors for the proton [3], as well as time-like form factors [4]. In addition to experimental progress, there has been renewed theoretical interest on several fronts [5]. First, models of the nucleon ground state can often be used to predict several of these quantities, and it has proven to be very difficult to describe all of the modern data simultaneously in a single model approach. Second, lattice calculations are now becoming feasible in the few-GeV2 range, and over the next decade these calculations will become increasingly precise. Finally, since elastic form factors are a limiting case of the generalized parton distributions (GPDs), they can be used to constrain GPD models. For this purpose, high precision and a large coverage is quite important [6]. At present the neutron magnetic form factor at larger is known much more poorly than the proton form factors.
2 THE CLAS MEASUREMENT
The present measurement [7] makes use of quasielastic scattering on deuterium where final state protons and neutrons are detected. The ratio of to in quasi-free kinematics is approximately equal to the ratio of elastic scattering from the free neutron and proton. The ratio is:
| (1) |
Using deuteron models one can accurately compute the correction factor , which is nearly unity for quasielastic kinematics and higher . The value of is then obtained from the measured value of and the experimentally known values of , , and ; this method has been used previously [8]. The and reactions were measured at the same time from the same target. Use of the ratio under these circumstances reduces or eliminates several experimental uncertainties, such as those associated with the luminosity measurement or radiative corrections. The remaining major correction is for the detection efficiency of the neutron.

2.1 Neutron Detection Efficiency
Neutrons were measured in three CLAS scintillator-based detectors: the forward-angle and large-angle electromagnetic shower calorimeters, and the time-of-flight scintillators. The efficiency measurement was performed using tagged neutrons from the reaction where the mass of the final state was chosen to be that of the neutron.
Since the precise value of the detection efficiency can vary with time-dependent and rate-dependent quantities such as photomultiplier tube gain, the detection efficiency was measured simultaneously with the primary deuterium measurement. Two separate targets were positioned in the beam at the same time, one for deuterium and the other for hydrogen, separated by less than 5 cm.
A plot of the resulting neutron detection efficiency is shown in Fig. 1. The main plot shows the results for the forward electromagnetic shower calorimeter, while the insets show the results for the large angle calorimeter and the time of flight scintillators.
2.2 Overlapping Measurements
The CLAS extraction of actually consists of multiple overlapping measurements. The time of flight scintillators cover the full angular range of the spectrometer, while the calorimeters cover subsets of these angles, thus can be obtained from two independent measures of the neutron detection efficiency. In addition, the experiment was carried out with two different beam energies that had overlapping coverage in , so that the detection of the protons of a given took place in two different regions of the drift chambers. As a result, essentially four measurements of have been obtained from the CLAS data that potentially could have four independent sets of systematic errors. In practice these four measurements are consistent within the statistical errors, suggesting that the systematic errors are well-controlled and small.
2.3 Systematic Uncertainties
The final evaluation of the systematic uncertainties for this measurement has not been performed, and therefore only statistical uncertainties are presented. It is anticipated that several systematic uncertainties will contribute at the percent level, with a number of others contributing at a fraction of a percent. The larger uncertainties are expected to be due to the neutron detection efficiency determination, the two-photon-exchange portion of the radiative correction, uncertainties in , , and , and suppression of inelastic background. The smaller uncertainties are expected to be due to the proton detection efficiency (measured by elastic scattering from the hydrogen target), the remnant of the radiative corrections not cancelling in the ratio, the theoretical correction for quasi-free scattering, the definition of the fiducial volume for neutrons and protons, and a number of other small contributions. It is expected that the ultimate uncertainties will range from two to three percent over the full range in .
2.4 Preliminary Results
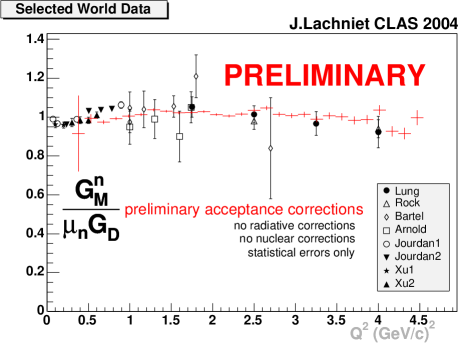
The preliminary results are shown in Fig. 2 together with a sample of existing data. The error bars shown are due only to statistical uncertainties. The data shown are the weighted averages of the four overlapping individual measurements discussed above. Because these results are preliminary, it is necessary to be cautious about the conclusions drawn, since few-percent shifts in the results are still possible. Nonetheless, a few features are noteworthy. First, the quality and coverage of the data is a very substantial improvement over the existing world’s data set. Second, the dipole form appears to give a good representation of the data over the range measured, which is at variance at higher with parameterizations based on previous data, which tend to show a more strongly decreasing trend for with increasing .
At face value, the lowest points appear to disagree with previous high-precision data. However, these data are too preliminary to make this conclusion. The lowest four points, unlike all others on the plot, are not an average over multiple measurements, and they are near the edge of the detector acceptance. Some further study is required to establish the final centroids and uncertainties for these points.
References
- [1] B. Mecking et al., Nucl. Inst. and Meth. A 503 (2003) 513.
- [2] R. Madey et al., Phys. Rev. Lett. 91 (2003) 122002, G. Warren et al., Phys. Rev. Lett. 92 (2004) 042301, and references therein; see also M. Seimetz, these proceedings.
- [3] K. S. Kumar, P. A. Souder, Prog. Part. Nucl. Phys. 45 (2000) s333; see also K. Paschke, J. Martin, and S. Baunack, these proceedings.
- [4] M. Ambrogianai et al., Phys. Rev. D 60 (1999) 032002.
- [5] C. E. Hyde-Wright and Kees de Jager, Annu. Rev. Nucl. Part. Sci. 54 (2004) 217; H. Gao, Int. J. Mod. Phys. E 12 (2003) 1; Erratum-ibid. E 12 (2003); 567 see also D. Day, these proceedings.
- [6] M. Diehl, et al., hep-ph/0408173; P. Kroll, private communication.
- [7] Experiment E94-017, W. K. Brooks and M. F. Vineyard, spokespersons.
- [8] G. Kubon, Phys.Lett. B 524 (2002) 26; see also I. Sick, these proceedings.