Is There a Significant Difference Between the Results of the Coulomb Dissociation of and the Direct Capture Reaction?
Abstract
Recent claims of the Seattle group of evidence of ”slope difference between CD [Coulomb Dissociation] and direct [capture] results” are based on wrong and selective data. When the RIKEN2 data are included correctly, and previously published Direct Capture (DC) data are also included, we observe only a 1.9 sigma difference in the extracted so called ”scale independent slope (b)”, considerably smaller than claimed by the Seattle group. The very parameterization used by the Seattle group to extract the so called b-slope parameter has no physical foundation. Considering the physical slope (S’ = dS/dE) above 300 keV, we observe a 1.0 sigma agreement between slopes (S’) measured in CD and DC, refuting the need for new theoretical investigation. The claim that values extracted from CD data are approximately 10% lower than DC results, is based on misunderstanding of the CD method. Considering all of the published CD results, with adding back an unconfirmed E2 correction of the MSU data, yields very consistent results that agree with recent DC measurements of the Seattle and Weizmann groups. The recent correction of the b-slope parameter (0.25 ) suggested by Esbensen, Bertsch and Snover was applied to the wrong b-slope parameter calculated by the Seattle group. When considering the correct slope of the RIKEN2 data, this correction in fact leads to a very small b-slope parameter (0.14 ), less than half the central value observed for DC data, refuting the need to correct the RIKEN2 data. In particular it confirms that the E2 contribution in the RIKEN2 data is negligible. The dispersion of measured is mostly due to disagreement among individual DC experiments and not due to either experimental or theoretical aspects of CD. Additional uncertainty exists due to theoretical extrapolation procedure that for example was recently estimated by Descouvemont to be 6%, more than a factor of two larger than suggested by the Seattle group. Uncertainty of the slope (S’), that thus far was not measured with high precision, leads to a substantial error of extrapolated .
pacs:
26.30.+k, 21.10.-k, 26.50.+k, 25.40.LwI Introduction
The method of Coulomb Dissociation (CD) was developed in the pioneering work of Baur, Bertulani and Rebel Baur and has been applied to the case of the CD of Mot94 ; Kik ; Iw99 ; Sch03 . These data were analyzed with a remarkable success using only first order Coulomb interaction that includes only E1 contribution. Indeed early attempts to refute this analysis by introducing a non-negligible E2 contribution were shown Gai to arise from a misunderstanding of the RIKEN1 data; hereafter all collaborative experiments are identified by the location of the laboratory where they were performed. Later claims for evidence by the MSU group MSU of non-negligible E2 contribution in inclusive measurement of an asymmetry, were not confirmed in a recent exclusive measurement of a similar asymmetry by the GSI2 collaboration Sch03 .
It was then a great surprise to learn in a recent Physical Review Letter by Esbensen, Bertsch and Snover PRL that higher order terms and an E2 contribution are an important correction to the RIKEN2 data PRL . They quote in their PRL paper PRL statements from the Seattle group Jung03 and indeed the PRL paper is based on these claims Jung03 . We demonstrate that these claims are based on misrepresentation of data and a misunderstanding of the CD method.
II Misrepresentation of data on b-slope parameter
The Seattle group chose to parameterize the astrophysical cross section factor, , as S = a(1+bE), and they show in Fig. 19 of their paper Jung03 the so called ”scale independent slopes (b)” extracted for energies smaller than 425 keV and between 830 - 1300 keV. We first note that excluding the region of the 632 keV resonance is possibly relevant (but not necessary) for Direct Capture (DC) data, but in CD data the contribution of that state is reduced (by a factor of ) and is negligible. For the RIKEN kinematics it is in fact smaller than the quoted error bar. The GSI CD data are quoted with that small contribution already removed and there is no reason to exclude a certain energy region to determine the slope of CD data.
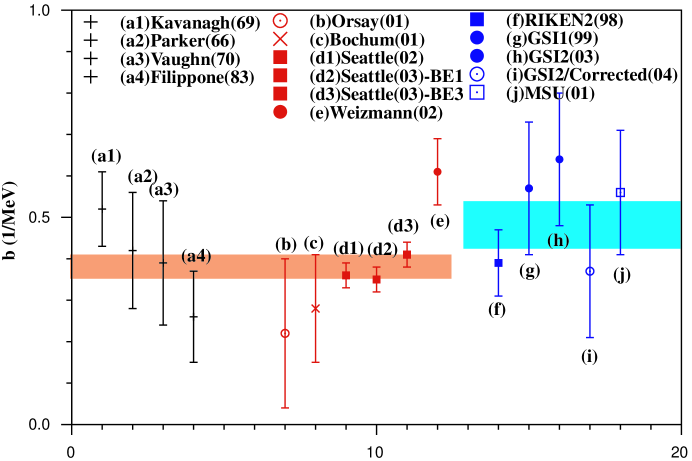
In Fig. 1 we show the b-slope parameter extracted from both DC and CD data in the energy range of 300 - 1400 keV. For the DC data we exclude the same energy region Jung03 due to 632 keV resonance and we subtract its M1 contributions at higher energies. All so obtained fits have an acceptable close to unity. The obtained b-slope parameters agree with Ref. Jung03 , however the so called scale independent b-slope parameter of the RIKEN2 data Kik was plotted incorrectly by the Seattle group in Fig. 19 of their paper Jung03 . It is plotted correctly in Fig. 1, where we also include three DC data points that were omitted by the Seattle group Jung03 , as we discuss below.
A detailed discussion of the difference between the RIKEN2 and GSI1 data was already presented in the literature Sch03 . For example from Fig. 4 of the GSI2 paper Sch03 it is clear that the central value of the slope of the RIKEN2 data is smaller than the central value of the GSI1 data Iw99 , but they are plotted by the Seattle group in Fig. 19 with almost the same central value. We can not explain the origin of this simple mistake of the Seattle group Priv , which in of itself might be of no consequence, except for its relevance for the newly published PRL paper PRL as we discuss below.
Very recently it was also suggested Klaus ; NIC8 that a reanalysis of the GSI2 data may yield a smaller slope for the GSI2 data, as also shown in Fig. 1. This latest analysis has yet to be scrutinized Sch03 and published, none-the-less it is shown here since it was already presented in international meetings Klaus ; NIC8 . But this result Klaus ; NIC8 , as well as all other non published results, are not included in the calculation of the average slope and extrapolated values of CD data.
The published RIKEN2 Kik , GSI1Iw99 , GSI2 Sch03 , and MSU data MSU , yield a 1/ weighted average for the ”b-slope parameter”, b = 0.51 0.06 with = 1.1. With a central value that is slightly smaller than quoted in Ref. Jung03 , b = 0.55 0.08 and = 0.2. The quoted small is due to the wrong value used for the RIKEN2 data in Ref. Jung03 . We also note with much disappointment that the discussed average b-slope parameters Jung03 are a factor of 10 larger than the very same b-slope parameters shown in Fig. 19 Jung03 . The smaller values plotted in Fig. 19 are the correct ones.
In the same figure the Seattle group suggests that a remarkable agreement exists between measured b-slope parameters of DC data Jung03 ; Ham01 ; Str01 ; Weiz ; Fil83 . The DC data shown in Fig. 19 Jung03 does not include all available data. We note that the ”old” data of Filippone Fil83 are included Jung03 , but the data measured by Vaughn et al. Vaughn , Parker Parker , and Kavangh et al. Kav were ignored in their Fig. 19. The last three data sets were deemed Adel not useful at low energies for extrapolating , but they are certainly useful for studying the slope of the data measured at energies between 300 and 1400 keV as done in Fig. 19 of the Seattle group. Most disturbing is the fact that they exclude the published data of Parker Parker and Vaughn et al. Vaughn but included that of Filippone Fil83 . As we show below including these data as well as including the correct value of the RIKEN2 data reduces the claimed disagreement by a factor 2.
III Disagreement Among Direct Capture Data
It is well known that the ”old” data on DC reaction Fil83 ; Vaughn ; Parker ; Kav exhibit major systematic disagreements. But the situation is not improved with ”modern” data on DC Jung03 ; Ham01 ; Str01 ; Weiz . The data of the Orsay group Ham01 and Bochum group Str01 do not agree with that of the Seattle group Jung03 and Weizmann group Weiz . The disagreement is by as much as five sigma and there is not a single measured data point of the Bochum group that agrees with a data point measured by the Seattle group. Most disturbing is the disagreement of the b-slope parameter extracted from the two ”modern” high precision measurements of the Seattle Jung03 and Weizmann Weiz groups, shown in Fig. 19 of Jung03 as well as in Fig. 1 of this paper. From Fig. 19 of Jung03 it is clear that the b-slope parameter of the Orsay Ham01 , Seattle Jung03 and Weizmann Weiz data do not have overlapping error bars. As we show below the, disagreement between the slope parameters is in fact more significant. The slightly better agreement between ”modern” DC data is an artifact of the parametrization used by the Seattle group.
The large systematical disagreement between DC data can not be handled algebraically to extract a meaningful average slope. For example the slopes of the Orsay Ham01 , Seattle Jung03 and Weizmann Weiz shown in Fig. 19 Jung03 can not be all true if the error bars shown in Fig. 19 Jung03 are correct. None-the-less it has been customary to artificially enlarge the error bars by multiplying it by the square root of , so as to make data with systematical differences appear as if it is statistically distributed. Using such a procedure for all published DC data Ham01 ; Str01 ; Weiz ; Fil83 ; Vaughn ; Parker and the BE1 and BE3 data sets of the Seattle group Jung03 we extract a weighted average b-slope parameter, b = 0.38 0.02 with = 1.8. Taking into account the bad as discussed above, we obtain b = 0.38 0.03 as compared to b = 0.311 0.014 and = 1.9, quoted by the Seattle group.
We conclude that the b-slope parameter can not be extracted from DC data with the (impressive) accuracy of 4.5% Jung03 , unless one excludes some of the DC measurements discussed above. An error which is approximately a factor of 2 larger seems like a more reasonable choice. Also a difference of the extracted b-slope parameter of 0.25 quoted by the Seattle group Jung03 is not confirmed in this analysis where we find a difference which is approximately a factor 2 smaller.
The so obtained average b-slope parameters in CD, b = 0.51 0.06 , differs by only 1.9 sigma from that extracted for DC data, b = 0.38 0.03 , and can hardly be characterized as significant. This slight difference is particularly negligible in view of the substantial systematical disagreement among individual data sets measured in DC experiments. Furthermore, it should not be considered sufficient to motivate new theoretical investigation or for that matter a publication in the prestigious Journal of the Physical Review Letters. As we show below the actual differences of measured slopes are even smaller.
IV Lack of Physical Justification of the Seattle Slope Parameterization
We now demonstrate that the parametrization S = a(1 + bE) used by the Seattle group Jung03 has no physical justification. We refer the reader to Baye’s seminal paper Baye on the theory of DC where we find that for an external capture reaction (and only when the conditions for an external capture reaction are satisfied, i.e. below 100 keV):
| = | (equ 1) | ||
| = | (equ 2) | ||
| and, | |||
| = | (equ 3) |
Equation 1-3 were derived for external capture and are correct only when the conditions for external capture are met. Specifically the value of is explicitly negative as predicted for energies below 100 keV. In such a case the logarithmic derivative S’/S(0) is shown to be an invariant Baye .
At energies above 300 keV the observed slope are manifestly positive. For higher energies one must add higher orders beyond the linear term used in equ 1, so as to turn the sign of the slope from negative to positive. For example the Taylor expansion of the theoretical curve predicted by Descouvemont and Baye DB can not be truncated below third order to yield a reasonable representation of the predicted curve at all energies up to 1.5 MeV. Clearly at energies above 300 keV the truncation of the Taylor expansion to a linear term, leads to unphysical expansion.
Furthermore, as we show in Fig. 2 the slope of the d-wave component is essentially constant as a function of energy Jen (approximately +10 eV-b/MeV), but the slope of the s-wave component varies with energy between approximately -20 eV-b/MeV at zero energy to approximately -3 eV-b/MeV at higher energies. The overall slope (S’ = dS/dE) is a sum of the two components which is energy dependent. At very low energies the s-wave negative slope is dominant and is almost constant hence the linear truncation as in equ. 1. At energies above 500 keV the d-wave slope dominates and the variation of the s-wave slope is small leading to almost constant positive slope. At high energies the linear dependent of the S-factor with a positive slope is an artifact of the d/s ratio. But the over all slope at higher energies is dependent on the low energy cut of the data. In particular the fit parameters ”a” used in Jung03 is most sensitive to the choice of the low energy cutoff of the data between 300 and 500 keV, and the so-called scale independent b-slope parameter varies due to the selected range of data and not due to the physical slope (S’).
In equ. 1 the over all normalization factor S(0) is directly related to the astrophysical cross section factor at zero energy, as well as the ANC of the physical wave function Baye . But the fit parameter ”a” used by the Seattle group Jung03 has no physical meaning and is not directly related to the ANC or the spectroscopic factor.
Furthermore, the observed positive slope (S’ = dS/dE) of the cross section factor at energies above 500 keV is directly related to the (model dependent) d-wave contribution designated by d/s ratio Fil83 ; Baye ; Jen ; Hamish ; Barker ; Xu94 . It is self evident that the d/s ratio is independent of S(0), since both d and s components are proportional to the same ANC Baye . Hence it is clear that at energies above 300 keV the slope (S’) is not directly related to the over all normalization S(0) and the so called ”scale independent slope (b)” defined by the Seattle group Jung03 has no physical justification.
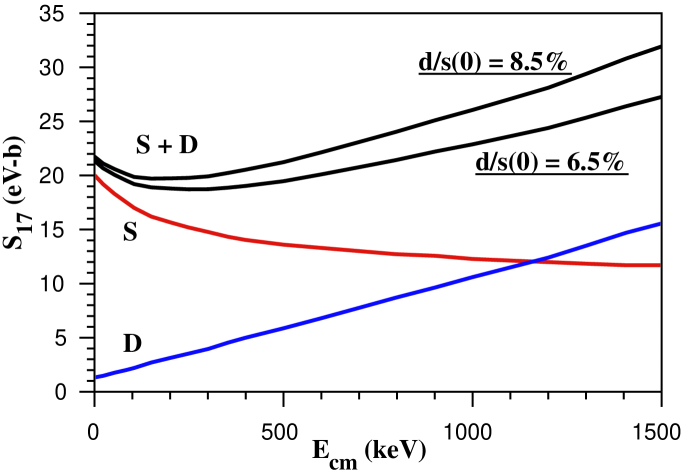
To illustrate this point we show in Fig. 2 the s and d waves contributions calculated by Jennings et al. Jen . In the same figure we show the predicted S-factor with that is increased from 1.3 eV-b Jen to 1.7 eV-b, which is certainly within the limit of accuracy of theoretical predictions. This yield a very insignificant (1.8%) change of S(0) but a very significant change ( 25%) of the observed slope (S’) above 300 keV. This schematic model most vividly demonstrates the fact that the parametrization S = a(1+bE) has no physical justification nor does the assumption that S’/S(0) above 300 keV is an invariant.
We add that a knowledge of the d-wave component at measured energies (e.g. above 300 keV) is essential for extrapolating . For example at 500 keV the d-wave contribution amounts to 30% of the measured and above 1,150 keV it is dominant. At zero energy, on the other hand, the d-wave contribution is predicted to be small (). Thus in order to accurately extrapolate to zero energies one must remove the d-wave contribution from measured , as has been emphasized long ago by Robertson Hamish . This so far has been done by means of theoretical estimate of the d-wave component and a chi-square fit of data by the predicted s + d wave components.
But currently there is no direct way to test the validity of the model dependent prediction of the d-wave component. In fact the slope (S’) seems thus far the only way to determine the d-wave contribution. As we show below the slope has not been measured with high accuracy and large discrepancies still exist between measured DC data. Indeed the ill defined theoretical d/s ratio leads to an uncertainty of the extrapolation. Other theoretical issues were also discussed by Descouvemnot and they yield an uncertainty of at least 6% D , a factor of 2 larger than the theoretical uncertainty quoted by in Ref. Jung03 .
V The Slope S’
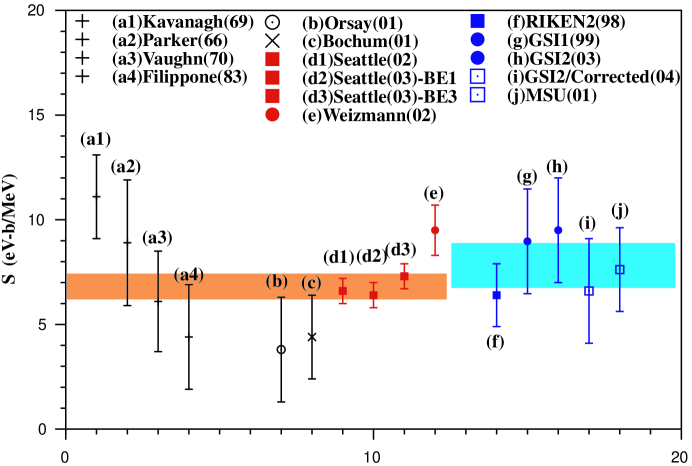
For that reason we plot in Fig. 3 the extracted slope S’ = dS/dE for data measured between 300 and 1400 keV, with the same exclusion of DC data due to 632 keV resonance between 450 and 850 keV, and correcting for the M1 contribution of that resonance above 850 KeV as discussed in section II. Figure 3 includes all published data and the slope of the RIKEN2 data is plotted correctly. In this figure we note a sharper disagreement between ”modern” DC data. In particular we extract three different slopes values for the four ”modern” experiments on DC: a Bochum-Orsay low value Ham01 ; Str01 , an average of the three Seattle results Jung03 and the Weizmann higher value. Weiz . These three values of ”modern” DC slopes do not exhibit overlapping error bars. In sharp contrast all four published CD slopes shown in Fig. 3 are in agreement within the quoted error bars.
From these data we extract for CD data the 1/ weighted average S’ = 7.9 1.0 eV-b/MeV with = 0.5 and for DC data S’ = 6.7 0.5 eV-b/MeV with = 1.5, hence S’ = 6.7 0.6 eV-b/MeV. Clearly the average slope extracted in CD data agrees (within 1.0 sigma) with that extracted from DC data. This agreement is considerably better than observed between individual DC measurements, as we discuss above.
We conclude that there is no significant disagreement between slopes extracted from CD and DC data. This removes the very raison d’etre for the recent PRL paper PRL .
VI Comparison of RIKEN2 Data with Theory of Esbensen, Bertsch and Snover
Furthermore, in this PRL paper PRL we find a substantial (50%) correction of the b-slope parameter extracted for the RIKEN2 data that is implied to be 0.25 . As we discuss above the b-slope parameter was computed incorrectly by the Seattle group, as shown in their Fig. 19 Jung03 . For the RIKEN2 data b = 0.39 0.08 , and the said correction yields: b = 0.14 0.08 which is considerably (more than a factor of 2) smaller than the observed central value for DC data, b = 0.38 0.03 . We conclude that the corrections suggested by Esbensen, Bertsch and Snover, in sharp contrast to the claim PRL , in fact lead to a disagreement between the RIKEN2 data and DC data, and are not relevant at least for the RIKEN2 data, and in particular they once again confirm that the E2 correction is negligible.
VII Extracted From CD Data
In Fig. 20 of the Seattle paper Jung03 they show extracted from CD using the extrapolation procedure of Descouvemont and Baye DB , and based on this analysis it is stated PRL that ”the zero-energy extrapolated values inferred from CD measurements are, on the average 10% lower than the mean of modern direct measurements”. The extracted shown in Fig. 20 Jung03 are only from data measured at energies below 425 keV and the majority of CD data points that were measured above 425 keV were excluded in Fig. 20 Jung03 .
This arbitrary exclusion of (CD) data above 425 keV has no physical justification. For example as shown by Descouvemont D the theoretical error increases to approximately 5% at 500 keV and in fact it is slightly decreased up to approximately 1.0 MeV, and there is no theoretical justification for excluding data between 500 keV and 1.0 MeV. In DC measurements the well known contribution of the 632 keV resonance needs to be subtracted, but that is not the case for example in RIKEN CD data. Furthermore, as we discussed above, the slope of the data between 300 and 1,400 keV is essential for determining the d/s ratio and the extrapolation to zero energy. Excluding data above 425 keV reduces our sensitivity for testing the various model prediction of the d/s ratio.
When including CD data measured only at energies below 425 one runs into a more serious systematical problem. Namely, the relative energy measured in CD () is determined mostly from the proton- relative angle (). At small relative energies (as well as at small scattering angles, ) plural scattering in the target are of major concern. These are estimated theoretically and are known to be inaccurate. The effect of plural scattering in the target is indeed known for practitioners in the field of CD and has been discussed on several occasions. It leads to a systematical uncertainty of the measured of the order of 2 eV-b.
Furthermore, the yield of the CD of arises from a convolution of the nuclear cross section which is rapidly dropping toward low energies, and the virtual photon flux that is rapidly increasing toward low energies. This generate a yield that is almost constant (20%) at = 300 - 800 keV. Note that over the same energy range the DC yield changes by almost a factor of 10.
Thus when excluding the CD data above 425 keV, the Seattle group excluded the data that were measured with the best accuracy and with smallest systematical uncertainty. This exclusion of ”the best energy region” measured in CD experiment is a manifestation of their misunderstanding of the CD method. If in fact one insists on such a flawed analysis of CD data, one must estimate the systematic uncertainty due to this selection of data. This has not been done in the Seattle re-analyses of CD data Jung03 .
Instead we rely here on the original analyses of the authors. In Fig. 4 we show the factors extracted by the original authors who performed the CD experiments. These results include all measured data points, and are consistently analyzed with the extrapolation procedure of Descouvemont and Baye DB . The potential model of Typel Sch03 was also used in the GSI2 paper, but the so quoted are not shown in Fig. 4.
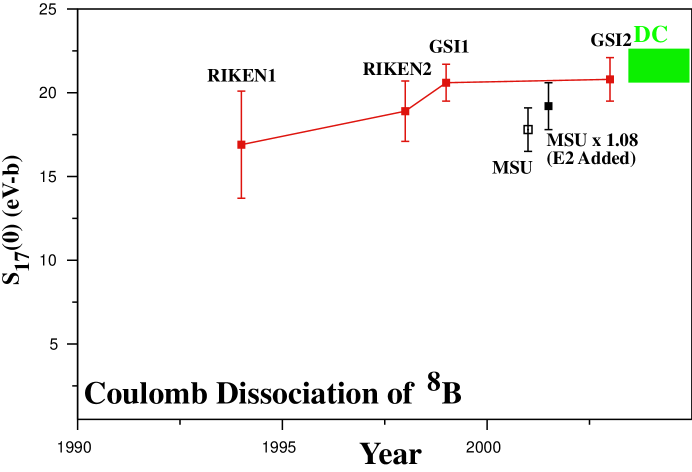
We note that the five experiments on the CD of Mot94 ; Kik ; Iw99 ; Sch03 ; MSU show a remarkably good agreement within the quoted error bars, in sharp contrast to the confusion that exists in ”old” Fil83 ; Vaughn ; Parker ; Kav and ”modern” DC results Jung03 ; Ham01 ; Str01 ; Weiz . The results of the RIKEN-GSI experiments must be considered as a continuation of the same experiment (essentially the same experiment repeated four times) with an improved kinematical and experimental conditions. Thus the four results can not all be assigned the same weight.
We note that while these four results are consistent within the quoted error bar, they show a systematic trend of an increased (to approximately 20.7 eV-b), while the error bars are reduced. The MSU result on the other hand includes a model dependent E2 correction () deduced from inclusive experiments MSU , which was not confirmed in a recent exclusive measurement of a similar asymmetry Sch03 . When this E2 correction is added back to the quoted MSU result MSU , as shown in Fig. 4, together with the published RIKEN2 Kik , GSI1 Iw99 , and GSI2 Sch03 results we obtain a 1/ weighted average of = 20.0 0.7 with = 0.5, which is in excellent agreement with the measurement of the Weizmann group Weiz and in agreement with the measurement of the Seattle group Jung03 .
We conclude that the statements (which were repeated in the literature) on substantial differences between data from DC and CD measurements as well as extracted are based on misrepresentation of data, misunderstanding of theory and a biassed approach of the Seattle group Jung03 . Quite to the contrary we find a good agreement among CD measurements as well as an agreement of the CD results with the two most recent high precision results of DC experiments. Further attention must be given to an accurate measurement of the slope (S’) and the d-wave contribution to measured at energies above 300 keV so as to allow accurate extrapolation to zero energy.
References
- (1) G. Baur, C.A. Bertulani, and H. Rebel; Nucl. Phys. A458(1986)188.
- (2) T. Motobayashi et al.; Phys. Rev. Lett. 73(1994)2680.
- (3) T. Kikuchi et al.; Phys. Lett. B391(1997)261, ibid E. Phys. J. A3(1998)213.
- (4) N. Iwasa et al.; Phys. Rev. Lett. 83(1999)2910.
- (5) F. Schumann et al.; Phys. Rev. Lett. 90(2003)232501.
- (6) M. Gai and C.A. Bertulani; Phys. Rev. C52(1995)1706.
- (7) B.S. Davids et al.; Phy. Rev. 63(2001)065806.
- (8) H. Esbensen, G.F. Bertsch, and K. Snover; Phys. Rev. Lett. 94(2005)042502.
- (9) A.R. Junghans et al.; Phys. Rev. C68(2003)065803.
- (10) K. Suemmerer, contribution, Advances and Challenges in Nuclear Astrophysics, ECT* Workshop, May 24-28, 2004, Trento.
- (11) F. Schumann for the GSI S223 Experiment, contribution, Nuclei in the Cosmos 8, Vancouver, July 19-24, 2004.
- (12) Requests including a copy of Fig. 4 of Sch03 sent to the lead author (Dr. Snover) to correct this mistake were ignored, as was a request to receive the numerical values of data and the resultant ”a” and ”b” fit parameters. A recent linear fit by Dr. Bertsch of the RIKEN2 data yields b-slope parameter that is considerably smaller than plotted in Fig. 19 of Jung03 .
- (13) F. Hammache et al.; Phys. Rev. Lett. 86(2001)3985.
- (14) F. Strieder et al.; Nucl. Phys. A696(2001)219.
- (15) L.T. Baby Phys. Rev. C67(2003)065805, ER C69(2004)019902(E).
- (16) B.W. Filippone et al.; Phys. Rev. C28(1983)2222.
- (17) F.J. Vaughn et al., Phys. Rev. C2(1970)1657.
- (18) P.D. Parker, Phys. Rev. 150(1966)851.
- (19) R.W. Kavanagh, T.A. Tombrello, T.A. Mosher, and D.R. Goosman, Bull. Amer. Phys. Soc., 14(1969)1209.
- (20) E.G. Adelberger et al.; Rev. of Modern Phys. 70(1998)1265.
- (21) D. Baye; Phys. Rev. C62(2000)065803.
- (22) P. Descouvemont and D. Baye; Nucl. Phys. A567(1994)341.
- (23) B.K. Jennings, S. Karataglidis, and T.D. Shoppa; Phys. Rev. C58(1998)3711.
- (24) R.G.H. Robertson; Phys. Rev. C7(1973)543.
- (25) F.C. Barker; Aust. Jour. Phys. 33(1980)177.
- (26) H.M. Xu et al.; Phys. Rev. Lett. 73(1994)2027.
- (27) P. Descouvemont; Phys. Rev. C70(2004)065802.