The Cryogenic Target for the G0 Experiment at Jefferson Lab
Abstract
A cryogenic horizontal single loop target has been designed, built, tested and operated for the G0 experiment in Hall C at Jefferson Lab. The target cell is 20 cm long, the loop volume is 6.5 l and the target operates with the cryogenic pump fully immersed in the fluid. The target has been designed to operate at 30 Hz rotational pump speed with either liquid hydrogen or liquid deuterium. The high power heat exchanger is able to remove 1000 W of heat from the liquid hydrogen, while the nominal electron beam with current of 40 A and energy of 3 GeV deposits about 320 W of heat into the liquid. The increase in the systematic uncertainty due to the liquid hydrogen target is negligible on the scale of a parity violation experiment. The global normalized yield reduction for 40 A beam is about 1.5 and the target density fluctuations contribute less than 238 ppm (parts per million) to the total asymmetry width, typically about 1200 ppm, in a Q2 bin.
keywords:
Liquid hydrogen target, unpolarized targets , Density variations , Parity violationPACS:
29.25.-t , 25.30.Bf, , , , , , , , , , ††thanks: iThemba Labs, PO Box 722, Somerset West, South Africa ,
1 Introduction
In the G0 experiment [1] in Hall C at Jefferson Lab, the parity-violating (PV) asymmetry in elastic electron scattering from hydrogen and quasi-elastic electron scattering from deuterium is measured in the Q2 range from 0.1 to 1 (GeV/c)2 in both forward and backward angle modes by scattering a longitudinally polarized electron beam on unpolarized liquid targets. By measuring three independent asymmetries, one at forward angles on liquid hydrogen and two at backward angles, one on liquid hydrogen and one on liquid deuterium, a complete separation and mapping of the strange vector form factors of the nucleon (G, G) and the isovector axial form factor (G) in three Q2 bins over the Q2 range from 0.1 to 1 (GeV/c)2 can be performed for the first time. In the forward angle mode the particle detected is the proton, while in the backward angle mode the particle detected is the electron.
The measured PV asymmetries are in the range of 1 to 3010-6, with the intended contribution from systematic uncertainties of less than 5 of the measured asymmetry. In order to make the physics program possible the target system must accommodate large power depositions into the liquid with the minimum possible systematic uncertainties due to global yield reduction and density fluctuations on the time scale of 30 Hz of the asymmetry measurement.
The target is inside the vacuum enclosure of a superconducting magnet system (SMS) [1], which poses several challenges. The target had to be designed to fit inside a cylindrical volume with a 60.96 cm diameter (this being the space constraint imposed by the magnet’s inner core). The target system must be reliable during several months continuous operation, and should have no interferences with the toroidal magnetic field.
In order to accomplish this ambitious experimental program a recirculating closed loop high power cryogenic target system has been designed, built, thoroughly tested, installed and operated. In order to meet the space constraints the cryogenic loop is placed horizontally inside the SMS and is fed horizontally with gases. The electron beam interacts with the target fluid in the target cell and the cryogenic fluid circulates in a high speed flow in the horizontal loop. The nominal beam spot on target is a square of side 2 mm. The target provides a cylindrical clearance for the beam with a diameter of roughly 12.7 mm. The cryogenic loop has 2 degrees of freedom in a plane perpendicular to the beam line and no degree of freedom along the beam line.
The remainder of this paper is organized as follows: section 2 provides a detailed description of the target system, section 3 contains the tests carried out on the target with and without beam, and section 4 is a summary of operational experience with beam on target and a summary of measured target parameters.
2 The target system
The major components of the target system are: the cryogenic loop, the service system and the controls.
2.1 Cryogenic loop
The cryogenic loop, as shown in fig. 1, can be divided into several units: the cryogenic pump housing, the heat exchanger housing, the target manifold and the bellows. The target manifold is the only unit made of Al. The shell of the rest of the loop is made of Type 304 stainless steel.
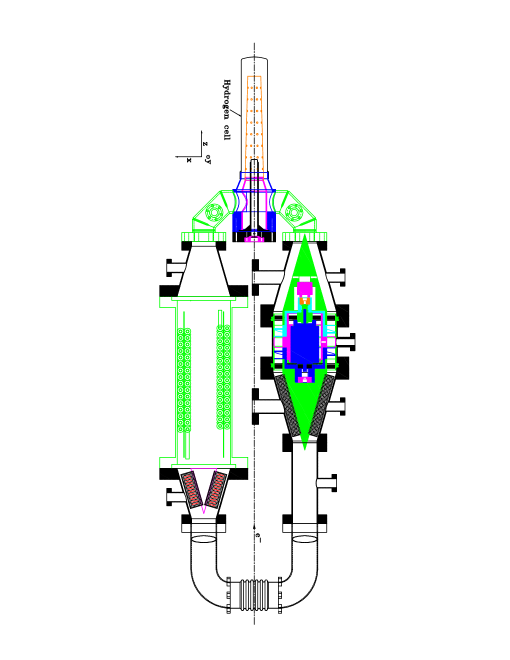
During normal running the loop is placed horizontally inside the superconducting magnet, in the same plane as the beam line. The orientation of the loop with respect to the direction of the beam line is with the target cell placed downstream. To ensure safe beam operation on target, the upstream part of the loop goes below the horizontal plane and contains a bellows that connects the two sides of the loop below the beam plane (see fig. 4). Except for the upstream bellows all loop parts are rigidly interconnected. The bellows reduces the mechanical stress due to the rigid connections along the loop. Once the loop is put together, the bellows is clamped in place and the whole cryogenic loop becomes a rigid structure.
2.1.1 The target manifold
The target manifold, shown in fig. 2, is completely made of Al-6061 T6 and connects with the loop through transition stainless-Al conflat flanges. All loop units are connected through conflat flanges with Cu gaskets, rated for high vacuum (10-11 Torr) well beyond that needed in the experiment (the vacuum is nominally around 10-6 Torr during normal operations).
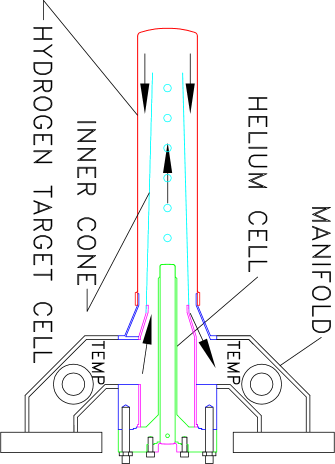
The target manifold houses two cells, a primary hydrogen cell and a secondary helium cell. The primary cell is a thin shell cylinder, about 23 cm long, soldered to an Al joint downstream of the manifold. The cell was machined in one piece from Al-6061 T6 with an outer shell thickness of 0.178 mm and an internal diameter of 5 cm. The helium cell is 16 cm long and is placed upstream of the primary hydrogen cell. The helium cell is a cylindrical tube machined in one piece on a flange that connects to the manifold through an indium seal. Its inner diameter is 12.7 mm, which defines the clearance volume for the electron beam. The tube of the helium cell has a nipple soldered at the downstream end. The nipple is machined in one piece and has a thin window of 0.228 mm thickness. At the upstream end, the helium cell is protected against vacuum by an Al thin window, 0.178 mm thick, machined on an Al flange that connects to the helium cell flange through an indium seal. The helium cell is operated at the same pressure as the hydrogen cell. There are three thin Al windows in beam. The distance between the exit window of the helium cell and the exit window of the hydrogen cell is 20 cm and defines the liquid hydrogen target in beam. Nominal running conditions with liquid hydrogen are 1.7 atm and 19 K, 3 K below its boiling point. With these conditions, the target thickness in beam is 1.44 g/cm2, yielding luminosities in excess of 21038 cm-2s-1.
There are two particular reasons for having the helium cell. The exit window of the helium cell has the same shape and radius of curvature as the exit window of the hydrogen cell. The thin exit window of the hydrogen cell has a spherically convex shape with a radius of curvature of 7.6 cm. Hence, systematic effects caused by parallel beam drifts on target are reduced to first order. Another feature of the helium cell design is that it provides azimuthal symmetry for scattered particles, originating in the hydrogen target, in the range of the angular acceptance of the SMS.
2.1.2 The heat exchanger
One of the cryogenic loop’s legs houses a double coil counterflow high power heat exchanger. The coils are made of finned Cu tubing on the hydrogen side to increase the area for heat exchange. The heat exchanger uses cold helium gas as coolant agent, from Jefferson Lab’s End Station Refrigerator (ESR), with nominal parameters of 15 K and 12 atm. The heat removal is on average 50 W for a coolant flow of 1 g/s. The inner space of the heat exchanger’s coils is filled with an Al flow diverter (not shown in fig. 1) that forces the target fluid to go through the fins. The area for heat exchange on the hydrogen side is 9500.73 cm2, and on the coolant side is 1110 cm2. The effective diameter for flow in the hydrogen circuit is 30.4 cm2 and 0.338 cm2 on the coolant side.
2.1.3 Cryogenic pump
The other leg of the cryogenic loop houses the cryogenic pump and the high power heater (HPH). The pump is a vane-axial design with two impellers in series. The impellers have three blades each and are rigidly attached on a motor shaft that is immersed into the cryogenic fluid. The volume dislodged by the pump in one revolution, corrected for the volume of the blades, is 0.198 l. The cryogenic motor that is presently in use is a Barber-Nichols Inc. custom DC brushless sensorless motor, driven by a sensorless controller. The motor is rated for liquid hydrogen and has a 12.7 mm diameter shaft. Downstream from the pump there is a conical Al-made flow diverter inside which there is a tachometer. The tachometer is completely separate from the pump system. It is made of a Cu coil rigidly attached to the Al flow diverter. The downstream pump impeller has a permanent small field magnet dipole rigidly attached to it. When the impeller rotates the varying magnetic flux through the coil, caused by the magnet, induces a varying electric field with the same frequency as the rotational frequency of the impeller and offers a measure of the motor’s rotation that is independent of the motor’s controller. The tachometer signal is read back by a digital multimeter enabled in frequency mode (Agilent model 34401A).
Upstream of the pump there is a second conical flow diverter made of Al that houses the HPH. The purpose of the HPH is to regulate the heat load on the target in a feedback loop during normal operations. The HPH is made of three independent coils wrapped on a G10 support, connected in parallel at the back of the power supply. In this configuration, in case one of the coils becomes inoperable, it doesn’t incapacitate the whole heater. A reconfiguration of the remaining coils at the back of the power supply will enable its continual operation. The coils are made of Ni-Cr alloy ribbon and each has a resistance of about 3.5 , giving a total resistance of 1.15 . The HPH power supply, PowerTen 3300P/4025, is operated remotely with two low-voltage dc control signals (0-10 V = 0-100 ) that are set by analog output channels from a VME board.
There are flow diverters inside the cryogenic loop, all made of Al-6061. The purpose of the flow diverters is to guide the fluid smoothly around the loop and assure a high Reynolds number in the target cell and heat exchanger, where turbulence facilitates heat transfer or heat removal and mixing. In addition to the flow diverters along the loop, inside the target cell there is a conical tube made of Al-1100, of 0.0762 mm thickness (see fig. 2). The tube acts as a flow diverter and guides the liquid down the center of the target cell serving two purposes. The conical geometry increases the flow speed as it traverses the cell parallel to the beam direction, increasing the turbulence and mixing of the fluid. The conical tube has holes on the side that run along the surface. The holes allow the fluid to leave the interaction region before reaching the end of the cell, helping to remove heated fluid from the beam path sooner and reducing the intrinsic interaction time between the beam and the fluid. The holes also serve a mechanical purpose, they prevent the conical tube tearing by relieving the static pressure on the inside of the conical tube. The holes sit in the shadows of the superconducting magnet coils, and thus do not influence the scattered particles within the experimental acceptance.
With the exception of the cryogenic motor rotor, all materials used in the fabrication and assembly of the target cryogenic loop are either low magnetic susceptibility or non-magnetic materials. The rotor of the cryogenic motor is made of strong permanent rare-earth magnets with fields at the surface in excess of 1 kGauss, which decay quickly with radial distance. The motor axis sits about 10 cm off the central beam axis in the horizontal plane, with the center of the motor about 46 cm from the center of the target cell. Measurements of motor’s magnetic field done with Hall probes found that the magnetic field half way between the bearings and 5 cm from the rotor’s axis of revolution is less than 7 Gauss. At 10 cm the field is less than 1 Gauss. The field along the rotor’s axis of revolution is 1.5 Gauss at one bearing and less than 1 Gauss at the other bearing. The magnetic field integral along a particle’s trajectory changes the nominal field integral of the SMS by about 0.01 ppm, which is negligible for this measurement.
2.1.4 Instrumentation
Along the cryogenic loop there are eight electrical feedthroughs with mini-conflat flanges used for instrumenting six temperature sensors directly into the fluid, the tachometer, the heaters and the cryogenic motor. The six temperature sensors used on the loop are LakeShore Cernox CX-1070-AA. An additional set of temperature sensors of the same kind were instrumented in the helium coolant lines with two sensors right across the heat exchanger to monitor the coolant temperature to and from the target. The temperature sensors are read by Oxford ITC-502 temperature controllers. The temperature sensors are distributed along the cryogenic loop in pairs, two across the pump and HPH, two across the target manifold and two across the heat exchanger. The electrical lines from the loop go through a second set of feedthroughs on the service module to the G0 electronics racks in the hall. The cables are about 42 m long and made of Kapton insulated Cu. As an extra precaution the wires under vacuum have been shielded with 4-channels ceramic beads. The beads are radiation and fire resistant.
2.2 The service system
The service system for the target is split in two major components, the mechanical service module, that supports and moves the target, and the gas handling system.
2.2.1 The gas handling system
Fig. 3 shows a schematic of the gas handling system (the dashed line is the Hall C boundary), consisting of gas service lines, a gas panel and a ballast tank.

The external coolant supply lines are vacuum insulated coaxial pipes. The coolant comes from the 15 K - 12 atm cold helium supply at the ESR. The flow needed to extract heat loads of up to 500 W on the target is less than 14 g/s. The coolant flow to the target’s heat exchanger is controlled by a needle valve, which is manually operated.
The gas panel sits in experimental Hall C and its primary purpose is to supply the cryogenic loop with gases. It supplies both cells in the cryogenic loop from dual supplies (the hydrogen cell can be supplied with gas from a bottle in the hall or from a ballast tank outside the hall; the helium cell can be supplied with helium from bottles in the hall or from a 4 atm source of high purity helium). In addition to supplying gases to the two cells in the cryogenic loop, the gas panel connects the hydrogen cell to adequate relief paths for excessive pressure, either to the ballast tank or to the hall’s standard dry nitrogen vent. The panel’s functions are possible through a combination of manual, pneumatic, solenoid, check and relief valves. On the gas panel there are 2 pneumatic valves controlled by a vacuum interlock box. The interlock box prevents the operation of these valves unless there is sufficient vacuum in the magnet’s vessel. One pneumatic valve connects the gas panel with a pumping station, the other one connects the gas panel with the ballast tank during normal running. The interlock box prevents pumping on the cryogenic loop unless adequate vacuum is established in the magnet’s vessel, hence protecting the thin hydrogen cell against implosion. In case of a vacuum breach in the magnet vessel, the interlock box also closes the connection between the ballast tank and the cryogenic loop, reducing the inventory of hydrogen (deuterium) that might come in contact with air. There are three relief paths in parallel on the gas panel two instrumented with relief valves that open at 25 and 30 psig respectively, and one with a rupture disk that breaks at 41.1 psig.
The gas panel is instrumented with pressure gauges for direct reading of pressures in the system and with pressure transducers for remote monitoring of pressures. The transducers, made by Omega, are of three varieties, one absolute with range from 0 to 100 psi, another one absolute with a range from 0 to 3000 psi, and one differential with a range from -15 to 15 psid. The differential transducers are used to read the pressure across the exit window of the helium cell and the pump head.
All the components on the gas panel are either explosion proof or rated for hydrogen. To prevent accidental remote operation all the components of the gas handling system can only be monitored from a computer.
In the normal mode of operation, before a run starts, the cryogenic loop and the helium cell are pumped and purged several times (following [5]) with helium before the running fluids are made available to the target. Before cool-down starts, the cryogenic loop is put in connection with the ballast tank and will stay connected to it at all times during a run, unless a vacuum incident triggers the vacuum interlock box to close the connection. The ballast tank acts as a big pressure reservoir and mitigates pressure excursions in the target during normal running. The ballast tank is also a storage reservoir for target fluid (hydrogen or deuterium), it has a volume of 2500 gallons. As a safety precaution, some critical valves in the gas delivery system for the target are locked and only target experts have access to them.
2.2.2 The service module
The target’s service module (SM) has been manufactured by Thermionics NW. The basic functions of the SM are to support the cryogenic loop, to provide motion control along two axes perpendicular to the beam axis and to

provide an interface for gas lines and electrical lines from vacuum to the outside world. A schematic view of the SM can be seen in fig. 4, along with the functionality of the associated motion system. The cryogenic loop is rigidly supported inside the SMS on a cantilevered platform from the SM. The cantilever is moved by four linear actuators through ball joints. The actuators are placed in pairs in two vertical planes at different locations along the beam axis. With these degrees of freedom the target can be placed in position, aligned to the magnet-beam axis to better than 1 mm in both x and y directions (the nominal reference system has the z axis along the beam line with positive sense down the line, the y axis is vertical with positive sense up, and the x axis is horizontal in-plane with positive sense to beam right). The actual location precision of the motion system along a single axis is 0.05 mm, and for two axes combined it should position the target to better than 0.1 mm.
The SM is located on the beamline upstream of the SMS. It interfaces with the SMS through a 60.96 cm diameter flange and with the beamline through a 15.24 cm gate valve. The SM cannot be separated from the SMS without breaking the vacuum, but it can be separated from the beamline with the gate valve. The target cell can be moved about 7.6 cm vertically and about 2.5 cm horizontally. In the vertical direction the target has an out of beam position with 2.5 cm clearance for beam. To protect the target from hitting the inner bore of the SMS, under any circumstances, the motion system is instrumented with limit switches arranged on a ring around the beam axis. Once a switch hits a wall the motion in that direction is blocked and only retraction is possible.
2.3 Target controls
The target controls system [4] is a set of electronics, computers and software used to monitor, operate and control the target. The main functions of the controls system are monitoring target parameters, warn the operator of critical conditions, log target data at regular intervals, provide selected target data to the online data acquisition system, control the target heaters to ensure target stability and move the target along two axes perpendicular to the beam axis (the target system has no degree of freedom along the beam line). The controls for this target have been described in detail in [3]. The monitoring and controlling electronics sit in two electronics racks in the hall, shielded from direct radiation from the target. The signals are centralized in the hall into an Input-Output Controller (IOC) that is located in a VME crate in a rack in the hall. The VME processor is a mv2700 power PC. The analog input and output to the IOC is done through Greenspring ADIO modules. The IOC is also able to process data from serial ports. Information from the IOC is shipped through the local Ethernet to a monitoring computer located in the Hall C Counting House. This computer is the monitoring and control station for target parameters during normal running and is operated by a trained target operator. All the target monitoring and controlling electronics are on Uninterruptible Power Supplies (UPS) to ensure safe monitoring and controlling of the target system in case of a power failure. The target data are part of the larger EPICS database at Jefferson Lab. The operation of the target is carried out through a combination of software, and hardware. The cryogenic pump speed is controlled only through a linear potentiometer, and not via computer, in order to avoid interruption of the pump’s rotation due to IOC and/or computer crashes.
The HPH is primarily controlled through a Proportional-Integral-Differential (PID) feedback loop with a temperature sensor in the cryogenic loop. In our implementation of the PID loop the feedback tracks the beam current incident on the target and subtracts the deposited beam power from the total power on the target, setting the rest on the heater and keeping a temperature sensor constant. This helps stabilize the target quicker with less than 0.2 K temperature excursions during beam trips. A parallel complete manual control of the HPH is used for situations when the IOC feedback loop is nonoperational (due to network failures or IOC crashes). All other target parameters, besides pump speed, gas panel and sometimes the HPH, are controlled through the IOC. All target parameters are monitored through the IOC on the target computer screen. The target controls system is based on EPICS 111http://www.aps.anl.gov/epics and MEDM 222http://www.aps.anl.gov/epics/extensions/medm.
3 Target tests and performance
There are two principles at the base of our testing program, safety and performance. The target had been very throughly tested in order to be certified as safe, since it operates explosive gases (hydrogen and deuterium). The target design performance needed to be demonstrated before installing it in the experimental hall. The preliminary target checks and tests included mechanical integrity tests (pressure tests, leak checks etc.) and performance tests with cold helium gas in the cryogenic loop.
3.1 Pre-beam tests
The purpose of the pre-beam tests were to assess the target overall dynamical performance, safe operation and reliability. These tests were split into three different sets: cold helium tests, liquid neon test and liquid hydrogen tests.
3.1.1 Cold helium performance
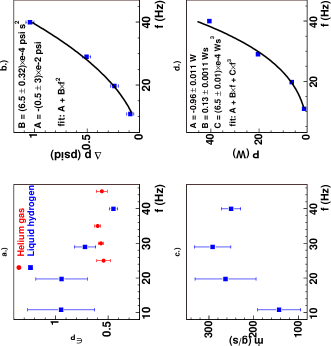
In the Test Lab at Jefferson Lab the target was tested for the first time in cryogenic conditions by using helium coolant (4 K / 3 atm at maximum 5 g/s) delivered by the Cryogenic Test Facility (CTF) refrigerator and helium gas as target fluid in the cryogenic loop. The cold helium tests were meant primarily to assess the cryogenic pump performance and the operation of the target’s instrumentation. During the period of these cold helium tests the target has been filled with the coldest cryogen to date, 7 K / 20 psig helium gas (about a quarter of the pump load expected with liquid hydrogen). The pump efficiency, eq. 2, and mass flow, eq. 1, can be determined by measuring the fluid temperature increase as it goes across a known heat source [3], which in this case is the HPH. In this approach helium is better than hydrogen as it yields larger temperature differences for the same heat load than hydrogen and the pump efficiency is measured with better precision. However, the cold helium is in gaseous state and is compressible as opposed to hydrogen which would be liquid and incompressible (see fig. 5a for a comparison of the measured pump efficiency between helium and hydrogen). The heat exchanger was also tested for heat transfer performance. The coolant used in the Test Lab differs significantly from the one in the Hall (CTF delivers cold helium at 4 K / 3 atm, while the ESR delivers cold helium at 15 K / 12 atm). In these conditions the heat exchanger removed in excess of 500 W of heat loads from the target’s fluid.
The cryogenic pump geometry has been designed to insure high speed fluid flow at a nominal rotational frequency of 30 Hz. Ample fluid flow is necessary in order to reduce target density related effects and mitigate systematic errors in the asymmetry measurements. To sustain the fluid flow needed it was determined, after a set of initial tests, that a high torque custom motor was necessary for powering the cryogenic pump. The Barber & Nichols motor proved to have the desired performance and is the motor presently powering our cryogenic pump. Although it runs with no problems at 30 Hz in liquid hydrogen, it saturates in current at about 42.7 Hz and it may be just marginal for reaching 30 Hz in liquid deuterium.
3.1.2 The neon test
The target cells have been pressure tested to 85 psid. The estimate for maximum cell pressure in case of a liquid hydrogen catastrophic boil-off (the most serious scenario was considered to be the sudden loss of vacuum in the magnet vessel to room temperature air) was 29 psia with the designed venting lines. To test the design of the relief system for the cryogenic target a simulated loss of vacuum was performed using neon as target fluid and dry room temperature nitrogen as . Neon has several qualities which make it suitable for such a test. It is inert, it has a liquefaction point close to hydrogen (28.98 K for neon and 22.21 K for hydrogen at 1.7 atm - the pressure for normal running conditions in the target), and is much denser than liquid hydrogen. The fact that the liquefaction points are close for the two fluids makes temperature differences from liquid state to room temperature to be similar for the two fluids, an important consideration when simulating loss of vacuum to room temperature air. Because liquid neon is 17 times denser than liquid hydrogen, the expected pressure peak in a vacuum loss was 38 psia, a 30% increase compared with hydrogen. The length in time expected for the neon peak pressure to last is more than double the peak pressure time length expected for a catastrophic boiling of liquid hydrogen. For this test the target was mounted on the SMS and it successfully passed the neon test, in situ. The cryogenic motor was able to push liquid neon in the cryogenic loop saturating in frequency at 12.2 Hz, the saturation in torque, eq. 3, was determined to be about 23 oz-in (the same torque limit reached with liquid hydrogen at 42.7 Hz).
3.1.3 Liquid hydrogen performance
For a week in early June 2002, the target underwent basically the same set of tests it did with cold helium, this time with liquid hydrogen.
As outlined in Section 3.1.1, the pump flow can be determined by measuring the temperature difference of the fluid as it passes across a known heat source:
| (1) |
where , in our case, is the power delivered by the high power heater power supply and is the power deposited by the HPH into the loop. The parameter accounts for the power loss in the electrical supply cables. The logged parameter was the power delivered by the power supply. To get the power deposited into the loop, was determined to be 0.75.
Data were taken at four different cryogenic pump rotational frequencies: 10, 20, 30 and 40 Hz, and at six different heater power values: 550, 450, 350, 250, 150 and 50 W for each frequency. The specific isobaric heat and density for liquid hydrogen were corrected for temperature dependence. Since the pressure stayed the same during these studies, there were no pressure related corrections to the input hydrogen parameters. At each power value the data included in the computation of the mass rate were the closest to the thermodynamic equilibrium. With these data the pump efficiency can be determined using the relation
| (2) |
where is the theoretical volume displacement of the cryogenic pump in one revolution. The cryogenic pump has two identical impellers, each equipped with three blades. The estimate for , taking into account the volume of the blades, is 0.198 liters. The rotational frequency of the cryogenic motor shaft is denoted by f. The motor frequency was measured with the tachometer. The temperature was measured with the temperature sensors instrumented along the loop. The temperature across the HPH is denoted by , where indexes mean pump-out and pump-in, respectively.
With the differential pressure across the cryogenic pump one can determine the torque of the cryogenic motor at different frequencies. The relation between torque and pressure is
| (3) |
and the mechanical power delivered by the cryogenic pump can be determined from the data with the relation
| (4) |
For a counterflow heat exchanger, like the one used in G0, the log mean temperature difference [6] is given by
| (5) |
and the heat exchanger coefficient is given by
| (6) |
where Thi is the temperature of the liquid hydrogen going into the heat exchanger and Tco is the temperature of the helium coolant coming out of the heat exchanger, for example. During the heat exchanger studies the coolant mass flow as read from the ESR flow-meter for the 15 K supply for Hall C never exceeded 10.5 g/s. As in the pump studies was determined for four cryogenic pump frequencies and six setpoints for the high power heater.
To characterize the heat exchanger further its effectiveness has been determined, which for a counter flow heat exchanger is defined theoretically [6] as
| (7) |
where R is the heat capacity rate ratio, and N is the number of heat transfer units, defined as
where min/max refer to the helium coolant or hydrogen liquid, . Physically it represents the ratio between the actual rate of heat transfer in the heat exchanger and the maximum allowable rate by the second law of thermodynamics. Experimentally the value of the effectiveness is given by
| (8) |
3.1.4 Results and comments
The cryogenic pump efficiency, fig. 5a, and flow measurements, fig. 5c, in the loop have large uncertainties due to the small temperature differences in hydrogen that can be induced across the HPH (on average about only four times the systematic calibration error of 25 mK). Data from the two lowest heater setpoints (50 and 150 W) have been excluded in averaging the pump efficiency and mass rate. With the present controller the cryogenic pump saturated in current at 42.7 Hz. At the saturation torque, of 23 ozin, the cryogenic pump head was 1 psid, and the mechanical power delivered to the liquid was about 43 W. It can be inferred from the data on the saturation frequency in liquid neon and liquid hydrogen that the saturation frequency is inversely proportional with the square root of the density of the fluid. Based on this inference the predicted saturation frequency in liquid deuterium is about 29 Hz at the nominal running point in this liquid. The power delivered by the pump is fitted well by a polynomial of third degree in frequency, fig. 5d. The pump head, fig. 5b, is fitted well by a second degree polynomial in frequency, although the pump efficiency is frequency dependent in liquid hydrogen. The mass flow seems to be maximum at the nominal frequency of 30 Hz, with a pump efficiency of 0.7. The average flow speed in the liquid hydrogen cell was determined to be about 8 m/s. The Reynolds number for the liquid hydrogen flow determined in these conditions is in excess of 106. Since the transition between laminar flow and turbulent flow happens for flows with Reynolds numbers between 2000 and 10000, the liquid hydrogen flow in our target at 30 Hz is well into the turbulent flow region.
The heat exchanger removed 450 W of heat from the loop with a coolant flow of 10.5 g/s from the 15 K helium coolant supply. The flow of the coolant has 30 uncertainty. The heat transfer coefficient, U was computed with the semi-empirical formula
| (9) |
where A is the area for heat transfer on helium/liquid hydrogen side respectively and
| (10) |
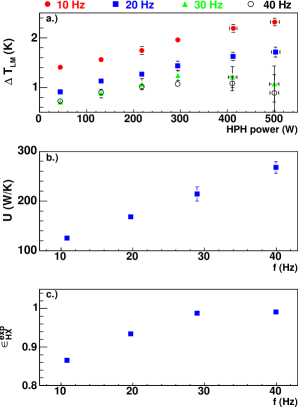
where G is the mass flow per unit area of the flow, (g/cm s) is the fluid’s dynamic viscosity, De is the wetted perimeter and Pr is the Prandtl number (dimensionless) for the fluid (Pr = CP/k, where k (W/cm K) is the thermal conductivity). For nominal running conditions at a cryogenic pump speed of 30 Hz the heat transfer coefficient was estimated to be U = 285 W/K for a heat exchanger with no leakage. At the same pump speed the data yielded a value for the heat transfer coefficient of U = 214 W/K, fig. 6b. The discrepancy comes from the model computed value for U, which assumes that the temperature is constant across the fins, while in reality it is a gradient from the helium side to the tip of the fins, and the gradient varies along the heat exchanger. Also, originally the heat exchanger had nylon rope wrapped around the fin tubing to force the liquid hydrogen flow to go around the fins, but the rope was removed because of concerns that it may block the flow on the hydrogen side, and due to this the heat exchanger has some leakage that depends on the flow speed. The leakage has the effect of reducing the value of the heat transfer coefficient compared to that from eqs. (9-10).
The mean temperature difference across the heat exchanger, has the expected behavior in frequency, it decreases with the increase in pump frequency, see fig. 6a, but it is not linear at high rotational frequencies of the cryogenic pump and high heat loads which is also related to the heat exchanger’s leakage. The effectiveness, see fig. 6c, is very close to the theoretical estimate for a counter flow heat exchanger, for N it should be above 0.95. In our heat exchanger the number of heat transfer units is at least 3.55, and the measured effectiveness is above 0.98 for pump frequencies higher than 30 Hz. The heat exchanger was tested for maximum heat transfer in Dec 2003 and up to the maximum power on the HPH (1000 W) was able to remove the heat load from the liquid hydrogen, while keeping the target at the nominal running point (19 K, 1.7 atm). The helium coolant flow was about 80% of the maximum deliverable by the ESR on the 15 K supply, so in principle this type of heat exchanger is able to remove more than 1000 W of heat load from liquid hydrogen.
After the liquid hydrogen was vaporized, when the temperature in the cryogenic loop was about 50 K, a cryogenic pump frequency scan was performed and the pump turned up to 73 Hz. The controller was turned off, and the shaft stopped turning in 23 seconds, as read on the tachometer readback, meaning that there is no significant friction impeding the rotation in cryogenic conditions.
3.2 In-beam tests
A set of tests with beam on target was carried out, scanning the location of the target in the beam to check the alignment, calibrating the HPH and checking the PID feedback loop with beam. The target location was scanned by stopping the beam, moving the target a known amount in each of the transverse directions to the beam direction, restoring the beam and recording the current from a background scintillator detector on a photomultiplier tube, located close to the target. For a beam size of 2 by 2 mm on the target, it was found that the target cell axis was centered on the beam axis to within 1 mm in both x and y, in agreement with the alignment specs for the experiment. From the HPH calibration it was determined that at full beam on target, 40 A, the target consumes about 320 W of cooling power. Theoretical estimates of target heating from a 40 A, 3 GeV electron beam are around 300 W (Al windows included). The difference of 20 W is cryogenic pump heating and losses to the environment.
3.2.1 Liquid hydrogen operation
The target is normally operated with liquid hydrogen at 19 K, or 3 K below its boiling point at 1.7 atm. The cryogenic pump rotated at 31 Hz with speed fluctuations of less than 0.1 Hz over months long continuous running. Since the helicity signal used to compute the PV asymmetry in this experiment changes on a 30 Hz basis the pump was run at a slightly different frequency from 30 Hz in order to avoid possible sources of systematics in the asymmetry measurements due to the pump rotation. The amplitude of the hydrogen cell vibrations due to the pump’s rotation at full speed (75 Hz) was measured and found to be below 0.01 mm. Since these vibrations do not happen at 30 Hz it is not expected that they correlate with the helicity signal. The electron beam’s natural motion on target is about ten times bigger than the cell’s vibrations. The contribution from the cell’s vibrations to the beam position on target is then expected to be negligible. The stability of the cryogenic pump rotation over time is a strong indication that the pump induced hydrogen cell vibrations are also stable in time. Target instabilities with beam trips are well mitigated by the HPH on PID. The temperature excursions seen when the beam trips or comes on target are less than 0.2 K and last about 20 s. The liquid hydrogen relative density change due to beam trips is 0.3. The relative normalized yield change in our detectors is about 1. The difference is due to the fact that the beam, when ramped up to nominal current, also drifts in space by as much as a few mm. To avoid this problem a beam trip cut was implemented in the data acquisition that excludes about 25 s of data after the beam comes on target. With relatively stable beam on target (400.5 A) the PID maintains the temperature constant to within 0.02 K (relative target density change expected from PID stabilization is 0.03%, completely negligible for this experiment).
3.2.2 Boiling studies
Dedicated data were acquired during two separate engineering runs to study the density fluctuations on the time scale of the asymmetry measurement. The detection technique in G0 is based on a time of flight spectrum. Because of this G0 does not use the standard CEBAF beam structure at 499 MHz, but rather a modified version of it at 31 MHz. This makes it possible to separate the elastic events from inelastics in the time of flight spectra. However, G0 is a parity violation (PV) experiment that ultimately measures not a cross section but an asymmetry [1]. From the target point of view there are two effects that influence the systematics in this kind of measurement. Since the target is a liquid it can have density fluctuations and global density reduction. Density fluctuations are random changes in the liquid density driven mainly by either fluctuations in beam properties (like intensity, position etc.) or random effects due to the interactions between beam particles and the target liquid (microscopic bubble formation, window heating etc.). The mechanisms for density fluctuations are complex and realistic cases are poorly understood quantitatively. Their effect translates directly into an enlargement of the measured asymmetry width. This enlargement in turn is a source of additional uncertainty in the asymmetry measurement and it thus increases the asymmetry error bar. Density reduction is a global reduction in the density of the liquid whenever there is beam on target. What it translates into is the reduction of the measured normalized yield from the liquid (as the effective target thickness is smaller) and in turn has the effect of reducing the statistics accumulated in a given period of time. With experiments on liquid targets, neither of the above mentioned density effects is avoidable. Therefore, it is necessary to reduce them until they become negligible on the time scale of the helicity change, 30 Hz for G0.
The basic computing unit for the PV asymmetry in this experiment is a quartet. A quartet stands for four consecutive helicity states, either having a structure like or . The measured asymmetry is formed between the sum of normalized yield with positive helicity and the sum of normalized yield with negative helicity, in the same quartet, divided by the sum of all four. The detector yields have been normalized to beam charge. The 40 A G0 electron beam is very focused in space, nominally about 200 microns in both x and y. Not only would this beam boil a liquid target in its path but it may also damage the target system as it has power densities in the range of kW/mm2. To mitigate this the beam is rastered uniformly over a larger area. In this experiment the raster shape is a square, nominally with a side of 2 mm, or an area of 4 mm2. Two triangular signals are swept along x and y with frequencies fx = 24.96 kHz and fy = 25.08 kHz with a linear speed of 1000 m/s to yield a square pattern with a uniformity of 95%. The goal of the target density studies was to determine the extra width due to target density fluctuations on the measured asymmetry width at the nominal running point in the experiment, beam at 40 A, 3 GeV, rastered at 2x2 mm2 and the cryogenic target pump rotating at 31 Hz.
3.2.3 Density fluctuations
The target density fluctuations depend on target medium temperature, cryogenic pump rotational speed and beam raster size, intensity and intrinsic spot size. Of all these dependencies measurements were made to assess target density fluctuations versus raster size, pump speed and target medium temperature. During each measurement only one parameter at a time was varied.
During the first engineering run, the G0 focal plane detector (FPD [1]) was segmented in two statistically independent detectors to check if the measured effect was concurrent. To separate deadtime corrections associated with time encoding electronics, which are rather complicated, from target density fluctuations the electronics were used in the scaler mode. In this mode the electronics counts detector hits with a deadtime of about 30 ns. The total asymmetry width, when the whole detector was summed up, was 320 ppm in nominal beam and pump running conditions. The density fluctuations were studied at constant beam current by changing the raster and this was repeated at different pump speeds. In the second engineering run data were taken with the same conditions as in the first engineering run (except for a different target cell). A newly instrumented detector set, the luminosity detectors or lumis, was also used in the second run. There were 8 lumi detectors placed in two sets of 4 at different locations along the beam line sensitive to very forward scattering, mostly Mller electrons and elastic electrons from e-e and e-p scattering in the target (from the beam line lumis 1-4 at 2∘ to the target, clocked at 45∘ in the x-y plane, and lumis 5-8 at 1.2∘ and along x-y axes, one up, one down, one left, one right).
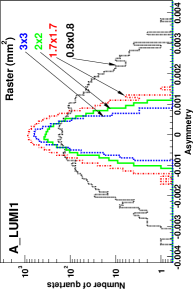
A typical lumi detector asymmetry width is 200 ppm for nominal running conditions. Fig. 7 shows the variation of lumi 1 asymmetry width with the beam raster size. Six of the lumis, 1-6, used photomultiplier tubes and two, 7 and 8, used vacuum photodiodes, although lumi 7 was malfunctioning during the measurements discussed here. Each lumi detector was used as an independent measurement, no combinations were made. The lumis have better statistical precision than the G0 FPD and they have no deadtime (as their signals are integrated), which make them more suitable for measuring target density related effects. However, the lumis are also very sensitive to beam related effects that are independent of the target, like scraping and halo. The figures that follow are from analysis of the data taken during the second engineering run.
A model for target density fluctuations was used to interpret the results obtained from data taken at constant beam current, constant pump speed and varying the beam raster. The asymmetry in a quartet is computed with
| (11) |
where N+ and N- are the number of detector hits per unit beam charge in the corresponding helicity state of a quartet. The statistical width of the asymmetry in eq. 11 is given by . A source of noise that acts on the time scale of the helicity change will result in an additional contribution to the asymmetry width resulting in a measured width of
| (12) |
where is the part of the detector asymmetry width associated with statistical fluctuations and is that associated with noise. In this model the assumption is that is dominated by target density fluctuations and depends on the beam raster size as an inverse power law
| (13) |
where is independent of raster size and rx is the raster linear size to a power that can be a fit parameter or forced by a model to a specific value. Eq. 13 was compared to a fit with fixed raster size exponent 2, based on heuristic arguments that the extra width on the measured asymmetry is proportional to the size of the target density fluctuations and that target density fluctuations are inversely proportional to the target volume illuminated by the beam (which is the target length times raster area), 1/Araster. Although the heuristic approach may be crude, it is a useful comparison.
The measured asymmetry width versus raster size (see fig. 8, for example) displays a pronounced nonlinear behavior of the asymmetry width as a function of the raster size at constant beam current and constant pump speed. Although the exact analytical dependence of the asymmetry width on the raster size is unknown, it was found that an inverse power law, eq. 13, fits the data well at 40 and 30 A beam current. At lower beam currents the inverse power law works poorly, while the fixed power law ( 2) works better. This may be due to the fact that as the beam intensity reduces, the density fluctuations decrease and the density becomes more or less constant on the time scale of a helicity state (30 Hz) over a wide range of raster sizes (which means that the heuristic arguments outlined above are holding better at lower beam currents). Both approaches were used to extract the density fluctuations versus raster size and they were compared. Fig. 8 has the measured G0 FPD asymmetry width versus raster size with the beam at 40 A and the pump rotating at 31 Hz. Fig. 9 has the asymmetry width in the same conditions as fig. 8, but the asymmetries have been linearly regressed for beam parameter correlations (like positions and angles at the target, charge and energy). The solid line is the fit with three parameters (, , and ), while the dashed line is the fit for the heuristic model, with the raster size exponent fixed at 2.
| Detector | ||||
|---|---|---|---|---|
| FPD | 2 | 145.2 | 2 | 146.4 |
| 1.61 | 199.9 | 1.3 | 266.2 | |
| Lumi 1-4 | 2 | 177.8 | 2 | 209.3 |
| 1.61 | 236.6 | 1.56 | 295.8 | |
| Lumi 5-8 | 2 | 168.6 | 2 | 173.4 |
| 1.55 | 237.9 | 1.48 | 304.4 |
The results for the G0 FPD and the lumis at the nominal running point are summarized in Table 1, where is extrapolated with eq. 13 to the nominal raster size of 2 mm (asymmetry width unit is ppm, fitting errors have been omitted for clarity).
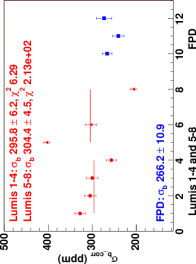
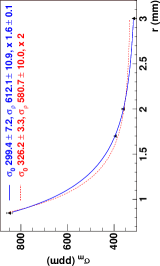
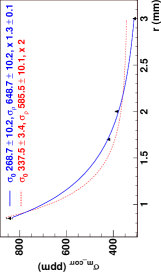
Figs. 10 and 11 are a summary of the model extracted, eq. 13, target density fluctuations for the lumi and G0 FPD at the nominal running point (beam 40 A, raster area 2x2 mm2, and pump 31 Hz). Fig. 10 shows the extracted target density fluctuations from the measured detectors asymmetry widths. On the horizontal axis, numbers 1-8 indicate the respective lumi detector (7 missing), number 10 denotes the G0 FPD, and numbers 11 and 12 denote the segmentation of the G0 FPD in two independent detectors, to check for concurrence of the extracted target effect (the two segments are summed in the analysis as the G0 FPD). The first 4 lumi detectors are in a remarkable agreement for the extracted target effect, lumis 5-8 are about 2 sigma away from each other, but average at the same value as lumis 1-4. The two segments of the G0 FPD measure similar effects between themselves (within 1 sigma), and their sum underestimates the extracted from the lumis data by 15%. Fig. 11 shows the extracted from the corrected detectors asymmetry widths with the linear regression for beam parameters. After the linear regression was applied the extracted value for becomes larger. The increase is about the same, 60-65 ppm, for the average of lumis 1 to 4, the average of lumis 5 to 8 and the G0 FPD. The individual data points are much more dispersed compared to the uncorrected data. Lumi 8 is the only detector whose extracted value for decreases with the regression. In our model, , defined by eq. 13, encompasses target and beam related effects. As a consequence it is expected that, after the asymmetry data are regressed for beam parameters, becomes smaller. In conclusion, it seems that the linear regression induces noise into the asymmetry measurement instead of subtracting it at a level of 65 ppm, consistent among the average of lumi 1-4, lumi 5-8 and the G0 FPD. There are beam effects that cannot be extracted by a linear regression out of the asymmetry data, like scraping and halo. For the nominal running conditions in the experiment (40 A, 3 GeV beam rastered on a square of side 2 mm and with the pump rotating at 31 Hz) we quote an upper limit for target density fluctuations contribution to the asymmetry width of 23865 ppm (the highest value in the column in Table 1, where the uncertainty is taken to be the biggest difference between raw and regressed values for ). In the normal running mode the asymmetries are measured in 16 Q2 bins. The G0 FPD gets segmented accordingly, and in a typical Q2 bin the asymmetry width is about 1200 ppm. A target related effect of 238 ppm on top of this nominal width increases the Q2 bin asymmetry width by 2, a negligible systematic effect for this experiment.
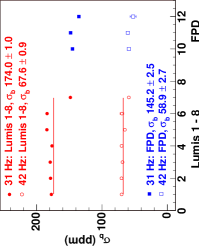
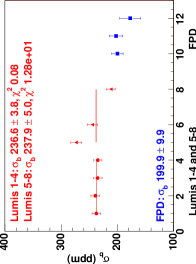
Fig. 12 shows the extracted values for at 40 A beam and two pump speeds, 31 and 42 Hz. Since there weren’t enough data to make a model extraction (using eq. 13) of the target density effect, the data for the two pump speeds have been compared to the heuristic approach ( 2). The horizontal axis is the same as in figs. 10 and 11. The heuristic approach seems to extract consistent values for , at the same pump speed, among lumis and the two independent segments of the G0 FPD. In this approach a significant drop in the target density fluctuations is seen between the two states of the pump, 31 and 42 Hz, suggesting that the boiling contribution drops with a power of the frequency for this target (the power law favored by this approach is .
The results from the first engineering run were analyzed with the heuristic approach, as there were not sufficient data at each beam current to make a fit with three parameters. However, those results are consistent with the results extracted with the same approach from the second engineering run. The target cell was replaced in between runs. Although the target material was the same for both, the exit window of the second cell was reduced by a factor of 3.6, from 0.28 mm to 0.08 mm. Within the limits of the model, the density fluctuations in a target with high speed longitudinal flow do not seem influenced by the exit window heating.
There is one caveat due to a beam property for all the numbers quoted in Table 1. Over the period of time when these target data were taken, the intrinsic beam spot size (unrastered) was 0.107 mm in x and 0.03 mm in y, while typically it is measured to be about ten times bigger in area. In these conditions the instantaneous power density on the target was ten times higher during the target density fluctuations studies than it is during normal running. The raster spreads it uniformly over the raster area on a time scale of 25 kHz, while the intrinsic beam repetition rate is 31 MHz. There are no studies to support the influence of the unrastered beam size over target density fluctuations.
A study has been done to check the variation of the lumis asymmetry widths with the target mean temperature. Changing the target mean temperature between 18 and 21 K resulted in a 3% change in the lumis asymmetry widths [8], which is negligible. This supports the conclusion that the density fluctuations mechanism in this target is not dominated by micro-bubble formation.
3.2.4 Density reduction
To extract the global detector yield reduction versus beam current, and avoid deadtime corrections, data at the same beam current and different raster sizes were extrapolated to nominal raster size, different beam currents, but the same power density. In this approach a beam intensity of 40 A and raster of 1 mm was assumed the same as 160 A and raster of 2 mm, since in both situations the power density is the same on the target. The slopes at two different beam currents, 40 and 30 A, were measured versus beam extrapolated currents from different raster sizes and the results are shown in fig. 13 as relative yield change versus beam current.
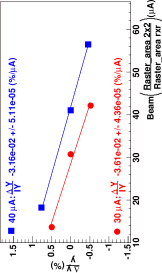
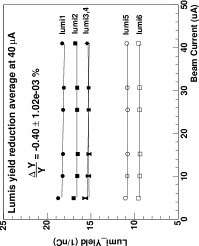
At a pump speed of 31 Hz, the FPD yield slopes measured with this indirect method are about the same, the 40 A measurement yielded -3.16e-2 5.11e-5 (/A) and the 30 A measurement yielded -3.61e-2 4.36e-5 (/A). The yield reduction was also measured for the lumi detectors. In this case the scan was done directly versus beam current, since these detectors are deadtime free, and the results are shown in fig. 14 as the relative change in normalized yield as a function of beam current. From these measurements it can be inferred that the global yield reduction when the pump rotates at 31 Hz is less than 1.5 at 40 A beam on target for the FPD and 0.4% for the lumis. The same yield slope extraction approach at a pump speed of 42 Hz, yielded slopes one order of magnitude smaller than the slopes at 31 Hz. The global FPD yield reduction, due to the target, in the nominal running conditions is tolerable for this experiment.
4 Summary
In ten months of operational experience in the forward angle mode the target has performed reliably, without a single major incident. At the nominal beam of 40 A and spot size of 2 mm, with the pump running at 31 Hz, target density fluctuations increase the asymmetry width by at most 2%. In the same nominal conditions the global relative yield reduction of the G0 FPD due to the target density reduction, has an upper limit of 1.5%. The part of the asymmetry width due to target density fluctuations varies nonlinearly with inverse pump speed (constant beam conditions). The target density fluctuations mechanism is not dominated by micro-bubble formation and by heating at the exit window. The target has a capacity of at least 1000 W power load while staying 3 K subcooled liquid. The effects produced by the target satisfy the requirement of negligible systematic effects in a parity-violation experiment.
5 Acknowledgments
This project was supported by the National Science Foundation under Grant No. PHY-0244899. The authors wish to thank the Polarized Target Group at Jefferson Lab for the outstanding technical support during target testing and installation, especially drs. Mike Seely and Dave Meekins.
References
- [1] The G0 Collab., G0 Technical Design Report, Jefferson Lab E91-017, December, 1993.
- [2] C.E. Jones and E.J. Beise, The G0 Liquid Hydrogen Target Preliminary Design Document,G0-collab. Internal Report November 25, 1998.
- [3] E.J. Beise et al., Nucl. Instr. and Meth. A 378, 383 (1996).
- [4] E.J. Beise et al., The G0 Target Controls Manual, revised February 5,2004.
- [5] R.Carr and S. Covrig, The G0 Target User’s Guide, October 14, 2002.
- [6] See for example, H.Y.Wong, Handbook of essential formulae and data on heat transfer for engineers, London, Longman, 1977.
- [7] G. Smith, private comm., May 2004.