Measurement of the analyzing power of proton-carbon elastic scattering in the CNI region at RHIC
Abstract
The single transverse spin asymmetry, , of the p-carbon elastic scattering process in the Coulomb Nuclear Interference (CNI) region was measured using an ultra thin carbon target and polarized proton beam in the Relativistic Heavy Ion Collider (RHIC) at Brookhaven National Laboratory (BNL). In 2004, data were collected to calibrate the p-carbon process at two RHIC energies (24 GeV, 100 GeV). was obtained as a function of momentum transfer . The results were fit with theoretical models which allow us to assess the contribution from a hadronic spin flip amplitude.
The elastic scattering of polarized protons off nuclei at RHIC energies provides information on a spin dependent hadronic spin-flip amplitude. In the Coulomb-Nuclear Interference (CNI) region, i.e. where , the single transverse spin asymmetry, , of p-carbon elastic scattering is used to measure the beam polarization in RHIC. The data also provide physics information on the spin dependent hadronic contribution to the transverse asymmetry. For very small angle scattering, the elastic process dominates, and experimentally the elastic events are cleanly identified by measuring the recoil carbons for polar angles near 90∘ in the laboratory frame. In the CNI region, the electromagnetic and hadronic helicity amplitudes are comparable in size. A non-zero arises mainly from the interference between the coulomb spin-flip amplitude (which generates the anomalous magnetic moment of the proton) and the hadronic non spin-flip amplitude. This interference term, called ’pure CNI’ is precisely determined from QED calculation. However, a contribution to can also come from the other interference term from the hadronic spin flip amplitude (coupling with the coulomb non spin-flip amplitude), which can be described by Regge poles exchange phenomenology[1]. Since this hadronic term is in the nonperturbative QCD region, experimental data is indispensable.
Following the analogy to the helicity amplitude formalism of proton-proton elastic scattering, the process can be described by two amplitudes, spin non flip , and spin flip . The spin flip amplitude parameter is defined as, , where is the proton mass, and is the hadronic element of the helicity amplitudes. This may be connected to a independent parameter for [7]. The AGS experiment E950[2] has provided the only measurement of , at . The result from E950 was with a strong anti correlation between real and imaginary parts.
For the current experiment, the polarized proton beam passes through an ultra-thin carbon ribbon target (3.5- thick[3]), and carbon recoils from CNI scattering are observed in six silicon strip detectors placed at 90∘ to the beam direction, 15 cm away from the target. Each detector has active area divided into 12 strips, each directed parallel to the beam line. The six detectors are mounted inside the vacuum chamber with readout preamplifier boards directly attached to feed-through connectors on the detector ports. Data acquisition is based on waveform digitizer modules (WFD)[6]. The system reads out the data without deadtime to accommodate very high event rates. The waveforms from the strips are digitized, and energy () and time of flight () w.r.t. the RHIC rf clock are determined by on-board FPGA. Typically samples of carbon events are stored in memory on board and are readout after the measurement.
Slow particles inside our kinematical acceptance follow the non-relativistic kinematics i.e., , which is slightly deformed by an energy loss correction in the inactive silicon surface. The size of the deformation is used to estimate the thickness of the inactive layer[4]. It is estimated to be . The invariant mass of the recoil particle is reconstructed with the time and energy information. A three standard deviation cut around the carbon peak is applied for the carbon identification. The cut clearly separates the carbon events () from background ().
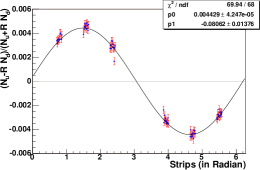
A raw asymmetry is calculated for carbon counts in left and right detectors using a geometric mean method, which takes advantage of the alternating spin patterns in RHIC[8]. Since each silicon strip can serve as an individual device measuring the asymmetry, the systematic uncertainty of the measurements is estimated from the size of fluctuation among the strips. Figure 1 shows the up-down asymmetry for the -th () strip ( where is the luminosity ratio of up/down spin bunches). By allowing a phase shift to the fit (two parameters: amplitude, phase), the is reduced to 70/68, whereas it is 104/69 for one parameter fit. This value indicates there is a negligible systematic error in the measurement, and a spin tilt ( degrees) from vertical.
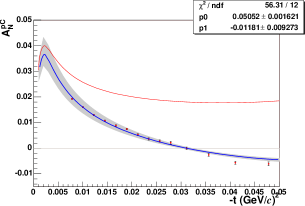
is obtained by dividing the raw asymmetry of events by the beam polarization measured by the polarized hydrogen gas jet target[5], Figure 2 shows at 100GeV, where [5]. The thin line through the data points is from a fit allowing hadronic spin flip[1]. The error bars on the data points are statistical only. The size of systematic errors is shown with the shaded band. They are due to (i) the ambiguity from the uncertainty in the inactive surface layer of the silicon, (ii) the error of the beam polarization measured with the jet. The value from the best fit results is and . The uncertainty is mainly due to the two systematic error sources described above. The 1- error contour has a very strong anti correlation between the real and imaginary part of , from (0.070, -0.16) to (0.035, 0.110). For 24 GeV, even though the absolute scale of is not available yet from the hydrogen jet measurement, the shape is obtained and compared with 100 GeV for the range, . The slope of at 100 GeV is significantly steeper than 24 GeV.
Acknowledgments
We are grateful to W. Lozowski in Indiana University, Z. Li and S. Rescia in BNL for their hardware supports to this experiment. The authors thank the jet target collaboration for providing the absolute beam polarization value. This work is supported by the U.S. Department of Energy and by RIKEN Laboratory, Japan.
References
- [1] T.L. Trueman, hep-ph/0305085 (2003).
- [2] J. Tojo et al. Phys. Rev. Lett. 89, 052302 (2002).
- [3] W.R. Lozowski and J.D. Hudson, NIM in Physics Research A334, 173 (1993).
- [4] O. Jinnouchi et al. RHIC/CAD Accelerator Physics Note 171 (2004).
- [5] A. Bravar et al. these proceedings (2004).; The talks on the jet, T. Wise et al., A. Nass et al., A. Zelenski et al., these proceedings (2004).
- [6] D.N. Svirida et al. detail description is found in these proceedings (2004).
- [7] B.Z. Kopeliovich and T.L. Trueman, Phys. Rev. D64, 034004 (2001).
- [8] G.G. Ohlsen and P.W. Keaton, NIM in Physics Research 109, 41 (1973).