Design Constraints for a WIMP Dark Matter and Solar Neutrino Liquid Neon Scintillation Detector
Abstract
Detailed Monte-Carlo simulations were used to evaluate the performance of a liquid neon scintillation detector for dark matter and low-energy solar neutrino interactions. A maximum-likelihood event vertex fitter including PMT time information was developed, which significantly improves position resolution over spatial-only algorithms, and substantially decreases the required detector size and achievable analysis energy threshold. The ultimate sensitivity to WIMP dark matter and the flux uncertainty are evaluated as a function of detector size. The dependence on the neon scintillation and PMT properties are evaluated. A 300 cm radius detector would allow a 13 keV threshold, a flux uncertainty of 1, and limits on the spin-independent WIMP-nucleon cross-section of cm2 for a 100 GeV WIMP, using commercially available PMTs. Detector response calibration and background requirements for a precision measurement are defined. Internal radioactivity requirements for uranium, thorium, and krypton are specified, and it is shown that the PMT data could be used for an in-situ calibration of the troublesome 85Kr. A set of measurements of neon scintillation properties and PMT characteristics are outlined which will be needed in order to evaluate feasibility and fully optimize the design of a neon-based detector.
1 Introduction
This paper presents details on the design of a dual-purpose liquid neon based detector for dark matter and low-energy solar neutrino interactions. The origin of dark matter in our universe and study of low-energy solar neutrinos are two of the foremost topics in particle astrophysics. Current observational evidence strongly suggests that a large fraction of the total matter in our universe is non-luminous, non-baryonic matter outside of the current standard model of particle physics. A currently favored hypothesis is that the dark matter consists of WIMPs (Weakly Interacting Massive Particles). A natural candidate for this particle is the lightest superpartner which arises from supersymmetry, the neutralino. Current direct dark matter searches attempt to detect WIMP interactions through elastic scattering on target nuclei, and this is the basis for WIMP detection in this study.
The current generation of solar neutrino experiments have shown that mixing occurs between the neutrino flavors. One of the goals for next-generation experiments is to measure with high-precision the low-energy neutrinos. These neutrinos account for greater than 90% of all solar neutrinos, and are well-constrained by the measured solar luminosity. A precision measurement of the flux of neutrinos would lead to improved knowledge of neutrino mixing in the solar sector (), tests of the neutrino oscillation prediction in the low-energy region where vacuum mixing dominates, and precision tests of solar evolution models.
WIMP particles () and solar neutrinos () can be observed in liquid neon through their elastic scattering from nuclei and electrons, respectively:
| (1) | |||||
| (2) |
Monte-Carlo simulations were performed to evaluate the performance of a neon scintillation detector sensitive to the recoiling nuclei () and electrons () from equations 1 and 2. The concept of a liquid neon scintillation detector for solar neutrinos was first proposed by McKinsey and Doyle [1]. The experimental design of a next-generation WIMP dark matter experiment should allow a sensitivity increase of several orders of magnitude over present dark matter experiments to probe interesting regions of supersymmetry parameter space. Ultra-low backgrounds and a large fiducial target are required to achieve this goal. A large spherical volume of neon, along with precise event position reconstruction allows for a large fiducial mass and a large mass to surface area ratio, with the advantage that external source backgrounds are physically distant from the fiducial target and can be dealt with through position reconstruction.
Simulations were performed assuming nominal characteristics of scintillation light in liquid neon, and detector performance was estimated for commercially available photomultiplier tubes (PMTs) with ultra-low background glass. The details of the simulation inputs and algorithms are presented in section 2. The detector response to scintillation events is characterized in section 3, where reconstruction algorithms and response functions useful for evaluating predicted observables for dark matter and solar neutrino interactions are presented. The sensitivity to solar neutrinos is discussed in section 4. Section 5 describes the reduction of external and internal backgrounds through reconstruction and analysis cuts, and the ultimate background requirements. Optimizing the detector for dark matter and solar neutrino sensitivity is discussed in section 6. Calibration requirements for the full-scale experiment are outlined in section 7. The requirements from photon absorption and sensitivity to neon scintillation and detector parameters are presented in section 8, along with a list of which measurements are needed to fully optimize the detector design. Conclusions from this work, and potential advantages of this approach are presented in section 9.
2 Simulation Details
A detailed simulation of a liquid neon detector was coded using the GEANT4 package [2]. This package is used for tracking of electrons, and x-ray photons, -particles, recoiling nuclei, and neutrons in the detector, and subsequent simulation and tracking of scintillation photons. A 3D model of the PMT is used, and tracking of photons across surfaces is accomplished with the UNIFIED model of the DETECT code [3], as incorporated in GEANT4. All neutrino or dark matter interactions are detected via scintillation light produced in the liquid neon. Table 1 shows the properties of liquid neon used in the simulation, along with the references for these values. Scintillation light is produced via excitation of molecular states in the neon. The relative intensity of these states, as well as the overall yield (or quenching factor) depends on the ionizing particle. Two states are produced: the singlet () state with an assumed 2.2 ns lifetime [4] and the triplet () state with a 2.9 s lifetime [5].
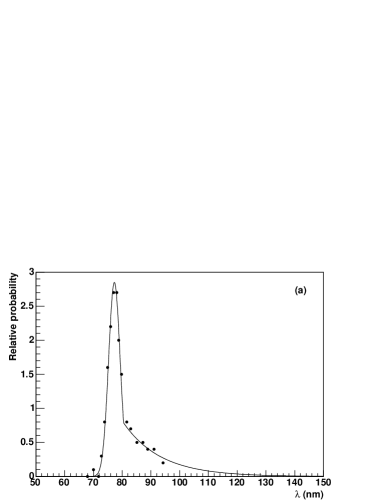
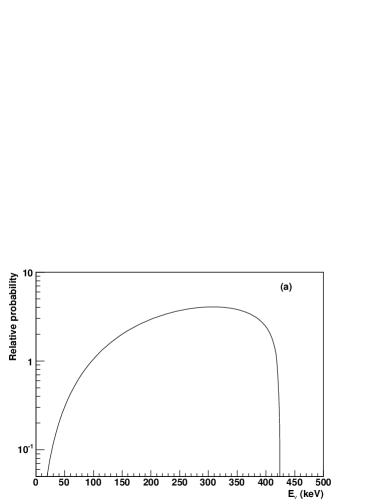
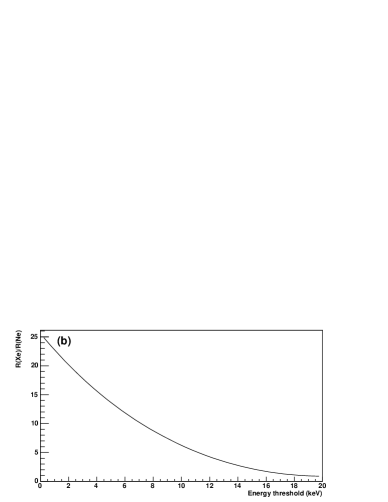
Quenching factors and the ratio of intensity of the singlet to triplet states (), which determine the overall time structure of the scintillation light, for electrons, alpha particles, and nuclear recoils were inferred from a combination of measurements with liquid argon, xenon, and neon [6, 7] and are shown in Table 2. The difference of these intensity ratios between electron and nuclear recoils provides discrimination between these event types and ultimately allows the separation of potential WIMP events from solar neutrino events and backgrounds. Many of the entries in Tables 1 and 2 are estimates or preliminary measurements, and need to be quantified more precisely. The sensitivity to these parameters is discussed in section 8.2. To detect the scintillation photons with a 75% photocathode coverage on a sphere with a nominal radius of Rpsup = 300 cm (Rpsup denotes the radius of the photomultipler support structure), 1832 12 cm hemispherical PMTs are arranged in a 3-frequency icosahedral pattern [8]. The nominal PMT properties assumed in the simulation are shown in Table 3. The commercially available Electron Tubes D737KB [9] PMTs assumed for the simulation are made with ultra-low background glass, with quoted upper limits of uranium and thorium of 30 parts per billion (ppb), and of potassium of 60 parts per million (ppm). These PMTs can be manufactured with low-resistivity photocathodes for operation at low temperatures [10]. The random count rate in the PMTs is assumed to be 500 Hz, extrapolated from measurements made by the manufacturer [11]. The spectrum of light emitted from scintillation in neon peaks at 77 nm, and is shown in Fig 1(a), adapted from [12]. The Rayleigh scattering length at this wavelength in liquid neon has been calculated to be 60 cm [13]. Fig. 1(b) shows the Rayleigh scattering length versus photon wavelength in liquid neon used in the simulation
The nominal detector geometry used in the simulation is shown in Fig. 2. A sphere of PMTs is immersed in a volume of liquid neon. Each PMT views the inner region of neon, and consists of a hemispherical photocathode and glass window which has been covered with a wavelength shifting film. Extreme ultraviolet (EUV) photons which strike the front of the PMT are shifted up in wavelength and are emitted into 4. These photons can then be transported through the window and generate a photoelectron in the cathode, according to the PMT quantum efficiency (0.20) used in the calculation. The wavelength shifter (WS) is assumed to be transparent to photons which have been previously shifted into the 250-500 nm range.
| Quantity | Value | Reference |
| LNe scintillation yield (prompt) | 10791.7 photons/MeV | [7, 14, 15, 16] |
| LNe scintillation spectrum | (see Fig. 1) | [12] |
| Rayleigh scattering length @ 80 nm | 60 cm | [13] |
| refractive index in LNe @ 80 nm | 1.233 | [13] |
| absorption length in LNe @ 80 nm | ||
| singlet (prompt) time constant () | 2.2 ns | [4] |
| triplet (slow) time constant () | 2.9 s | [5] |
| prompt WS efficiency for EUV photons (4) | 1.0 | [17] |
| total WS efficiency for EUV photons (4) | 1.35 | [17] |
| WS time constant 11footnotemark: 1 | 14.816 ns | [17] |
| 11footnotemark: 1 Time constant for 100 efficiency within 20 ns, inferred from [7]. | ||
| Property | e- | n.r. | |
|---|---|---|---|
| quenching (prompt) | 1.0 | 0.7973 | 0.25 |
| 2.0 | 8.7 | 20 |
| Property | Value |
|---|---|
| number of PMTs | 1832 |
| photo cathode radius | 12 cm |
| effective coverage | 0.75 |
| Q.E. (blue photons on envelope) | 0.20 |
| threshold | 1/4 p.e. |
| photo cathode reflectance | 0.02 |
| dark noise rate | 500 Hz |
| Electron Tubes D737KB | |
| mass (glass) | 1 kg |
| thickness (glass) | 3 mm |
| uranium | 30 ppb |
| thorium | 30 ppb |
| potassium | 60 ppm |


3 Detector response
In this section the detector response functions in position and energy are evaluated using the Monte-Carlo calculations. These response functions can then be used to estimate the signal from WIMP and neutrino interactions, the backgrounds present in the signal region, and the ultimate experimental sensitivity.
3.1 Event position and energy reconstruction
Coakley and McKinsey have shown the potential for using completely geometrical position reconstruction algorithms for scintillation events in a liquid neon detector [18]. Here we describe a more general reconstruction algorithm which incorporates PMT hit time as well as hit pattern information to improve position resolution. Although the PMT timing distribution is quite broad (many tens of ns), the distinctive shape of this distribution for events near the center versus that near the PMT region improves the position resolution significantly.
In the absence of scattering or noise hits, the location of a scintillation event can be estimated by taking the geometric mean of the PMT hit positions, since scintillation photons are emitted isotropically into :
where is the event location and is the vector to the PMT to detect a scintillation photon. Assuming spherical detector symmetry, the only effect of scattering can be a radial offset between the true event position and the mean of the PMT hit positions, so that we have
| (3) |
where
| (4) |
and is related to the effective scattering length in the detector. Rearranging equation 3, we have
| (5) |
absorbing an arbitrary constant and with in general a function of event radius and energy. We can thus determine by Monte-Carlo and use equation 5 to estimate the position of scintillation events.
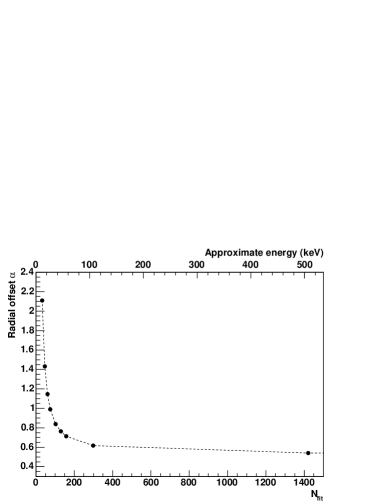
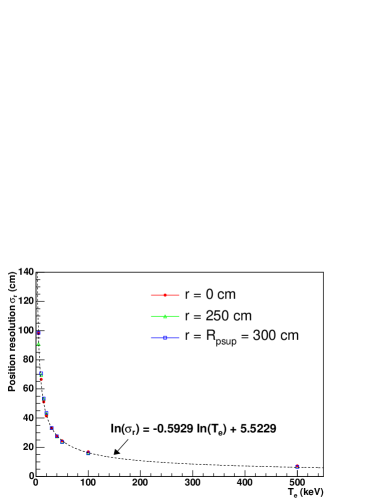
The reconstructed energy and position distributions (using the spatial algorithm) are shown in Fig. 3. The reconstruction calibration function ( from equation 5) is shown in Fig. 4. The position resolution, derived as a function of the electron energy, is shown in Fig. 5, where it is seen that the position resolution worsens sharply as the number of noise hits becomes comparable to the number of scintillation hits.
The energy for each event is estimated by applying the correction
| (6) |
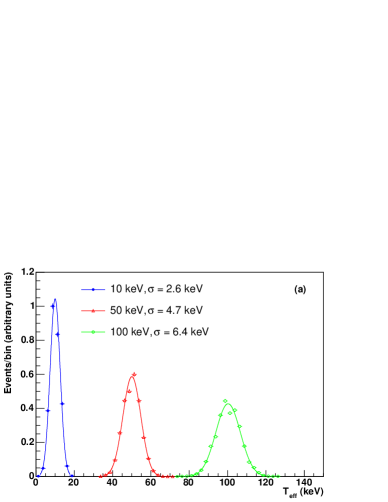
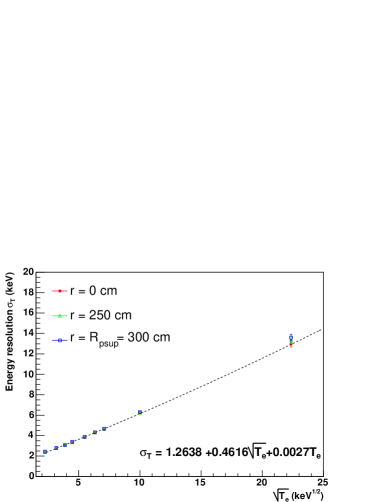
where NHITs is the total number of PMT hits, and the energy calibration parameters and are determined from the Monte-Carlo calculations.111These parameters will ultimately be calibrated in the physical detector using radioactive sources. The energy resolution function, which is directly related to the total number of hits, is shown in Fig. 6.
The distribution of PMT hit times (relative to the trigger time) can be used in the position reconstruction algorithm to improve position resolution. For a PMT which fired at time for a scintillation event which occurred at time , we define the time residual
| (7) |
where
| vertex-PMT distance, | ||||
| average refractive index. |
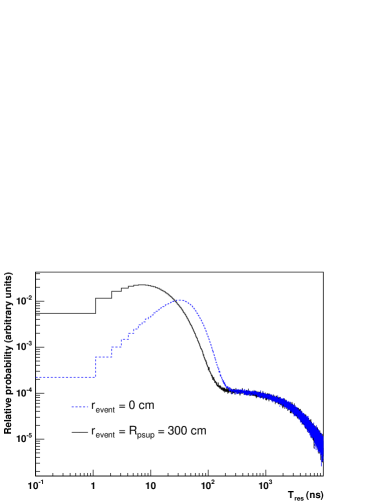
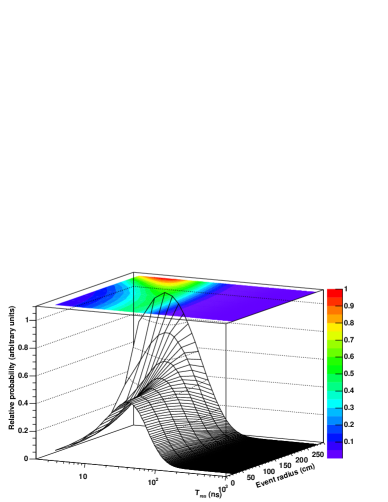
In the absence of scattering, would be the convolution of the scintillation time spectrum with the PMT time resolution. Scattering will broaden the distribution and skew it toward later times. Fig. 7 shows the distribution defined by equation 7 for simulated 100 keV electron events at the detector center (r = 0) and near the PMTs (r = Rpsup). To incorporate timing information into the reconstruction algorithm, a 2-dimensional probability density function (pdf) in versus event radius (shown in Fig. 8) has been derived from MC calculations, for which we can calculate the probability density for a given event with a given vertex position and time,. A likelihood function is defined
| (8) |
where are the event position and time, are the set of PMT positions and hit times. For computational efficiency, we redefine the likelihood as
| (9) |
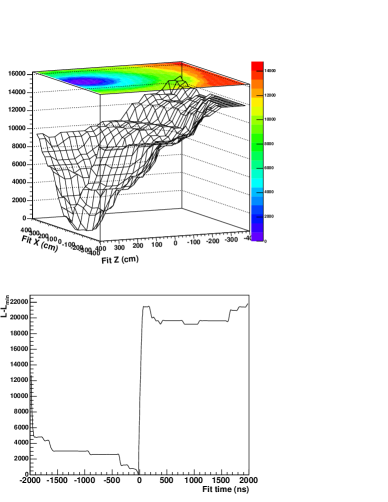
We can now minimize equation 9 to find the most likely values for . An x-z slice of the likelihood surface defined by equation 9 is shown in Fig. 9(a) for a simulated 20 keV electron event at position (0, 0, Rpsup), and the likelihood versus event time is shown in Fig. 9(b), where a deep minimum is seen near the event position and time. The information in the spatial hit pattern of the PMTs can be added to the likelihood function by including to equation 9 the position response using only the hit information:
| (10) |
where is the position response function shown in Fig. 5.
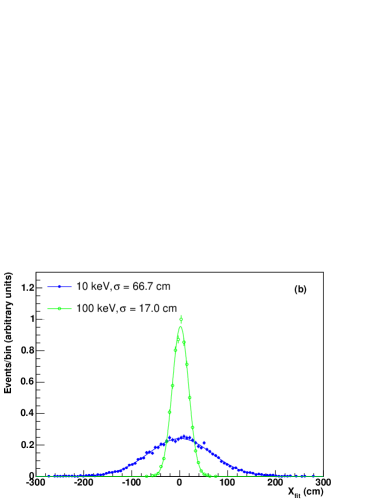
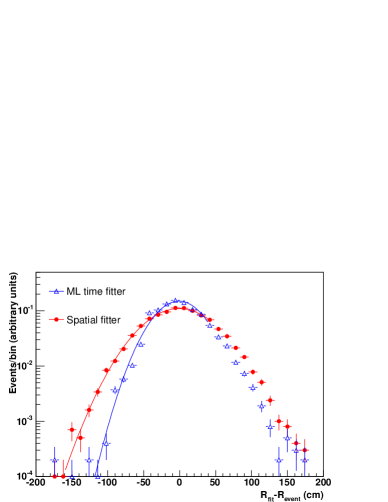
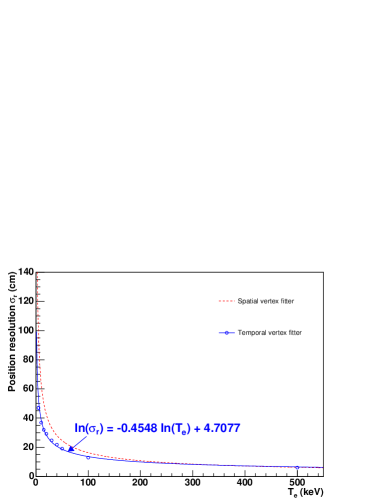
Fig. 10 shows the reconstructed position distributions using equation 10 and equation 3 (spatial only) for 20 keV electron events at r = Rpsup. The resolution for low-energy events improves by a factor of approximately two when the time information is included. This is a significant improvement since it implies the same background reduction as doubling the detector size, assuming 20 keV background at the PMT radius. The derived position resolution functions versus kinetic energy for both methods are shown in Fig. 11.
4 Solar neutrino sensitivity
Solar neutrinos are detected by their elastic scattering from electrons in the target material. The recoiling electrons will generate scintillation light. The predicted differential electron recoil spectrum from elastic scattering of solar neutrinos is
| (11) |
with
| number of electrons in target | ||||
| or component of flux | ||||
The neutrino-electron elastic scattering cross-section is taken from [19]. The and {} components of the solar neutrinos can be estimated by using the standard solar model predicted spectra and rates [20], and the solar neutrino mixing parameters from a global analysis of the solar and reactor neutrino experiments [21]. With the parameters from Table 4, we can calculate the predicted solar neutrino spectrum as
| (12) | |||||
| (13) |
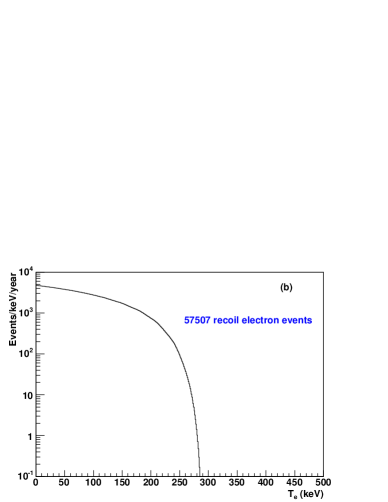
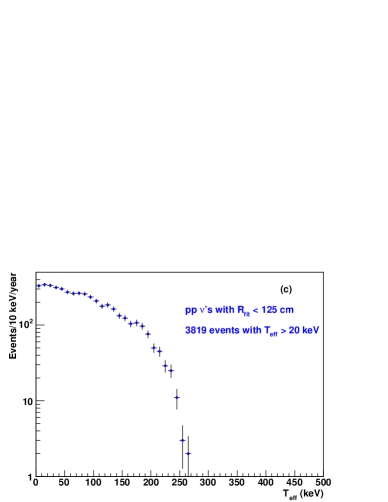
where is the undistorted solar neutrino spectrum, and is the electron neutrino survival probability at Earth calculated with the nominal solar mixing parameters.222The survival probability was calculated with analysis code provided by the SNO collaboration. Fig. 12(a) shows the predicted solar neutrino energy spectrum. Fig. 12(b) shows the predicted differential electron recoil energy spectrum for a 3 meter radius target of liquid neon exposed to neutrinos for 1 year, and figure 12(c) shows the predicted spectrum measured with the detector, for a fiducial volume cut of 125 cm, representing approximately 10 fiducial tonnes of target. The total number of events within these cuts is 3819, which leads to a statistical uncertainty on the neutrino flux of approximately 1.6%.
| Parameter | value |
|---|---|
| flux | cm-2s-1 |
| eV2 | |
| degrees |
5 Backgrounds
5.1 External backgrounds
Purification of the neon is expected to reduce background contamination from internal sources of radioactivity significantly [1]. The PMTs and associated hardware will contain the largest amount of radioactive contamination near the inner detector volume. To reduce these backgrounds we must design an active shielding region of liquid neon, and apply position reconstruction cuts to define a fiducial signal region with acceptable background levels. With the nominal impurities in the PMTs, the number of decays from the uranium and thorium chains, and from 40K is large, shown in Table 5. In principle we would like to simulate all of the activity from these sources of background, and apply event reconstruction and fiducial volume cuts to estimate the residual background contamination in the signal region. This is difficult in practice given finite computational resources, since the total number of simulated events would be large.
| Chain | Specific activity | Total mass in PMTs | Decays/year |
|---|---|---|---|
| (Bq/g) | (g) | ||
| U | 0.0553 | ||
| Th | 0.0553 | ||
| K | 110.52 |
To decrease computational requirements, the detector response to x-ray and -ray photons from the uranium and thorium chains and from potassium decays in the PMTs is estimated by using the MC-calculated response functions in energy and radius from section 2:
| (14) |
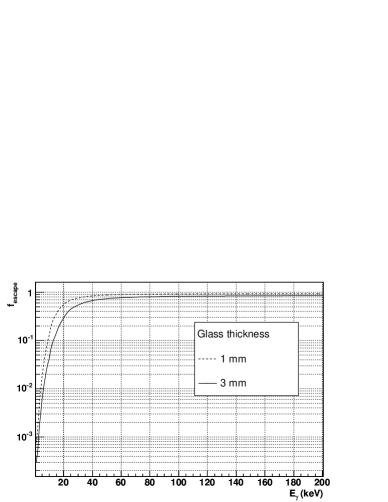
where is the distribution of energy deposition (in kinetic energy and radius ) due to photons from the PMTs, and is the detector response function. is a correction factor for photon absorption in the PMT glass, shown in Fig. 13, and is a solid angle correction to account for x-ray and -ray coincidence (approximately 0.5 for x rays and 1 for rays).
We further assume
| (15) |
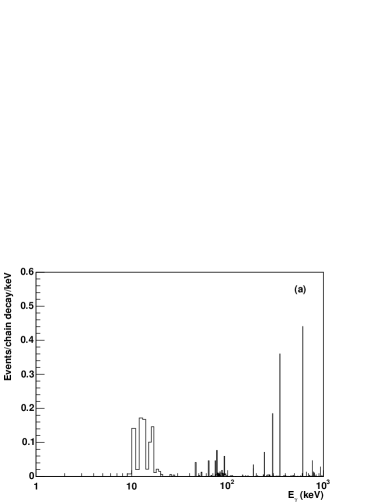
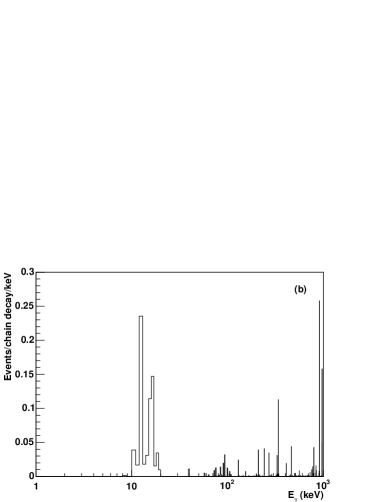
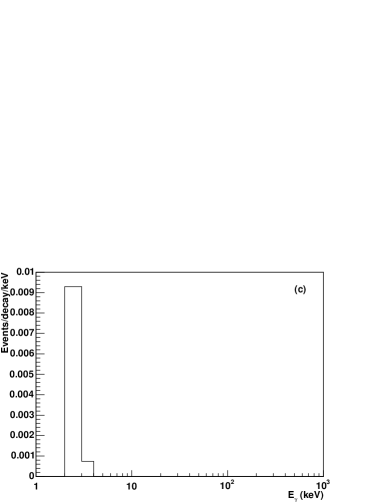
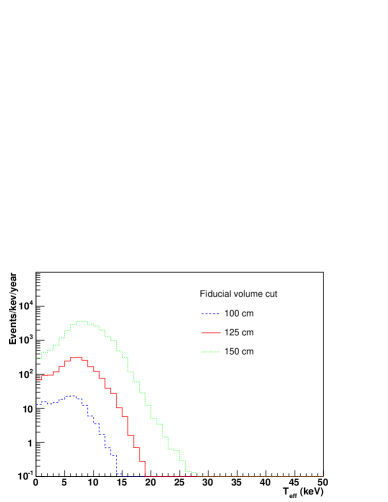
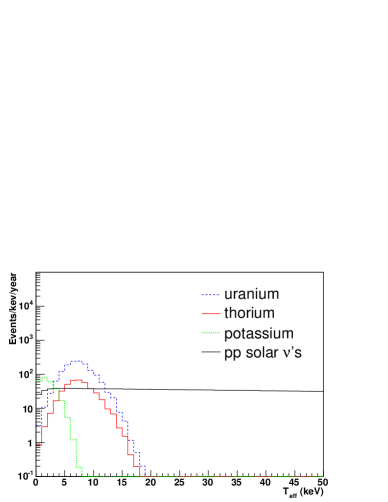
and use the response functions shown in Figs. 11 and 6.333Note the subtle difference between and . In this scheme we need only the position and energy response functions derived, and a model for the -ray distribution at the PMTs due to radioactive contamination in order to estimate residual backgrounds. The distribution ) is calculated with Monte-Carlo by generating the photon energy distribution from the uranium and thorium chains, and from potassium decays (including all x and rays listed in the Table of radioactive isotopes [22], shown in Fig. 14) and recording the resulting radial and energy distributions. Low-energy x-rays are most problematic even though they are strongly attenuated by the PMT glass and the liquid neon, since the poor position resolution at low energies allows these events to misreconstruct within the fiducial volume. We can integrate equation 14 between and to estimate the effective energy spectrum due to decays in the PMTs for a fiducial volume cut, . Fig. 15 shows these for several fiducial volume cuts. Fig. 16 shows the PMT backgrounds for each contaminant, and the intersection with the energy spectrum which defines the analysis threshold. The achievable background reduction for the commercially available PMTs would allow a low enough threshold (approximately 13 keV) for a feasible neutrino and dark matter experiment.
5.2 Internal backgrounds
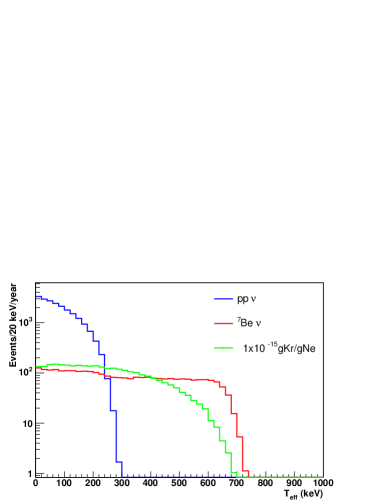
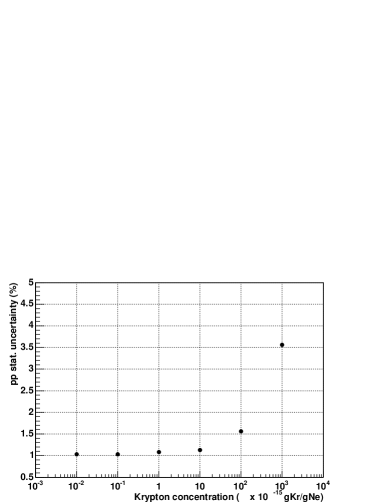
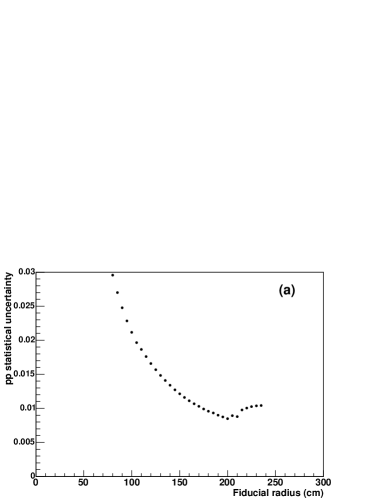
The dominant internal source of background for the neutrino measurement is expected to be 85Kr since it has a relatively short half-life ( 11 years), is a emitter with energies in the same range (Q-value = 687 keV) as the neutrinos, and is present in the atmosphere. Several other naturally-occurring radioactive contaminants, expected to be less troublesome than 85Kr, will need to be removed from the neon in order to achieve acceptable background levels for neutrino detection, most notably uranium and thorium. To estimate the requirements for internal background contamination, numbers of events from the uranium chain, thorium chain, and from 85Kr were estimated, and target concentrations were set which would lead to less than background to the solar measurement between 20-500 keV (the region of interest for neutrinos). These target concentrations are shown in Table 6. The required concentrations for uranium and thorium, although quite low, have been achieved in large quantities of organic liquid scintillator [23]. Due to the different binding energy of neon on carbon relative to those of most other impurities [24], cryogenic purification with cold traps is expected to be quite effective. The requirements for 85Kr are severe and ex-situ assays at this level will present unprecedented challenges. The spectral shape of decays from 85Kr, shown in Figure 17(a) can be used to extract this activity in-situ from the PMT data. Figure 17(b) shows the inferred statistical uncertainty on the integral neutrino flux from a maximum likelihood (ML) separation of 85Kr decays, 7Be neutrino, and neutrino interactions. It is found that a concentration of of 85Kr can be extracted in-situ without significantly increasing the uncertainty, although the correlation with the 7Be signal will make separation of 85Kr from 7Be neutrino interactions difficult.
| Nuclide | Activity | Isotopic | Specific | Target | Target |
|---|---|---|---|---|---|
| source | abundance | activity | mass | Conc. | |
| (Bq/g) | (ng) | (g/g) | |||
| Kr | 85Kr | 1.5e-11 | 1 | ||
| Th | 232Th chain | 1.00 | 3.1 | 2.2 | |
| U | 235U, 238U chains | 0.993, 0.007 | 8.5 | 6.2 |
5.3 Cosmogenics and neutron backgrounds
The primary backgrounds for dark matter and solar neutrino experiments related to cosmic ray muons are fast neutrons produced in materials surrounding the detector and long-lived radioactivity created in the detector itself from muon spallation. Mei [25] has estimated the size of these backgrounds for a liquid neon experiment and concludes that they can be made negligible by locating the detector at sufficient depth (greater than 5000 meters water equivalent) to reduce the incoming muon flux.
The large spherical volume of neon will also act as a veto for neutrons from sources external to the detector which penetrate a water shielding region. Neutrons will thermalize and be captured in short distances in liquid neon. A fiducial volume cut can thus be used to remove external neutrons, and the coincidence signal between the scintillation photons from neutron-neon recoils and the subsequent capture ray can further reduce this background. In addition the time distribution of a neutron event will be distinguishable from a WIMP-nucleus scatter, since a neutron in liquid neon will scatter several times, while a WIMP will scatter only once. The neutron time distribution is thus broader than the corresponding distribution for a WIMP-induced recoil. In this study the detector is assumed to be at a sufficient depth and have adequate shielding so that these backgrounds are negligible.
6 Dark Matter Sensitivity
In the approach taken here, the ultimate sensitivity to dark matter is determined by the limit on the total rate of detected dark matter interactions. This rate is a function of the WIMP-nucleon cross-section, the fiducial target mass, the analysis energy threshold, and the number of irreducible background events. We present here the predicted rates and recoil energy spectra for WIMP-nucleon scattering in liquid neon.
6.1 Dark matter recoil spectra and rates
The differential nuclear recoil spectrum for WIMP dark matter elastic scattering from a target with nuclear mass A is given by (in events per unit energy per unit time per unit detector mass) [26]
| (16) |
with
| unquenched nuclear recoil | ||||
| kinetic energy | ||||
| WIMP-nucleus ES cross section | ||||
| local dark matter density | ||||
| speed of Sun around galactic center | ||||
| WIMP mass | ||||
| reduced WIMP-nucleus mass | ||||
| Nuclear mass | ||||
| form factor | ||||
| minimum WIMP velocity | ||||
| earth’s velocity. |
is spherical Bessel function, and is the nuclear recoil energy in keV.
To compare experiments with different target nuclei, we express the nuclear cross-section in terms of the nucleon cross-section [28]
| (18) |
with
| (19) |
where we consider only the spin-independent interaction.
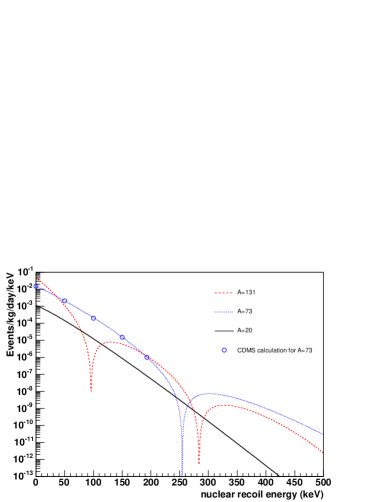
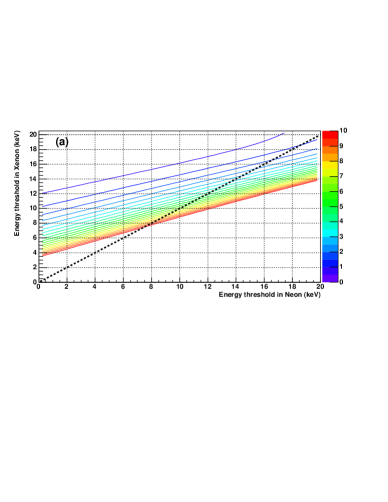
Figure 18 shows the nuclear recoil spectrum calculated with equation 16 for the input parameters defined in Table 7 for several target nuclei. A potential advantage over a xenon-based detector is the lower sensitivity to the achievable energy threshold due to the shape of the recoil spectrum. Figure 19 shows the ratio of expected dark matter rates above threshold for xenon and neon targets, where it is seen that the relative xenon sensitivity drops quickly as the energy threshold is increased. The nuclear form factor correction (Eqn. 17) tends to suppress the predicted event rate for large A nuclei with increasing kinetic energy, so that for experimentally achievable energy thresholds, much of the gain obtained by exploiting the coherence predicted by equation 18 for large-A target nuclei is lost. With a 10 keV threshold, for example, the additional sensitivity with xenon is only approximately a factor of 6, which can be overcome with neon by using a larger target mass.
| Parameter | Value |
|---|---|
| 0.3 GeV c-2 | |
| 220 km s-1 |
6.2 Distinguishing nuclear and electron recoils in neon
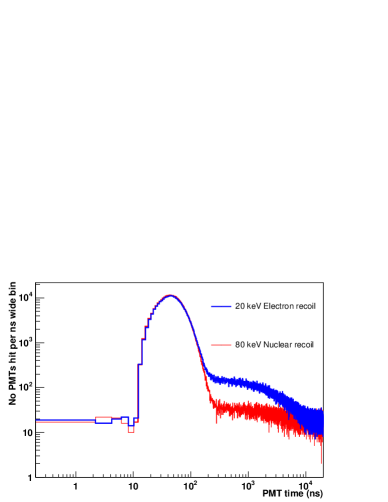
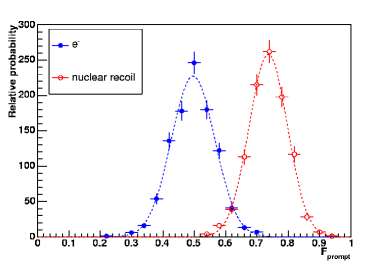
Assuming we have designed the experiment so that the backgrounds to the neutrinos after threshold and fiducial volume cuts are small, the dominant background to potential dark matter events will arise from the neutrinos themselves. In this case the ultimate sensitivity to dark matter will be limited by the expected dark matter interaction rate and the separability of dark matter events from neutrino events. The PMT time distribution can in principle be used to separate these classes of events, since the intrinsic scintillation time distribution is different for electron and nuclear recoils (see Table 2). The PMT time distribution predicted by the Monte-Carlo for 20 keV electron events and 80 keV nuclear recoil events from WIMP elastic scattering is shown in Fig. 20(a). These events would yield similar effective energy distributions due to the quenching of the scintillation light from nuclear recoils. To separate these classes of events, the ratio of prompt to total hits is calculated. These distributions are shown in Fig. 20(b). The effect of PMT noise is to decrease the prompt fraction.
We can now use these distributions to statistically separate nuclear recoils from electron events. The separation efficiency was estimated by generating 1000 MC datasets, each with 3000 solar neutrino events, corresponding to approximately one live year. We define the extended negative likelihood function
| (20) |
with and the probability distributions for shown in Fig. 20(b). We can then minimize equation 20 to find the most likely values of and . Since equation 20 is an extended likelihood, the parameter uncertainties can be calculated by finding the iso-likelihood contours which satisfy
| (21) |
and include the sampling uncertainties in our dataset, so that they include the uncertainties on deduced incident particle fluxes.
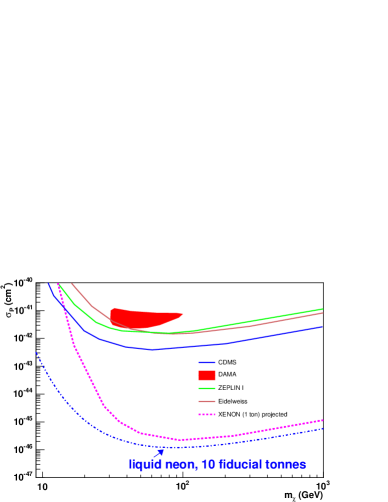
Equation 20 was minimized (with the ROOT TMinuit package [30]) for each of the 1000 simulated datasets. The fitted numbers of electron and WIMP events were found to peak at the input values, providing a check of signal analysis. The 90% CL upper limit on the number of WIMP events in the data set is estimated from this technique to be approximately 1.3 events, which provides background discrimination of approximately 0.9965. We can use this upper limit along with the predicted nuclear recoil rate from WIMP scattering (which is the convolution of equation 16 with the energy response function of Fig. 6, corrected for 25% quenching) to plot the sensitivity contour in WIMP-nucleus cross-section versus WIMP mass. This is shown in Fig. 23, along with current and projected experimental results. The limit corresponds to a WIMP-nucleon spin-independent cross section () of cm2 for a 100 GeV WIMP mass. Details on the selection of optimal analysis windows and cuts are provided in the following section.
6.3 Optimizing detector sensitivity
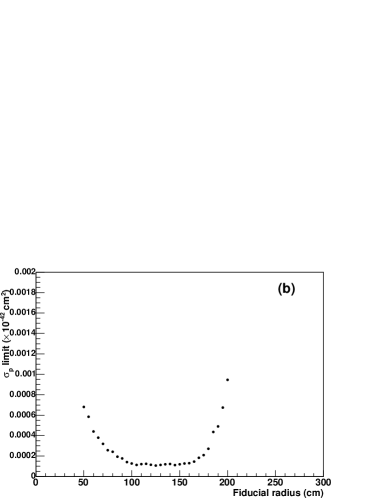
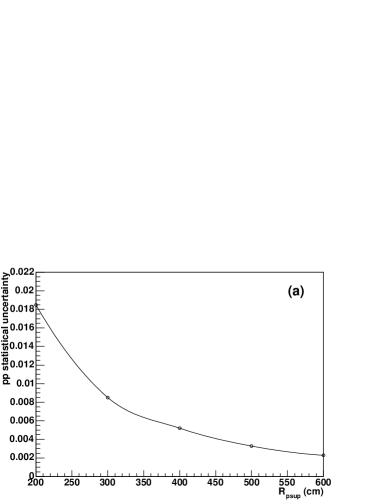
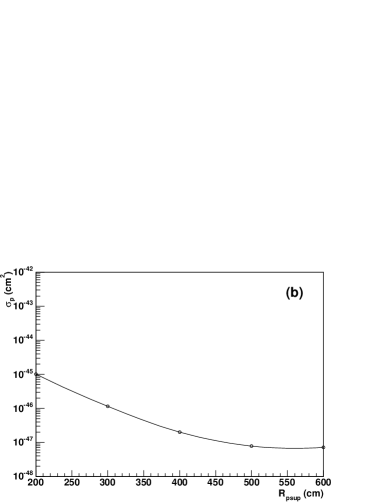
The optimal energy threshold and fiducial volume for the dark matter and experiment will in general be different, since the energy spectra of these two event classes differ. To simultaneously optimize the experiment for dark matter and neutrinos, an optimum fiducial volume and energy threshold are found for each by maximizing the total predicted event rate above threshold as a function of fiducial volume cut. It was found that an energy window of 15 keV above threshold provided the best WIMP sensitivity for a 100 GeV WIMP, and this window was employed throughout the analysis. Fig. 21 shows the determination of the optimal fiducial volume for neutrinos and dark matter for a 300 cm detector. It is found that the sensitivity for dark matter is optimized by selecting a smaller fiducial volume and thus a lower analysis threshold than for the solar neutrino analysis, since the energy spectrum of the WIMP interactions is much harder. The optimized thresholds and fiducial volumes, which are different for the dark matter and components of the experiment, have been used in the analysis. From Fig. 21(b), the relatively large region over which the dark matter sensitivity is optimized is due to a trade-off between a lower analysis threshold (for smaller fiducial radii) and better WIMP-neutrino separation with increasing analysis threshold (for larger fiducial radii). This effect can be used a systematics check on the data from the liquid neon experiment and allows some flexibility in ultimately determining the analysis cuts. The optimized sensitivities for the and dark matter experiments are shown versus detector size in Fig. 22. From this figure a 300 cm radius detector is found to provide good sensitivity for both measurements. Little additional sensitivity is found for detector sizes much larger than 400 cm in radii, since the measurements become limited by position resolution.
7 Detector calibration requirements
Assuming radioactive backgrounds to the flux measurement can be reduced such that they contribute less than uncertainty, the dominant systematic uncertainties will be due to uncertainty of the acceptance of the solar neutrino signal. These uncertainties will arise through uncertainty of the energy threshold and fiducial target mass. Table 8 outlines a nominal error budget assuming a target flux uncertainty of 1%, where the dominant systematic uncertainties are assumed to each contribute an equal 0.35% to the total uncertainty. The dominant fiducial mass (volume) uncertainty arises from uncertainty in the difference between the true and reconstructed radii of events. The fractional radial uncertainty is related to the fiducial target uncertainty by
| (22) |
The requirement of a 2.5 mm position uncertainty for a 200 cm fiducial volume will require a calibration source which can be positioned to that accuracy, an order of magnitude improvement over that currently achieved by SNO and similar experiments. This requirement could be relaxed if the overall uncertainty on the flux is allowed to increase, if other systematic uncertainties are lower than shown in Table 9, or if the statistical uncertainty is reduced by increasing detector livetime.
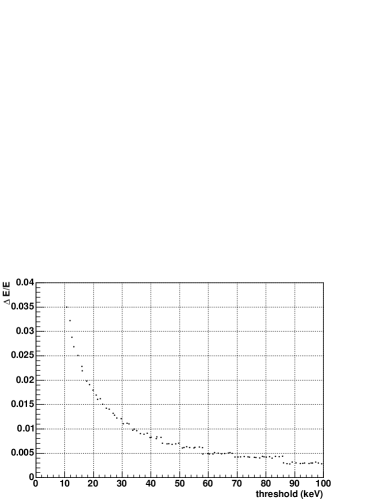
The uncertainty due to the absolute energy scale calibration can be evaluated by calculating the change in area of the spectrum of Fig. 12(b) when the threshold changes by one standard error. The minimum threshold uncertainty versus threshold is shown in Fig. 24 for the target flux systematic uncertainty due to energy scale calibration of . Shown in Table 9 are the requirements for calibration of the absolute energy scale (near threshold) and the position reconstruction offset for a resultant uncertainty on the flux, assuming a 35 keV threshold. It is interesting to note that a large scintillation yield versus neon temperature dependence [approx (/K)] is found in [7], which leads to the requirement that the neon be temperature stable at the level of T mK to satistify the requirements of Table 9.
The calibration requirements for the dark matter component of the experiment are much less stringent. Fiducial volume uncertainties of a few percent achieved by current generation experiments are adequate. An uncertainty of 20-30% in the energy scale calibration for nuclear recoil events near the threshold ( 10 keV) leads to a factor of two change in the deduced WIMP cross-section, and will be achievable with calibration by a neutron source.
| Source | Relative uncert. |
|---|---|
| statistics | 0.7 |
| energy scale | 0.35 |
| vertex accuracy | 0.35 |
| uranium background | 0.35 |
| thorium background | 0.35 |
| krypton background | 0.35 |
| total | 1.0 |
| energy scale (E/E) | |
| vertex accuracy (R/R) | |
| vertex accuracy (at R=200 cm) | 2.5 mm |
8 Design criteria
Table 10 summarizes measurements which must be made to allow for an optimized design of a liquid neon neutrino and dark matter experiment. An “X” in either the dark matter or neutrino column denotes the measurement primarily affects this component of the experiment. Dependence of the ultimate detector sensitivity on these parameters is discussed in the following sections.
| Response | Dark matter | Solar |
|---|---|---|
| e- scint. yield | X | X |
| e- scint. prompt/late ratio | X | |
| Scintillation yield linearity | X | X |
| nucleus scint. yield | X | |
| nucleus scint. prompt/late ratio | X | |
| late WS time constant | X | |
| Rayleigh scattering | ||
| absorption length | X | X |
| neon temperature stability | X | |
| PMT long-term stability | X | X |
| PMT QE | X | X |
| PMT threshold | X | X |
| PMT dark noise | X | X |
8.1 Photon absorption in liquid neon
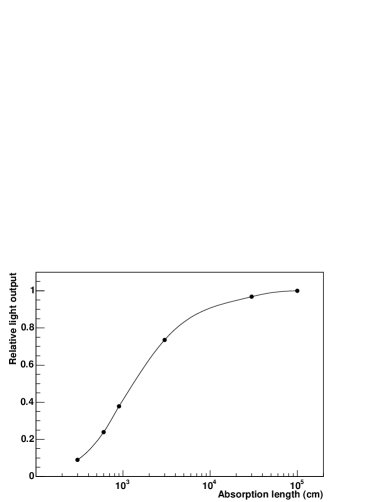
Absorption of the primary scintillation photons in the liquid neon will both reduce the total light output and introduce systematic effects related to event position and direction. To estimate the effects of absorption on total light output, a set of Monte-Carlo calculations were performed for a range of photon absorption lengths. Fig. 25 shows the light output (relative to no absorption) for scintillation events at the center of a 300 cm radius detector for absorption lengths ranging from 100 to 105 cm. The effect of the 60 cm Rayleigh scattering length is to greatly increase the optical path length for photons, and thus decrease the tolerable amount of absorption. To obtain a relative light yield of 95%, an absorption length of approximately 300 m is required.
The absorption coefficient () for scintillation photons can be estimated by adding the absorption coefficients for the various absorbers present in the liquid:
| (23) |
where
| Molar mass of absorber | ||||
| liquid neon density | ||||
| Avogadro’s constant | ||||
| Mass fraction of absorber | ||||
| absorption cross section |
If we assume the absorption is equally divided among N absorbing materials444This is likely an oversimplification since some materials will pose more of a problem than others, but this nonetheless provides an estimate of the tolerable contaminations., we can set the mass fraction limit () for each absorber:
| (24) |
Neon has no significant absorption for photons with wavelengths above the first ionization limit at 575 nm, and so is transparent to its scintillation light [32]. A comprehensive list of photo absorption cross-sections has been compiled by Gallagher et. al. [33]. Shown in Table 11 is a list of dominant absorbers present in neon, along with the cross-sections for photo absorption of 80 nm photons from [33], and the required impurity limits for a total photon absorption length of 300 m. These levels are moderate compared to that required for 85Kr, and most impurities are expected to be easily removed from the neon through the use of cold traps. The problem of hydrogen diffusion into the neon is expected to be mitigated by the very low diffusion rate at liquid neon temperature.
| Absorber | Cross section at 80 nm | |
|---|---|---|
| ( cm2) | () | |
| H2 | 10.5 | 2.2 |
| H2O | 21 | 9.8 |
| N2 | 12 | 26.8 |
| O2 | 17 | 21.6 |
8.2 Dependence on optical and detector parameters
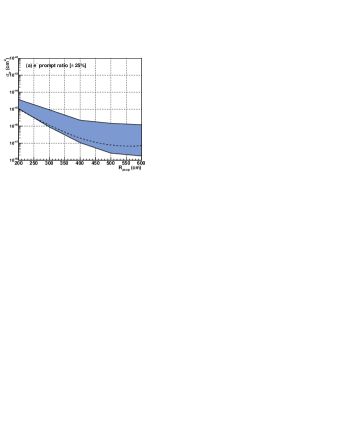
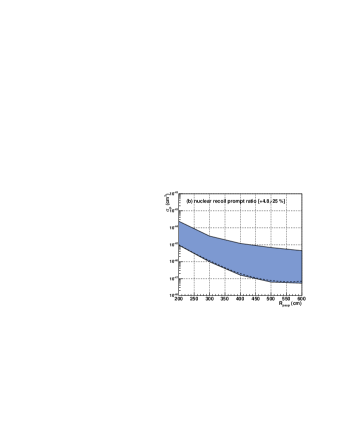
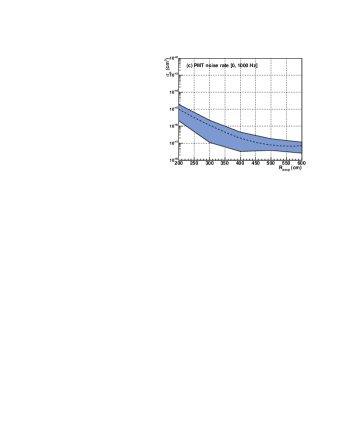
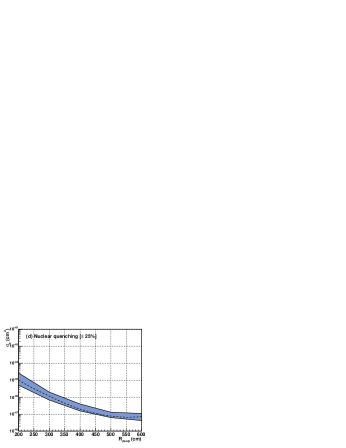
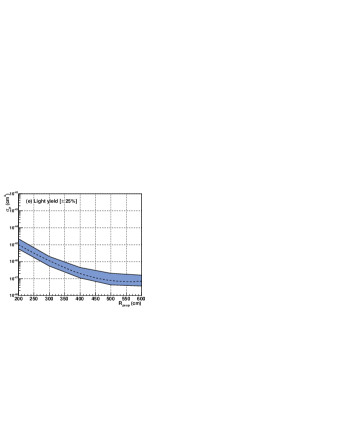
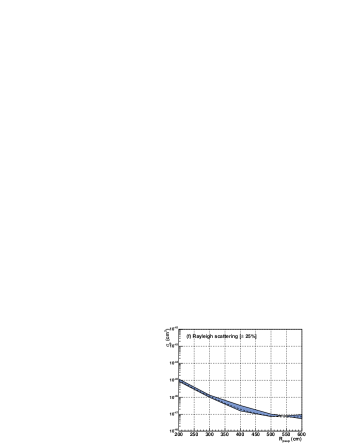
Many of the parameters shown in Tables 1 and 2 are either estimates inferred from other measurements or have not been quantified with systematic uncertainties. The sensitivity of the solar neutrino measurement to these parameters is quite modest. To study the sensitivity of the dark matter experiment to these inputs, a set of Monte-Carlo calculations were performed by varying the parameters which will affect the detector performance by a nominal amount ( in most cases, or a physical bound). Figure 26 shows the deduced sensitivity for a 100 GeV WIMP versus detector size, for the ranges of optical and detector parameters of interest. This provides a benchmark for the required accuracy with which these parameters need to be measured, and points out the parameters to which we are most sensitive. The prompt to total light yield for electrons and nuclear recoil events provide separation between these two classes of events, and are found to be the dominant factors in determining the ultimate WIMP sensitivity. It is interesting to note that the WIMP sensitivity varies only weakly with total light yield, nuclear recoil quenching factor, and the Rayleigh scattering. This is somewhat fortuitous since measuring these absolute quantities experimentally in the laboratory with high precision is difficult. Experiments are currently underway at Los Alamos National Laboratory and Yale University to measure these properties.
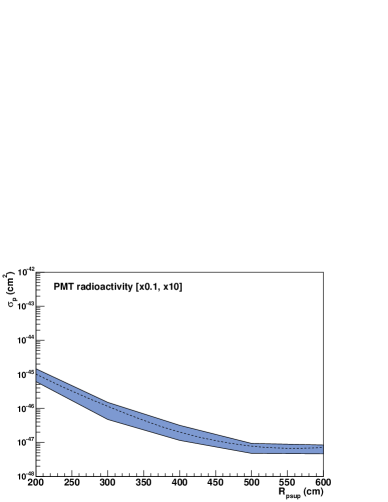
Figure 27 shows the effect of changing the total PMT radioactivity by one order of magnitude from the nominal values for PMTs with commercially available ultra-low background glass. This is found to also have a relatively small effect on the estimated WIMP sensitivity.
9 Discussion
In summary, we have demonstrated the possibility for a simultaneous dark matter and neutrino experiment using liquid neon, assuming nominal scintillation characteristics and background contamination levels with detailed Monte-Carlo calculations. This approach to direct dark matter detection has the advantage that WIMP event discrimination is based only on PMT signals, allowing for a simple detector design which can in principle be scaled to a very large target mass. This detector design also has the potential advantage that external sources of background are now well-separated from the inner target material, and can be dealt with through position reconstruction. Assuming light attenuation and internal source radioactive backgrounds can be controlled, the large target mass achievable with neon may lead to the best sensitivity of any of the direct dark matter searches. We have shown that form factor suppression for high-A target nuclei leads to less of an advantage over lower-A target nuclei than that expected by the cross-section coherence alone. A specific list of issues which must be addressed in order to determine the ultimate detector sensitivity has been provided. An experimental program is underway to address these issues.
Acknowledgments
This work was supported with funds from the Los Alamos Directed Research and Development (LDRD) program.
References
- [1] D.N. McKinsey and J.M. Doyle. Journal of Low Temperature Physics, 118:153, 2000.
- [2] S. Agostinelli et al. Nucl. Instr. and Meth., A506:250–303, 2003.
- [3] A. Levin and C. Moisan. A more physical approach to model the surface treatment of scintillation counters and its implementation into detect. In Proceedings of IEEE, Nuclear Science Symposium, Anaheim, November 2-4, 1996.
- [4] The short singlet lifetime has not been accurately determined for neon. Value assumed in simulation is based on measurements with liquid argon, krypton, and xenon. See Shinzou Kubota, Masahiko Hishida and Jian-zhi Raun(Gen), J. Phys. C. 11, 1978.
- [5] Tohru Suemoto and Hiroshi Kanzaki. Journal of the Physical Society of Japan, 46(5).
- [6] Akira Hitachi, Tan Takahashi, Nobutaka Funayama, et al. Phys. Rev. B, 27(9):5279–5285.
- [7] R.A. Michniak, R. Alleaume, D.N. McKinsey, and J.M. Doyle. Nucl. Instr. and Meth., A482:387–394, 2002.
- [8] ”Icosahedron points from http://www.research.att.com/ njas/icosahedral/codes”.
- [9] See http://www.electron-tubes.co.uk/pmts/pmtneut.html.
- [10] Electron Tubes Inc., private communication. Similar tubes have been operated at liquid argon temperatures by the ICARUS collaboration.
- [11] Low Temperature Photomultipliers, Electron Tubes Inc., Oct 2001.
- [12] Richard E. Packard, F. Reif, and C.M. Surko. Phys. Rev. Lett., 25:1435, 1970.
- [13] G.M. Seidel, R.E. Lanou, and W. Yao. Nucl. Instr. Meth., A489:189–194, 2002.
- [14] J.S. Adams, Y.H. Kim, R.E. Lanou, H.J. Maris, and G.M. Seidel. Journal of Low Temperature Physics, 113(5,6):1121, 1998.
- [15] R.E. Lanou. TAUP conference, September 5-9 2003, Seattle, Washington.
- [16] The results from [7] have been renormalized to a new measurement of scintillation yield in helium [15].
- [17] D.N. McKinsey, C.R. Brome, J.S. Butterworth, et al. Nucl. Instr. and Meth., B132:351–358, 1997.
- [18] K.J. Coakley and D.N. McKinsey. Nucl. Instr. and Meth., A522(3):504–520, 2004.
- [19] John N. Bahcall. Neutrino Astrophysics. 1989.
- [20] M.H. Pinsonneault John N. Bahcall and Sarbani Basu. Astrophysical Journal, 555:990–1012, 2001.
- [21] S.N. Ahmed et al. Phys. Rev. Lett., 92:181301, 2004.
- [22] S.Y.F. Chu, L.P. Ekstrom, and R.B. Firestone. WWW Table of Radioactive Isotopes, Version 2.0, February 1999, LBNL, Berkeley, USA.
- [23] BOREXINO Collaboration. Astroparticle Physics, 18:1–25, 2002.
- [24] Vidali et al. Surface Science Reports, 12:133, 1991.
- [25] Dongming Mei, private communication (to be published).
- [26] G. Jungman, M. Kamionkowski, and K. Griest. Physics Reports, 267:195–373, 1996.
- [27] J.D. Lewin and P.F. Smith. Astroparticle Physics, 6:87–112, 1996.
- [28] G. Mignola A. Bottino, F. Donato et al. Phys. Lett., B402:113–121, 1997.
- [29] CDMS Collaboration. Phys. Rev. D, 66:122003, 2002.
- [30] ROOT: An Object-Oriented Data Analysis Framework, http://root.cern.ch.
- [31] Rick Gaitskell and Vuk Mandic. Direct Detection of WIMP Dark Mater, Sensitivity Plots …An interactive plotter for experimental and theoretical data. http://dmtools.berkeley.edu/limitplots/.
- [32] Po Lee and G. L. Weissler. Proc. Roy. Soc. (London), 220, 1953.
- [33] J. W. Gallagher, C. E. Brion, J.A.R. Samson, and P.W. Langhoff. J. Phys. Chem. Ref. Data, 17(1), 1988.