Centrality and Dependence of the and in Heavy Ion Collisions at Mid-rapidity
Abstract
The PHENIX experiment at RHIC has measured transverse energy and charged particle multiplicity at mid-rapidity in collisions at = 19.6, 130, 62.4 and 200 GeV as a function of centrality. The presented results are compared to measurements from other RHIC experiments, and experiments at lower energies. The dependence of and per pair of participants is consistent with logarithmic scaling for the most central events. The centrality dependence of and is similar at all measured incident energies. At RHIC energies the ratio of transverse energy per charged particle was found independent of centrality and growing slowly with . A survey of comparisons between the data and available theoretical models is also presented.
1 Introduction
The PHENIX experiment at the Relativistic Heavy Ion Collider (RHIC) at Brookhaven National Laboratory was designed to measure the properties of matter at extremely high temperatures and densities. Under such conditions, there is possibility to produce states of matter that have yet to be observed or studied in the laboratory. The best known of these is the quark-gluon plasma (QGP), a form of matter where quarks are not confined within individual baryons but exist as some form of plasma of individual quarks and gluons. It should be emphasized that the exact properties of this matter are not known and that the characterization of the deconfined state, if such a state is produced, is an essential part of the RHIC program.
One fundamental element of the study of ultrarelativistic collisions is the characterization of the interaction in terms of variables such as the energy produced transverse to the beam direction and the number of charged particles. These two variables are closely related to the collision geometry and are important in understanding global properties of the system during the collision.
This paper describes a systematic study of and at mid-rapidity222Also referred as and in this paper. by the PHENIX experiment at center-of-mass energies = 19.6, 130, 62.4 and 200 GeV. The centrality dependence of and is characterized by the number of participants, determined with a Glauber model, and is studied as function of the incident energy. and results for all four RHIC measurements are included as part of this study. The data taken at 19.6 GeV is particularly interesting because it allows a close comparison to the lower energies of the CERN SPS program. Comparisons are also made to previous experiments at the Brookhaven AGS and CERN SPS at center-of-mass energies of 4.8 GeV, 8.7 GeV, and 17.2 GeV. Finally, an extensive set of collision models describing the and distributions are compared to the existing data.
2 PHENIX detector and Analysis
PHENIX is one of four experiments located at RHIC [2]. The PHENIX detector consists of two central spectrometer arms, designated east and west for their location relative to the interaction region, and two muon spectrometers, similarly called north and south. Each central spectrometer arm covers a rapidity range of and subtends in azimuth. The muon spectrometers both have full azimuthal coverage with a rapidity ranges of (south) and (north). Additional global detectors are used as inputs to the trigger and for global event characterization such as vertex, time of event and centrality determination. A detailed description of the PHENIX detector can be found in [3].
The PHENIX detector subsystems relevant for the physics analysis published here are: the Pad Chambers used for the charged particle multiplicity measurement, the Electromagnetic Calorimeter used to measure transverse energy, the Beam-Beam Counter and the Zero Degree Calorimeter, the two detectors used for triggering and centrality determination are described in publications [4, 5, 6, 7].
The analysis procedures to measure and are described in details in publications [10, 11, 12, 13]. Some additional information concerning the analysis at = 19.6 GeV can be found in [1]. The preliminary results on at = 62.4 GeV use the same technique as implemented at other energies.
For the sake of space we only mention errors relevant to the analyses. Statistical errors are small and do not exceed 1% of the measured value. The systematic errors are summarized in Table 2. The errors for the lowest and the highest incident energy are listed, whereas at all other energies the are close to these values. The systematic errors for both measured values are of two types. The first type affects the centrality dependence. It is listed in the Table 2 with the range (first number corresponds to the most central bin). Errors of the second type contribute to the overall scaling of the data. In the figures below the centrality dependent errors are shown as a corridor, and the the full systematic error is shown with the error bars333Here and everywhere errors correspond to one standard deviation.. Centrality related errors are common to both measured quantities.
| \br | ||||
|---|---|---|---|---|
| [GeV] | 19.6 | 200 | 19.6 | 200 |
| \mrEnergy resp. | 4.7 | 3.9 | ||
| Bkg. / noise | 0.5-3.5 | 0.2-6 | 1.0 | 1.0 |
| Acceptance | 2.0 | 2.0 | 2.3 | 2.3 |
| In- & outflow | 3.0 | 3.0 | 5.7 | 2.9 |
| Occupancy | 1.6-0.3 | 3.5-0.1 | ||
| Centrality | 2.0 | 0.5 | same | |
| 2.9-6.7 | 2.8-15. | same | ||
| Trigger | 0.4-8.8 | 0.3-16. | same | |
| \br | ||||
3 Results
3.1 PHENIX results
The distribution of the raw transverse energy, , into the fiducial aperture of two EMCal sectors is shown in the left three panels of Fig. 1 for three RHIC energies = 19.6, 130 and 200 GeV. The lower scale corresponds to the fully corrected normalized to one unit of pseudorapidity and full azimuthal acceptance. The lower axis in the plot is not labeled beyond 200 GeV to avoid confusion between the true shape of the distribution and as measured using the limited acceptance of two EMCal sectors.
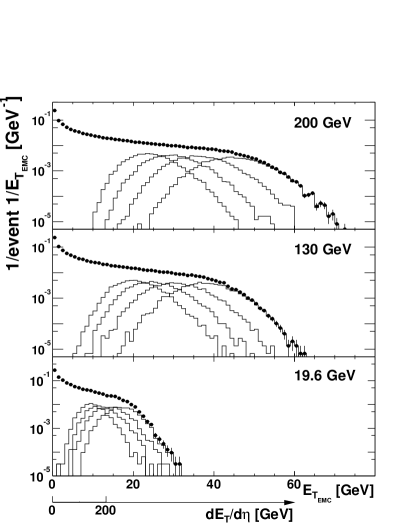
Two EMCal sectors each with azimuthal coverage were used to make a measurement at = 130 GeV. At other energies we used five EMCal sectors. Results obtained with different numbers of sectors at the same energy are consistent within 1.5%.
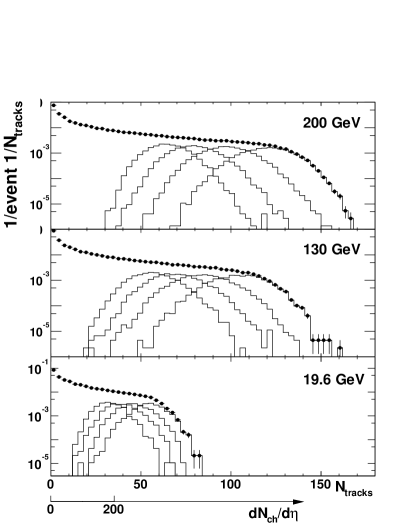
The right three panels in Fig. 1 show the number of tracks reconstructed in the east arm of the PHENIX detector after the background subtraction and all other corrections. The lower axis corresponds to measured distributions normalized to one unit of pseudorapidity and full azimuthal acceptance. For a similar reason as for the , the lower axis is not labeled above 200 GeV in .
For the measurements at = 130 GeV, only the east arm was used, while for the other energies the measurements were made using both PHENIX central arms. The results obtained with two arms at = 200, 62.4, and 19.6 GeV are consistent with each other within 1.5%.
The distributions shown in Fig. 1 have a characteristic shape with a sharp peak that corresponds to the most peripheral events. Missing events caused by the finite MB trigger efficiency in peripheral events would make this peak even sharper than measured. The plateau in all distributions corresponds to mid-central events and the fall-off to the most central events. The shape of the curves in Fig. 1 in the fall-off region is a product of the intrinsic fluctuations of the measured quantities and the limited acceptance of the detector.
The distributions for the four most central bins 0%-5% to 15%-20% are also shown in each panel. The centroids of these distributions are used to calculate the centrality dependence of and 444All plotted and quoted numbers correspond to the centrality bin-by-bin average values or ratios of corresponding averages.. The statistical uncertainty of the mean values (less than or about 1%) determined by the width of the distributions are small because of the large size of the event samples.
The magnitude of at mid-rapidity divided by the number of participant pairs as a function of is shown in Fig. 2. The right three panels show the same ratio for at three RHIC energies.
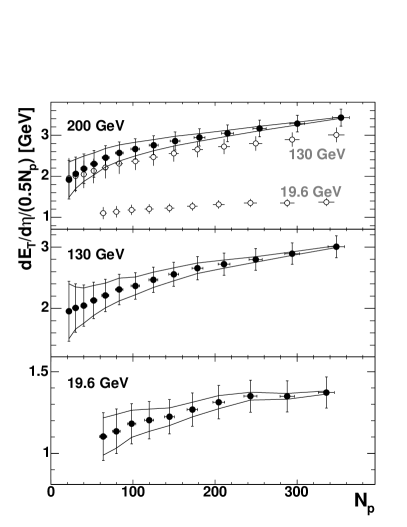
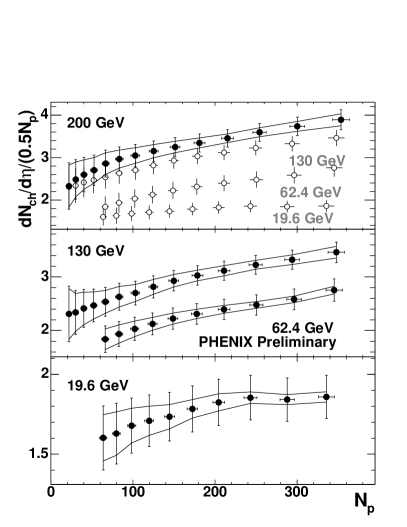
The horizontal errors correspond to the uncertainty in , determined within the framework of the Monte Carlo Glauber model. The vertical bars show the full systematic errors of the measurements added quadratically to the errors of . The lines denote the corridor in which the points can be inclined or bent. The statistical errors are smaller than the size of the markers. The upper panel also shows the results of the two lower panels with open markers for comparison.
An important result for Fig. 2 is the consistency evident in the behavior of the centrality curves of shown on the left and shown on the right for all measured energies. Both values demonstrate an increase from peripheral (65%-70%) to the most central events by (50-70)% at RHIC energies =130 GeV and 200 GeV. For the lowest RHIC energy (=19.6 GeV) this increase is at the level of systematic uncertainties of the measurement. One can note that results from PHOBOS [50], show that the total charged particle multiplicity is proportional to while the multiplicity at mid-rapidity over increases with , indicating that the pseudorapidity distribution gets more narrow for central events. Figure 2 also show the PHENIX preliminary result for at = 62.4 GeV added to the central panel.
The ratios of the and per participant pair measured at different RHIC energies are shown in Fig. 3. In these ratios some common systematic errors cancel.
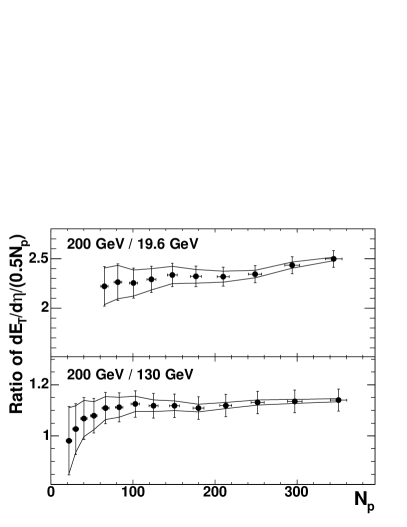
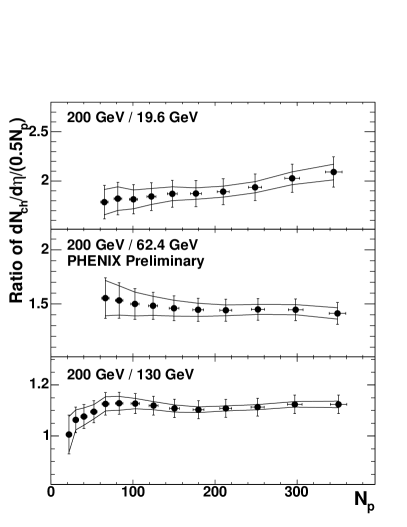
The increase in the production between 19.6 GeV and 200 GeV (with an average factor of 2.3) is larger than for (with average factor of 1.9). This is consistent with an increase in the particle production per participant common to both and and a 20% increase in of produced particles contributing to the parameter only.
The ratio of 200 GeV/19.6 GeV shows an increase from peripheral to central events; however the increase is marginal in comparison to the systematic errors of the measurement.
The ratio of 200 GeV/130 GeV is flat above 80 and is equal to for and for in the most central bin. A rather sharp increase in the ratios of both quantities between =22 and 83 in the ratios of both quantities is still at the level of systematic uncertainties.
The preliminary ratio of 200 GeV/62.4 GeV although shows the decrease with which is within the systematic errors. The increase in the particle production between these two energies is about 40%.
The ratio of the transverse energy and charged particle multiplicity at mid-rapidity as a function of centrality is shown in Fig. 4 for the three energies. The upper plot also shows the results displayed in the lower panels for comparison.

The ratio 555 is used as a shortcut for at in C.M.S.., sometimes called the “Global Barometric Observable”, triggered considerable discussion [28, 29]. It is related to the of the produced particles and is observed to be almost independent of centrality and incident energy of the collisions within the systematic errors of the previous measurements. The present paper forges a direct link between the highest SPS and lowest RHIC energies, making a more quantitative study of possible.
The results presented in Fig. 4 show that the centrality dependence of is weak and lies within the systematic errors plotted with lines. There is a clear increase in between =19.6 GeV and 200 GeV. The dependence of the results is discussed below.
3.2 Bjorken Energy Density
The Bjorken energy density [30] can be obtained using
| (1) |
where is the formation time and is the nuclei transverse overlap area.
The transverse overlap area of two colliding nuclei was estimated using a Monte Carlo Glauber model , where and are the widths of and position distributions of the participating nucleons in the transverse plane. The normalization to , where is the sum of and parameters in a Woods-Saxon parameterization (see e.g.: [1]), was done for the most central collisions at the impact parameter .
For the transformation from to , a scale factor of was used, see [1] for the details of conversion procedure.
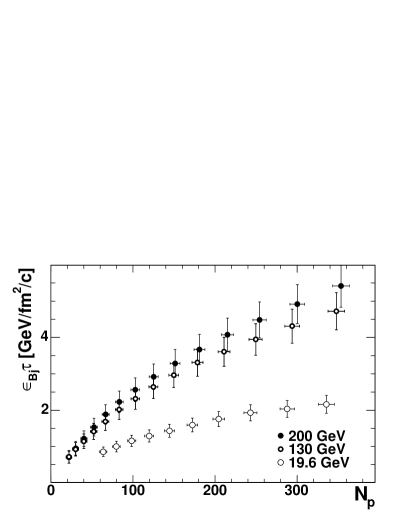
The Bjorken energy density for three RHIC energies is plotted in the left panel of Fig. 5. For the 5% most central collisions, was , and GeV/() for =19.6, 130 and 200 GeV, respectively. These values increase by 2%, 4% and 5%, respectively, for the maximal =394, as obtained from extrapolation of PHENIX data points. There is a factor of 2.6 increase between the “SPS”-like energy ( =19.6 GeV) and the top RHIC energy =200 GeV. The comparison of the only published =3.2 GeV/ at SPS [31] and top RHIC energies, assuming the same =1 fm/c, reveals an increase in energy density by a factor of only 1.8, which may come from an overestimation in the SPS measurement, as shown in the left panel of Fig. 10 below.
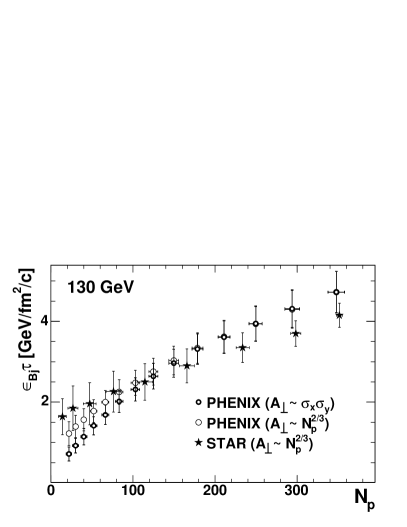
Another approach is used by STAR in [38] for the estimate of the transverse overlap area of the two nuclei in Eq. 1. This approach accounts only for the common area of colliding nucleons, not nuclei. The results differ only in the peripheral bins as shown in the right panel of Fig. 5. For a comparison, the same panel shows the result obtained by STAR which agrees with PHENIX result within systematic errors, displaying a smaller increase of the energy density with .
Can we derive an estimate for ? We might say, on general quantum mechanical grounds, that a particle of full energy close to can be considered to have “formed” after a time since its creation in that frame.
To estimate the average transverse mass, we use the final-state results presented in Fig. 4. As it was mentioned above, this value is basically independent of centrality and changes from 0.74 GeV to 0.88 GeV for from 19.6 to 200 GeV. Such estimate would provide us with the formation time which is almost the same for all initial conditions of the collisions at RHIC.
An approximate factor of 2/3 is used to account for the total number of particles making the estimate of 0.57 GeV at =200 GeV and 130 GeV and 0.50 GeV at =19.5 GeV. This results in a formation time of 0.35 and 0.40 at these energies respectively. Then for the 5% most central events the estimate of the Bjorken energy at the three RHIC energies are 5.5 GeV/, 13 GeV/ and 15 GeV/.
3.3 Comparison to other measurements
Several factors complicate the comparison between the results of PHENIX and the results of other experiments. AGS and SPS data were taken in the Laboratory (Lab.) system while the RHIC data are in the Center of Mass (C.M.S.) system. Since and are not boost invariant quantities, the data should be converted into the same coordinate system. Some experiments provide a complete set of identified particle spectra from which information about and can be deduced, while other experiments require additional assumptions to extract and from their results. Publication [1] discusses it in details
The PHENIX results for are compared to the data available from the other RHIC experiments. This comparison is shown in the left panels of Fig. 6.
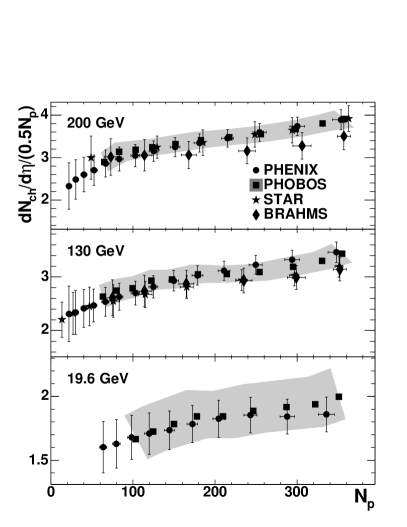
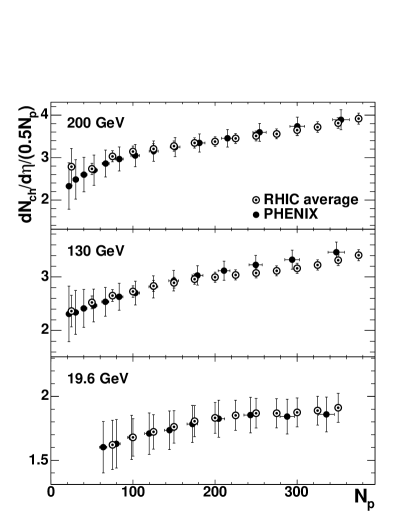
There is good agreement between the results of BRAHMS [39, 40], PHENIX, PHOBOS [41, 42, 43] and STAR [44, 45] using based on a Monte-Carlo Glauber model. This agreement is very impressive because all four experiments use different apparatuses and techniques to measure the charged particle production. The systematic errors of all results are uncorrelated, except for errors due to the same Glauber model which are small. That makes it possible to calculate the RHIC average and reduce the systematic uncertainty. The averaged results from all four RHIC experiments are plotted in the right panel of Fig. 6. The procedure of the calculating the average is the same as used in [21] and is also explained in [1].
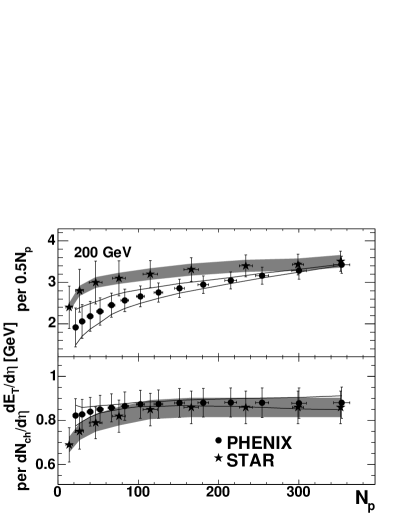
Figure 7 compares results from the PHENIX and STAR [46] experiments. The results are consistent for all centralities within systematic errors, though STAR per participant pair as shown in the upper panel has a smaller slope for in going from from semi-peripheral to central collisions and shown in the lower panel is consistent for all .
The RHIC run at =19.6 GeV allows us to make a connection between RHIC and SPS data. The highest SPS energy of 158A GeV corresponds to = 17.2 GeV in the C.M.S., making a direct comparison of RHIC and SPS results possible. This comparison is shown in Fig. 8. The SPS data is taken from [18, 19, 20, 26, 68, 48] details of the data compilation are explained in [1].
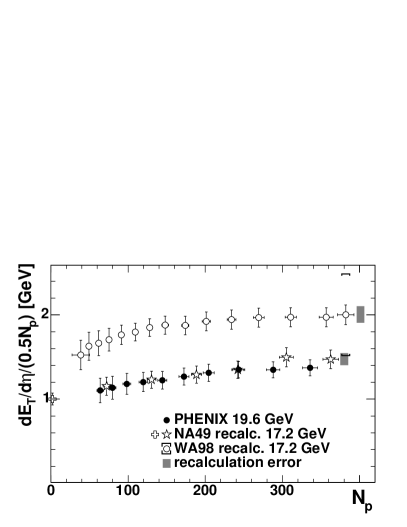
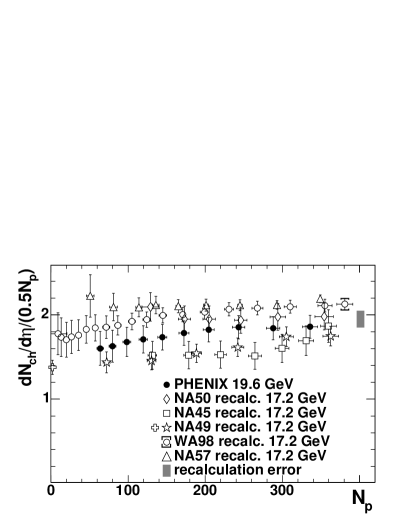
Several comments should be made about this comparison. For both measured parameters the PHENIX results and the SPS results agree. The WA98 results are systematically higher, especially for . However the WA98 data has an additional systematic error common to all points shown for the last bin. For the relative spread of the SPS results is larger than for the RHIC results shown in Fig. 6, though overall the =17.2 GeV SPS measurements are consistent with the PHENIX result at = 19.6 GeV. The NA57 results at this energy and at lower energy are published without systematic errors [49], so they cannot be compared to other results on the same basis.
Different SPS and AGS experiments made measurements at lower energies. The combined data of AGS, SPS and RHIC provide a complete picture of the centrality behavior of and as a function of the nucleon-nucleon energy. The centrality dependence of at mid-rapidity measured at =4.8, 8.7 and 17.2 GeV by different experiments is shown in Fig. 9. The data is taken form [19, 20, 47, 48, 69, 70, 71, 72, 73, 74, 75] and the details of data compilation can be found in [1].
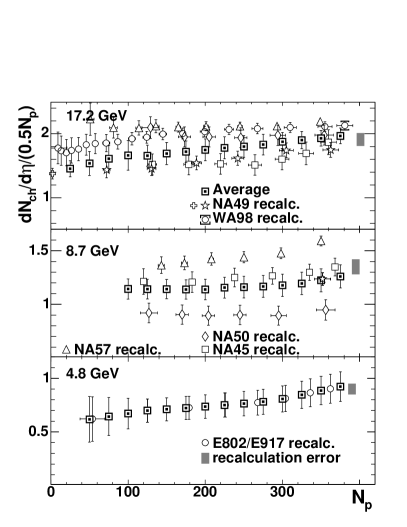
At the highest SPS energy the averaging procedure is the same as for RHIC energies and weighted experimental errors are scaled with the reduced -like factor reaching the value of 1.5 at some points. For the intermediate SPS energy =8.7 GeV, two experiments NA45 [47] and NA50 [48] reported the centrality dependence of at mid-rapidity. The discrepancy in the measurements is approximately three times the quadratic sum of their systematic errors. However the shapes of the two curves are almost the same. NA49 has published results [19, 20] which give one point in at =352. This point favors the NA45 result. The NA57 results [49] also plotted in the Fig. 9 demonstrate even larger discrepancy with the NA50 measurements, but these points lack the systematic errors, as we mentioned before.
The average centrality curve is produced by taking into account the shape of the centrality curves reported by NA45 and NA50 and the single NA49 point. The errors are scaled with the factor , which reaches a value of 2.5 at some points. The AGS results are presented with a curve produced from the combined results of the E802/E917 experiments (see publication [1]).
The average SPS centrality dependence at = 17.2 GeV shown in the upper panel in Fig. 9 and the average curve of the two RHIC experiments at =19.6 GeV shown in the lower panel in Fig. 6 are very similar. Less than 5% increase is expected due to the difference in the incident energies between the highest SPS and the lowest RHIC energies (see section 3.4.1 below).
| \br | 200 GeV | 130 GeV | 62.4 GeV | 19.6 GeV | 17.2 GeV | 8.7 GeV | 4.8 GeV |
|---|---|---|---|---|---|---|---|
| RHIC | RHIC | PHENIX | PHENIX/ | SPS | SPS | E806/E917 | |
| aver. | aver. | prelim. | PHOBOS | aver. | aver. | combined | |
| \mr375 | 3.920.13 | 3.410.10 | 1.970.12 | 1.260.11 | 0.920.14 | ||
| 350 | 3.810.13 | 3.310.10 | 2.770.21 | 1.910.11 | 1.930.12 | 1.220.11 | 0.890.13 |
| 325 | 3.720.12 | 3.220.10 | 2.680.20 | 1.890.11 | 1.900.14 | 1.200.11 | 0.850.13 |
| 300 | 3.650.12 | 3.160.10 | 2.600.20 | 1.880.11 | 1.880.15 | 1.180.10 | 0.810.12 |
| 275 | 3.560.12 | 3.110.09 | 2.540.19 | 1.870.11 | 1.830.16 | 1.170.10 | 0.780.12 |
| 250 | 3.510.12 | 3.070.09 | 2.480.19 | 1.870.12 | 1.800.17 | 1.160.10 | 0.760.11 |
| 225 | 3.450.12 | 3.040.10 | 2.430.19 | 1.850.12 | 1.780.17 | 1.160.10 | 0.750.11 |
| 200 | 3.380.11 | 3.000.09 | 2.370.19 | 1.830.12 | 1.750.17 | 1.140.10 | 0.740.11 |
| 175 | 3.340.12 | 2.960.10 | 2.300.19 | 1.810.12 | 1.720.17 | 1.140.09 | 0.720.11 |
| 150 | 3.270.12 | 2.890.10 | 2.230.20 | 1.760.13 | 1.690.17 | 1.140.09 | 0.710.11 |
| 125 | 3.200.12 | 2.830.10 | 2.130.20 | 1.720.14 | 1.660.16 | 1.140.09 | 0.700.11 |
| 100 | 3.140.13 | 2.730.11 | 2.020.22 | 1.680.15 | 1.660.23 | 1.140.09 | 0.670.14 |
| 75 | 3.030.13 | 2.650.11 | 1.890.24 | 1.620.19 | 1.610.21 | 0.640.18 | |
| 50 | 2.730.13 | 2.530.12 | 1.540.19 | 0.630.21 | |||
| 25 | 2.780.43 | 2.360.30 | 1.450.13 | ||||
| \br |
3.4 Dependence on the incident nucleon energy.
The data compilation made in the previous section allows for a detailed study of the charged particle production in heavy ion reactions at different incident energies of colliding nuclei. Although the data on transverse energy production is not abundant, a similar comparison can be made [10, 11].
3.4.1 Central Collisions
Figure 10 shows the energy dependence for the and production per pair of participants in the most central collisions measured by different experiments. See [1] for the details of the data compilation.
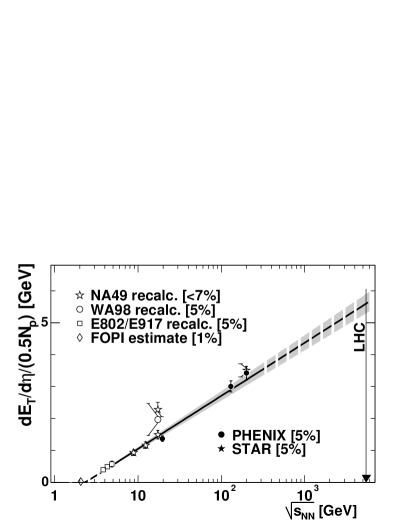
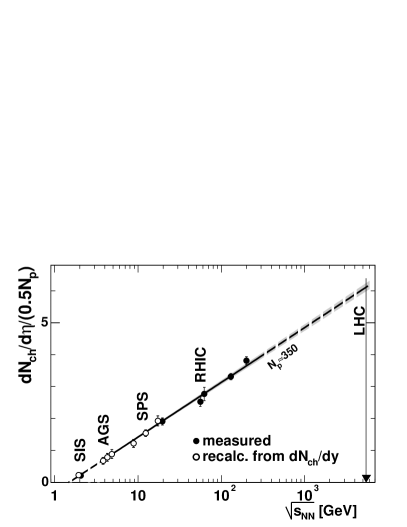
The results shown in Fig. 10 are consistent with logarithmic scaling as described in [10, 13, 12]. Use of the logarithmic function is phenomenological and is suggested by the trend of the data in the range of available measurements. The agreement of the fits with the data in both panels is very good, especially in the right panel where the averaged values are used for =350. The single point of NA49 [31] is excluded from the fit. The results of the fit are: for GeV and GeV for GeV and .
The parameter =2.35 GeV obtained from the fit is slightly above, although within 3 from the minimum possible value of = =1.86 GeV. The measurement closest to it at = 2.05 GeV done by the FOPI experiment allows to estimate the amount of produced to be 5.0 GeV in the most central collisions corresponding to =359. Publication [1] gives details of the estimate. This does not disagree with the extrapolation of the fit but does indicate that the logarithmic parameterization requires higher order terms to describe how the production starts at very low .
The right panel of Fig. 10 shows the logarithmic fit to the data. It agrees well with all results plotted for =350. Unlike that for , the fit parameter for is 1.480.02 GeV which is lower than the minimum allowed . This suggests that above the production as a function of should undergo threshold-like behavior, unlike the production which must approach zero smoothly due to energy conservation.
The FOPI measurement at =1.94 GeV and 2.05 GeV agrees with the extrapolation of the fit at energy very close to . It is an interesting result that colliding nuclei with kinetic energies of 0.037 GeV and 0.095 GeV per nucleon in the C.M.S. follow the same particle production trend as seen at AGS, SPS and RHIC energies.
A fit to the charged particle multiplicity shows a factor of 2.2 increase in per participant in the most central events from the highest energy at the AGS ( =4.8 GeV) to the highest energy at the SPS ( =17.2 GeV) and a factor of 2.0 from the highest SPS energy to the highest RHIC energy ( =200 GeV). Assuming the same behavior extends to the LHC highest energy =5500 GeV one would expect = and the increase in particle production from the highest RHIC energy to be 60% for the most central events. With the greater energy, the rapidity width should increase by 60% i.e. the total charged particle multiplicity would increase by a factor of 2.6 from the top RHIC energy.
It is interesting to compare the dependence shown in Fig. 10 to the similar plot for vs. published in [32]. In Fig.4 of that publication the energy dependence of for =350 changes the slope between AGS and lower SPS energy. That is not seen in Fig. 10. The parameterization suggested in publication [32], is also different from the logarithmic scaling in Fig. 10. Although quantities in these two figures are not identical, some contribution to the shape of the curve in Fig.4 in [32] may be due to use of logarithmic scale on Y-axis, producing a bend-like shape out of straight line in a linear scale.
The ratio of for the most central bin as a function of is shown in Fig. 11.
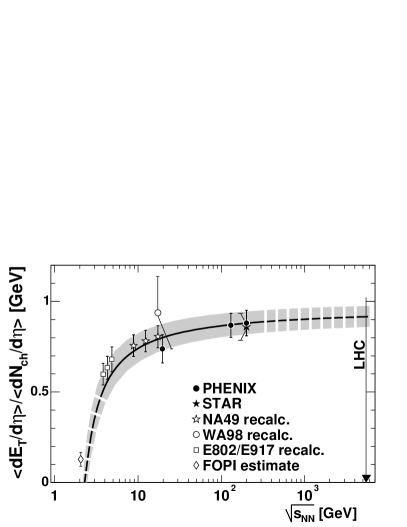
Note that the line shown in the figure is not the fit to the data points. Rather, it is calculated as a ratio of the fits plotted in Fig. 10. The calculation agrees well with the data.
There are two regions in the plot which can be clearly separated. The region from the lowest allowed to SPS energy is characterized by a steep increase of the ratio with . In this region the increase in the incident energy causes an increase in the of the produced particles. The second region starts at the SPS energies. In this region, the ratio is very weakly dependent on . The incident energy is converted into particle production at mid-rapidity rather than into increasing the particle .
The shape of the curve in the first region is governed by the difference in the parameter between and . The second region is dominated by the ratio of the parameters in the fits; this ratio is close to 1 GeV. Extrapolating to LHC energies one gets a value of (0.920.06) GeV.
The parameter is usually associated with the chemical freeze-out temperature . A simple relation like finds 0.22 GeV for a measured value of 0.88 GeV at top energy at RHIC. Coefficient 2/3 takes into account neutral particle contribution and the average particle mass GeV can be estimated from [17]. The freeze-out temperature estimate of 0.22 GeV extracted this way is in an agreement to 0.17 GeV measured from the spectra [17] plus some contribution of particle flow. In publications [33, 34] authors suggest the same value close to 1 GeV is valid even at AGS and SIS energies. This is not in disagreement with the curve in Fig. 11 because the definition used in [33, 34], includes full baryon rest mass. We use different definition of as explained in [1] where mass of pre-existing baryons is not included. At lower energy where such contribution to the is larger than at RHIC it would bring the ratio closer to one.
The transition between two region with different behavior occurs in the lower SPS energies. There are other observables which also undergo transition between regimes in the same range of . For example, the ratio demonstrates a peak at around 8 GeV as shown in Fig.4 in reference [35]. In the same region, the volume of the colliding system goes through a minimum as shown in Fig.1 in reference [36]. The asymmetric flow parameter lies in-plane at and above the highest SPS energy and out-of-plane below it, see Fig.8 in publication [37]. These evidences suggest that the energy range of 5–10 GeV has interesting physics potential which needs to be studied.
3.4.2 Centrality shape
Another interesting question is how the shapes of the centrality curves of and change with .
One approach, previously used in a number of papers is to describe the shape of the centrality dependence as a sum of “soft” and “hard” contributions such that the “soft” component is proportional to and the “hard” component to the the number of binary collisions : . A disadvantage of this approach is that the contributions called “soft” and “hard” do not necessarily correspond to the physical processes associated with these notations. Another approach is to assume that the production of and is proportional to ; although the parameter does not have any physical meaning.
We present the results of and obtained from the fits to the data at different in Table 3. Although the numbers tend to increase with beam energy, the values presented are consistent with each other within the systematic errors.
| \br | |||
|---|---|---|---|
| GeV | PHENIX | PHENIX | Average |
| \mr200 | |||
| 130 | |||
| 19.6 | |||
| 17.2 | |||
| 8.7 | |||
| parameter | |||
| 200 | 1.200.07 | 1.180.08 | 1.160.06 |
| 130 | 1.140.08 | 1.170.08 | 1.140.05 |
| 19.6 | 1.130.07 | 1.090.06 | 1.100.11 |
| 17.2 | 1.110.08 | ||
| 8.7 | 1.060.13 | ||
| 4.8 | 1.200.24 | ||
| \br | |||
Higher quality data would make it possible to derive a more conclusive statement about the shape of the curves plotted in Figs. 6 and 9. With the present set of data, usually limited to above 50, a large part of the centrality curve is missing or smeared by systematic errors. To avoid this, we compare collisions to (=2) at the same energy.
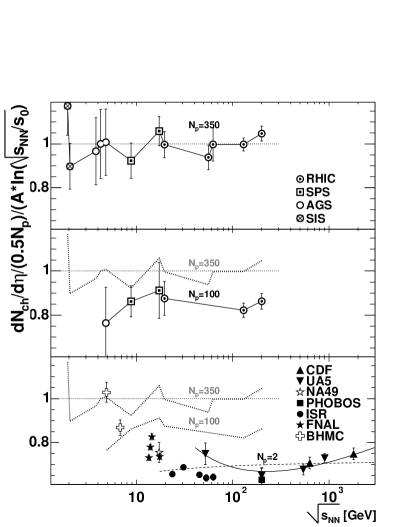
Figure 12 shows divided by the parameterization plotted in the right panel of Fig. 10. The top panel shows the most central events with 350. All points are consistent with one demonstrating an agreement of the fit to the data. The points are connected with a line for visibility. The middle panel shows results for mid-central events with = 100 connected with a solid line. The dashed line is the line from the top panel for = 350. The points for = 100 are lower than = 350 by a factor of , over the plotted range of incident energies. The lower panel shows data corresponding to = 2 measured by several experiments. Dashed lines are the same as appear in the upper two panels for = 350 and 100 and the parameterizations from [51, 52]. In the range of RHIC energies these points are lower by a factor of than the most central. Dotted lines show data from the upper two panels.
These results indicate that the centrality curves normalized to the most central collisions have a similar shape for all RHIC energies within the errors of available measurements.
At lower energies the data show rise and become equal to the most central results. That would mean that at the lower SPS and AGS energies the centrality profile is independent of . At the same time the cross over takes place at AGS energy and it would suggest that below it the particle production per participant decreases with . There is no measurement supporting such a statement. Also, the the information about particle production at low energies is recalculated from total number of produced particles or identified particles sets which require additional assumptions and systematic uncertainties to be assigned to them. Hence, it is not as reliable as at higher energies.
The data for of the FNAL and BHMC collaborations are shown in Fig. 12 as an indication of the trend.
3.5 Comparison to models
A variety of models attempting to describe the behavior of and as a function of centrality at different are available. An updated set of model results were collected from several theoretical groups to make a comparison as comprehensive as possible666For the JAM generator authors extracted data by running the code and assigning from the Glauber model simulations..
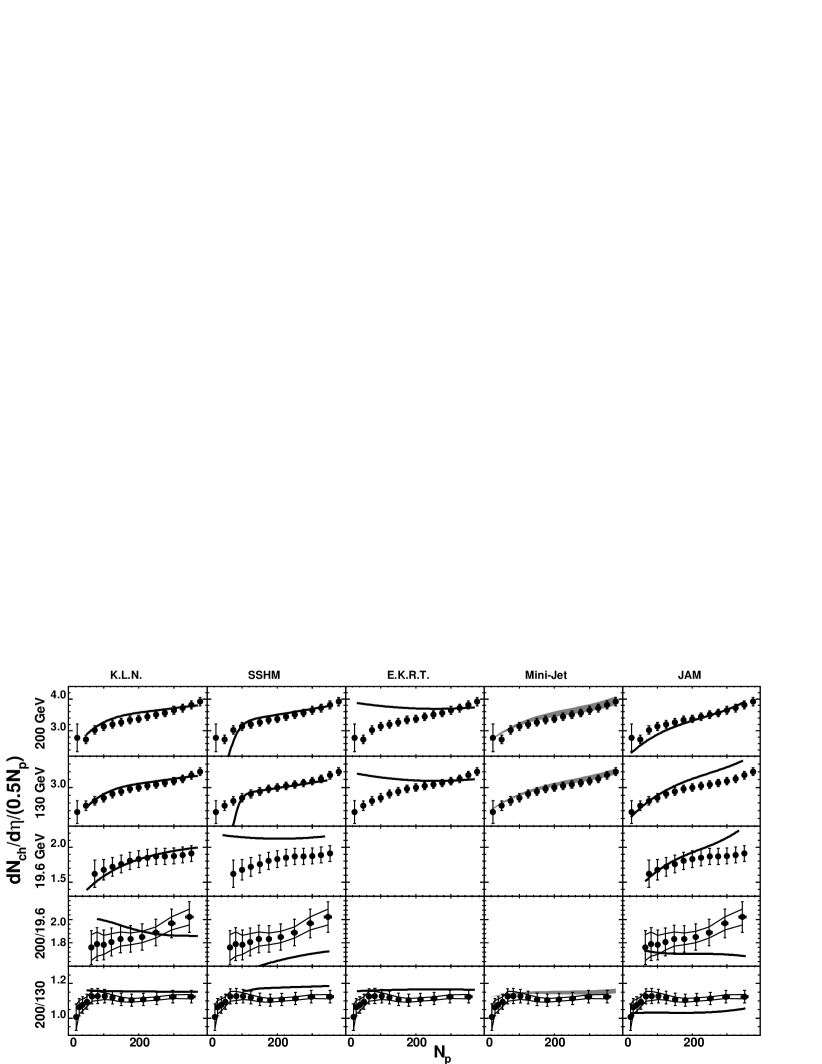
Figures 13 through 15 show the comparison between the existing theoretical models777Models are presented as the best fit by the polynomial of the lowest degree which is closer than 1% to any theoretical point. The polynomial is plotted in the range where points are provided. and the data for 19.6, 130 and 200 GeV. Brief descriptions of the models and their main characteristics are given below.
One of the more commonly used Monte Carlo event generators is HIJING [16, 55]. This model, like several others, uses pQCD for initial minijet production, and the Lund string model [56] for jet fragmentation and hadronization. HIJING also includes jet quenching and nuclear shadowing. This type of model typically has two components, a soft part proportional to and a hard part proportional to , which partly motivated the discussion in section 3.4.2. There are also so-called saturation models which also rely on pQCD and predict that at some fixed scale the gluon and quark phase-space density saturates, thus limiting the number of produced quarks and gluons. An example of this type of model is EKRT [57], which is referred to as a final state saturation model. In this paper, comparisons are also made to another parton saturation type model, KLN [58], an initial state saturation model, and also to models related to HIJING, namely Minijet [59] and AMPT [61]. AMPT is a multiphase transport model, and extends HIJING by including explicit interactions between initial minijet partons and also final state hadronic interactions. Minijet follows the same two-component model as HIJING but also incorporates an energy dependent cut-off scale, similar to the saturation models. JAM [60] uses RQMD and UrQMD inspired ideas for the low energy interactions and above resonance region soft string excitation is implemented along the lines of HIJING.
The other models are listed briefly below. SSHM and SFM did not have a designated short identifier, so they were named somewhat arbitrarily here, based on the physics the models incorporate. SSHM (Saturation for Semi-Hard Minijet) [62] is also a two-component model: pQCD-based for semi-hard partonic interactions, while for the soft particle production it uses the wounded nucleon model. DSM [63], the Dual String Model, is basically the Dual Parton Model [64], with the inclusion of strings. SFM (String Fusion Model) [65], is a string model which includes hard collisions, collectivity in the initial state (string fusion), and rescattering of the produced secondaries. Finally, there are the hadronic models, LUCIFER [66], a cascade model, with input fixed from lower energy data, and LEXUS [67], a Linear EXtrapolation of Ultrarelativistic nucleon-nucleon Scattering data to nucleus-nucleus collisions.
The available model results range from predicting (or postdicting) at one energy to predicting both and at 19.6, 130 and 200 GeV. The models have varying success in reproducing the data.
Figure 13 shows that KLN model is one of the most successful at describing the centrality dependence for all three energies. However, at =19.6 GeV the theoretical curve is steeper than the data. This results in a reversed centrality dependence relative to the data for the 200 GeV to 19.6 GeV ratio. SSHM describes the 130 and 200 GeV data well for centralities above 100, which is the approximate limit of applicability for this and other saturation models. For the less central events, the models are lower than the data. At 19.6 GeV, the model values are significantly higher than the data. The saturation model EKRT describes the central points at both energies but overshoots the more peripheral data points and thus does not reproduce the general centrality dependence of the data. For the non-saturation models included in this figure, Minijet reproduces both the overall scale, as well as the centrality and energy dependence of the data rather well.
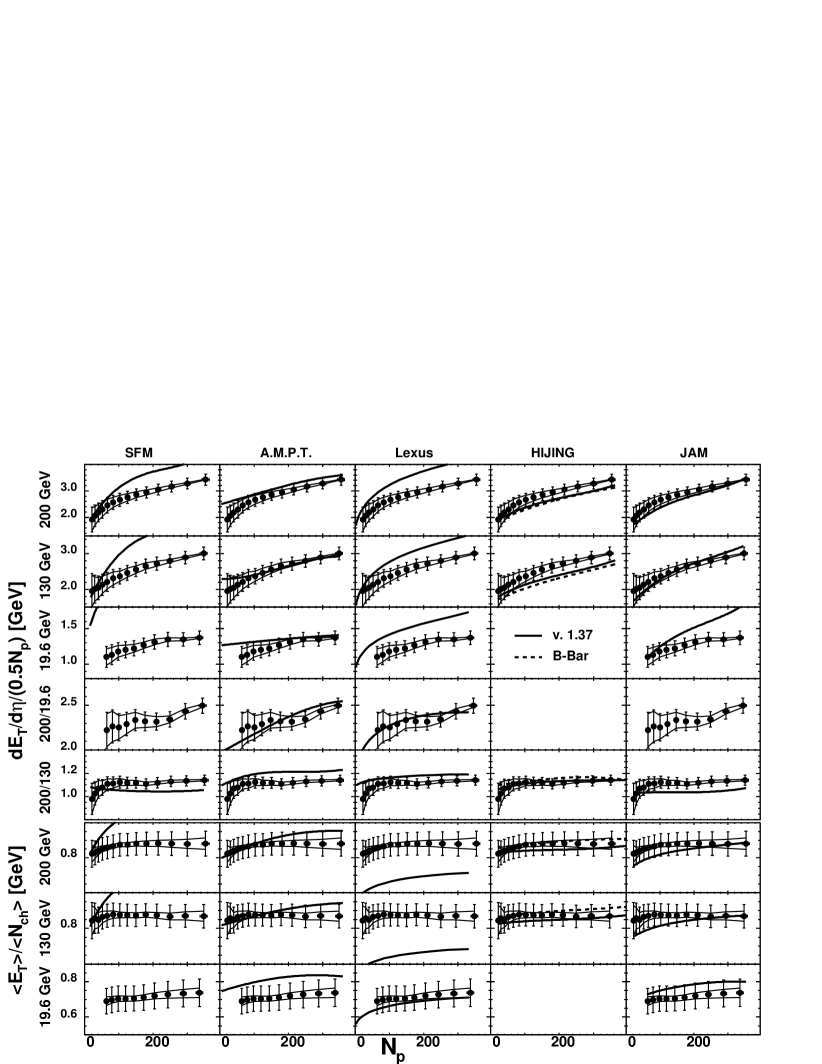
The JAM model shown in Fig. 13 and most of the models included in Fig. 14, provided values for all three energies: 19.6, 130 and 200 GeV. JAM is rather successful in describing centrality shape at =200 GeV. It also consistent with the measurements at 130 GeV and partially at 19.6 GeV. In ratios it underestimates the data. For the results shown in Fig. 15 JAM reproduced the centrality shapes well, but underestimates the dependence of the data. SFM is in reasonable agreement with the 130 and 200 GeV data, but gives much larger values than the data at 19.6 GeV. AMPT is overall in good agreement with the data for the two higher energies, except for the increasing trend in at the most peripheral events, which is not seen in the data. At the lower energy the centrality behavior is underestimated. LEXUS severely overshoots the data for all energies, indicating that nucleus-nucleus effects are not correctly accounted for. LUCIFER describes the central points at 130 GeV well, but undershoots the less central values at this energy. The HIJING models (version 1.37 and a new version with implemented baryon junctions, HIJING B-) only provide points at 130 and 200 GeV and are in reasonable agreement with the data at those energies, but generally give somewhat lower values. The curves shown include quenching and shadowing HIJING. DSM describes 19.6 GeV reasonably well for all centralities, and the more central bins for 130 and 200 GeV, but overpredicts the values for semi-central and peripheral events.
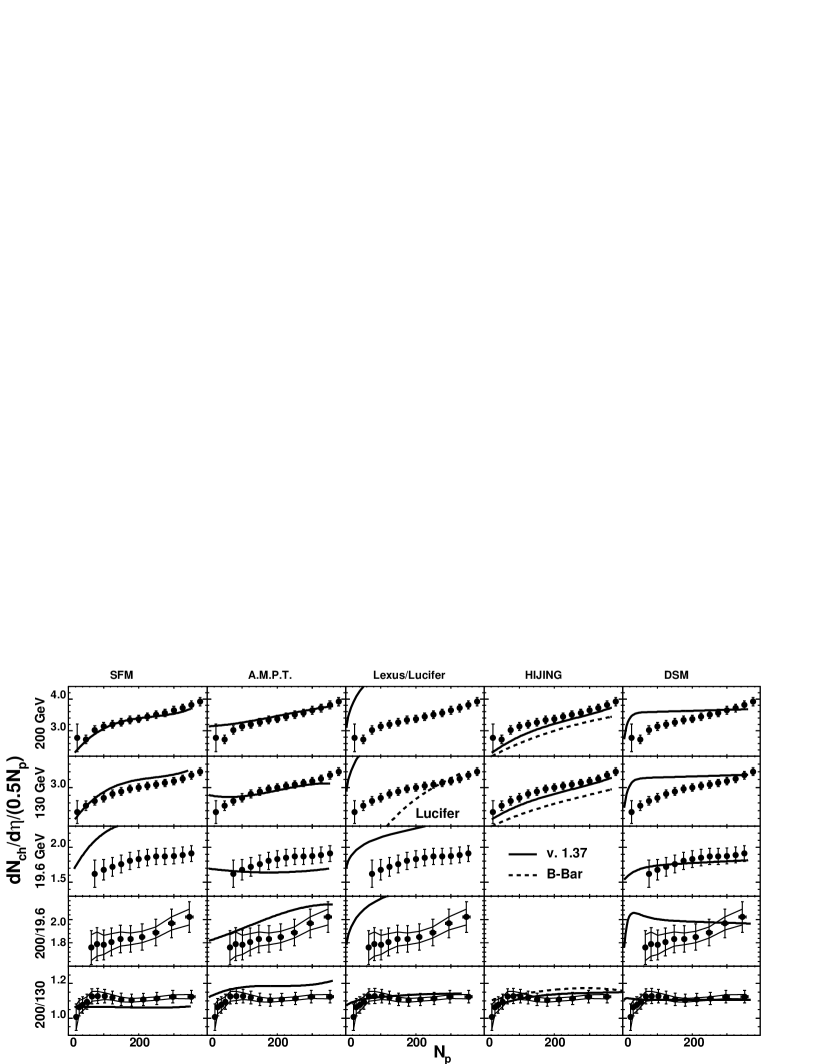
Figure 15 shows the results for the models that provide data for both and . For , LEXUS and SFM consistently overshoot the data for all energies. In the ratio , LEXUS gives values that are too low except at the lowest energy 19.6 GeV. That indicates that the hadronization mechanism allows too little energy per particle. The SFM gives values that are too large, except for the most peripheral bin, this suggests, that the particles are assigned transverse masses that are too large. The HIJING versions and the related AMPT model are in reasonable agreement with the data for both and 888Note that the HIJING versions available at the time the data were collected and used for predictions were in worse agreement with the data [11]. This was before energy loss and minijet separation/cut-off scale parameters were updated..
Also shown in Fig. 15 are the ratios of results at 200 GeV to 19.6 GeV, and 200 GeV to 130 GeV, for . These results, especially the comparison of the 200 GeV to 19.6 GeV data, is intended to make a more precise check of the dependence of the models. SFM fails to describe the 19.6 GeV data and thus can not describe the energy dependence probed by these ratios, unlike LEXUS which however does not agree well with the individual data curves for 19.6, 130 and 200 GeV. AMPT and the HIJING versions reproduce the values of the ratios well, as expected since they are in reasonable agreement with the individual curves. AMPT and HIJING are also successful in describing the ratio, as illustrated in the lower panels of Fig. 15.
To summarize, most models reproduce at least some of the data fairly well, but most also fail in describing all the data. Since the model results typically are given without systematic errors, it is not entirely straightforward to quantify the level of agreement or disagreement with the data. Qualitatively, the models that are most successful in describing both and in terms of the overall trends, both regarding centrality dependence and energy dependence, are AMPT, and the HIJING versions. KLN and Minijet unfortunately do not give information on but are successful in describing the results. The results thus can either be described by the initial state saturation scenario (KLN) or by the mini-jet models that need an energy-dependent mini-jet cut-off scale as described in [55, 59] to reproduce the data.
4 Summary
This paper presents a systematic study of the energy and centrality dependence of the charged particle multiplicity and transverse energy at mid-rapidity at = 19.6, 130 and 200 GeV.
The yields, divided by the number of participant nucleons, show a consistent centrality dependence (increase from peripheral to central) between and for all energies. Furthermore, the increase in the ratio from 19.6 GeV to 200 GeV is consistent with a 20% increase in with increasing . The ratio shows only a weak centrality dependence at RHIC energies.
For the dependence, comparisons were made not only among RHIC results but also including data from lower energy fixed-target experiments at SPS, AGS and SIS. A phenomenological fit, scaling logarithmically with , describes both and well for all energies and for the most central collisions.
Using the fit results, one can separate two regions with different particle production mechanisms. The region below SPS energy is characterized by a steep increase in with , whereas for the energies above SPS is found to be weakly dependent on .
Within the systematic errors of the measurements the shape of the centrality curves of vs. were found to be the same in the range of RHIC energies and to scale with . The same trend must be true for because has a very weak centrality dependence.
Based on the measurements, the Bjorken energy density estimates were performed and was determined to be GeV/() at = 200 GeV for the most central bin. This is in excess of what is believed to be sufficient for a phase transition to the new state of matter. The energy density increases by about a factor of 2.6 from SPS to RHIC energy.
Finally, a comparison between the RHIC and data and a collection of models was performed. A few models, notably HIJING and AMPT, reproduce both and rather well for several energies.
References
References
- [1] PHENIX Collaboration S.S. Adler et al. , nucl-ex/0409015
- [2] H. Hahn et al. , Nucl. Instrum. Methods A499, 245-263 (2003).
- [3] PHENIX Collaboration, K. Adcox et al. , Nucl. Instrum. Methods A499, 469-479 (2003).
- [4] K. Adcox et al. , Nucl. Instrum. Methods A497, 263-293 (2003).
- [5] L. Aphechetche et al. , Nucl. Instrum. Methods A499, 521-536 (2003).
- [6] M. Allen et al. , Nucl. Instrum. Methods A499, 549-559 (2003).
- [7] S. Adler et al. , Nucl. Instrum. Methods A470, 488-499 (2001).
- [8] PHENIX Collaboration, K. Adcox et al. , Phys. Rev. Lett. 87, 052301 (2001).
- [9] PHENIX Collaboration, K. Adcox et al. , Phys. Rev. Lett. 86, 3500 (2001).
- [10] A. Milov for the PHENIX Collaboration, Nucl. Phys. A698, 171 (2002).
- [11] A. Bazilevsky for the PHENIX Collaboration, Nucl. Phys. A715, 486 (2003).
- [12] D. Silvermyr, Ph.D. Thesis. Lund University (2001).
- [13] A. Milov, Ph.D. Thesis. The Weizmann Institute of Science (2002).
- [14] PHENIX Collaboration, K. Adcox et al. , Phys. Rev. Lett. 88, 242301 (2002).
- [15] GEANT 3.2.1, CERN program library.
- [16] X.N. Wang and M. Gyulassy, Phys. Rev. D44, 3501 (1991).
- [17] PHENIX Collaboration, S.S. Adler et al. , Phys. Rev. C69, 034909 (2004).
- [18] J. Bächler for the NA49 collaboration, Nucl. Phys. A661, 45 (1999).
- [19] M. van Leeuwen for the NA49 collaboration, Nucl. Phys. A715, 161 (2003).
- [20] NA49 Collaboration, S.V. Afanasiev et al. , Phys. Rev. C66, 054902 (2002).
- [21] K. Hagiwara et al. , http://pdg.lbl.gov, Phys. Rev. D66, 010001 (2002).
- [22] B. Hahn, D.G. Ravenhall and R. Hofstadter, Phys. Rev, 101, 1131 (1956), and C.W. De Jager et al. , Atomic Data and Nuclear Table 24, 479 (1974).
- [23] PHOBOS Collaboration, B.B. Back et al. , nucl-ex/0210015.
- [24] E-802 Collaboration, T. Abbott et al. , Phys. Rev. C63, 064602 (2001).
- [25] PHENIX Collaboration, K. Adcox et al. , Phys. Rev. C66, 024901 (2002).
- [26] WA98 Collaboration, M.M. Aggarval et al. , Eur. Phys. J. C18, 651 (2001).
- [27] PHENIX Collaboration, S.S. Adler et al. , Phys. Rev. Lett. 91, 241803-1 (2003).
- [28] M. Gyulassy, nucl-th/0106072.
- [29] A. Krasnitz, Y. Nara, R. Venugopalan, hep-ph/0305112, Nucl. Phys. A727, 427-436 (2003).
- [30] J.D. Bjorken, Phys. Rev. D27, 140 (1983).
- [31] NA49 Collaboration, T. Alber et al. , Phys. Rev. Lett. 75, 3814 (1995).
- [32] A.Andronic and P.Braun-Munzinger, hep-ph/04022091
- [33] J. Cleymans and K. Redlich, Phys. Rev. Lett. 81, 5284 (1988).
- [34] P.Braun-Munzinger, K.Redlich and J.Stachel nucl-th/0304013
- [35] M.Gazdzicki for the NA49 Collaboration nucl-ex/0403023
- [36] CERES Collaboation D.Adamova et al. , Phys. Rev. Lett. 90, 022301 (2003).
- [37] A Appelshäuser for the CERES Collaboation, Nucl. Phys. A698, 253c-260c (2002).
- [38] STAR Collaboration, J. Adams et al. , nucl-ex/0311017.
- [39] BRAHMS Collaboration, I.G. Bearden et al. , Phys. Lett. B523, 227 (2001).
- [40] BRAHMS Collaboration, I.G. Bearden et al. , Phys. Rev. Lett. 88, 202301 (2002).
- [41] PHOBOS Collaboration, B.B. Back et al. , Phys. Rev. Lett. 85, 3100 (2000).
- [42] PHOBOS Collaboration, B.B. Back et al. , Phys. Rev. C65, 061901 (2002).
- [43] M.D. Baker et al. for the PHOBOS Collaboration,, Nucl. Phys. A715, 65c-74c (2003).
- [44] T.S. Ullrich for the STAR Collaboration, nucl-ex/0305018.
- [45] T.S. Ullrich for the STAR Collaboration, Nucl. Phys. A715, 399 (2003).
- [46] STAR Collaboration, J Adams et al. , nucl-ex/0407003.
- [47] D. Mis̀kowiec for the CERES Collaboration, Proc. of CIPPQG Palaiseau, September 2001.
- [48] NA50 Collaboration, M.C. Abreu et al. , Phys. Lett. B530, 43 (2002).
- [49] NA57 Collaboration, F. Antinori et al. , nucl-ex/0406004.
- [50] PHOBOS Collaboration, B.B. Back et al. , nucl-ex/0301017
- [51] UA5 Collaboration, G.J. Alner et al. , Z. Phys. C33, 1-6 (1986).
- [52] W. Thome et al. , Nucl. Phys. B129, 365-389 (1977).
- [53] J. Whitmore, Phys. Repts. 10, 274-373 (1974).
- [54] V. Blobel et al. , Nucl. Phys. B69, 454-492 (1974).
- [55] V. Topor Pop, M. Gyulassy, J. Barrette, C. Gale, X. N. Wang, N. Xu, and K. Filimonov, Phys. Rev. C68, 054902 (2003).
- [56] B. Andersson et al. , Nucl. Phys. B281, 289 (2003).
- [57] K.J. Eskola et al. , Nucl. Phys. B570, 379 (2000); Phys. Lett. B497, 39 (2001).
- [58] D. Kharzeev and M. Nardi, Phys. Lett. B507, 121 (2001); D. Kharzeev and E. Levin, Phys. Lett. B523, 79 (2001).
- [59] S. Lee and X.N. Wang, Phys. Lett. B527, 85 (2002).
- [60] Y.Nara, Nucl. Phys. A638, 555c (1998).
- [61] Z. Lin et al. , Phys. Rev. C64, 011902 (2001).
- [62] A. Accardi, Phys. Rev. C64, 064905 (2001).
- [63] R. Ugoccioni, Phys. Lett. B491, 253 (2000).
- [64] A. Capella et al, Phys. Repts. 236, 225 (1994).
- [65] N. Armesto Perez et al. , Phys. Lett. B527, 92 (2002); Eur. Phys. J. C22, 149 (2001).
- [66] D.E. Kahana and S.H. Kahana, nucl-th/0208063.
- [67] S. Jeon and J. Kapusta, Phys. Rev. C63, 011901 (2001).
- [68] F. Ceretto, Ph.D. Thesis. University of Heidelberg (1998).
- [69] H. Appelshäuser for the CERES Collaboration, Nucl. Phys. A698, 253 (2002).
- [70] E802 Collaboration, L. Ahle et al. , Phys. Rev. C59, 2173 (1999).
- [71] E802 Collaboration, L. Ahle et al. , Phys. Rev. C58, 3523-3538 (1998).
- [72] C.A. Ogilvie for the E866 and E917 Collaborations, Nucl. Phys. A638, 57c-68c (1998).
- [73] Y. Akiba for the E802 Collaboration, Nucl. Phys. A610, 139 (1996).
- [74] E917 Collaboration, B.B. Back et al. , Phys. Rev. Lett. 86, 1970-1973 (2001).
- [75] E802 Collaboration, L. Ahle et al. , Phys. Rev. C57, R466-R470 (1998).
- [76] E802 Collaboration, L. Ahle et al. , Phys. Lett. B476, 1 (2000).
- [77] E802 Collaboration, L. Ahle et al. , Phys. Lett. B490, 53 (2000).
- [78] FOPI Collaboration, W. Reisdorf et al. , Nucl. Phys. A612, 493 (1997).
- [79] FOPI Collaboration, D. Pelte et al. , Z. Phys. A357, 215 (1997).
- [80] FOPI Collaboration, B. Hong et al. , Phys. Rev. C66, 034901 (2002).