Scaling of Charged Particle Production in d+Au Collisions at
Abstract
The measured pseudorapidity distributions of primary charged particles over a wide pseudorapidity range of and integrated charged particle multiplicities in collisions at are presented as a function of collision centrality. The longitudinal features of collisions at are found to be very similar to those seen in p + A collisions at lower energies. The total multiplicity of charged particles is found to scale with the total number of participants according to and the energy dependence of the density of charged particles produced in the fragmentation region exhibits extensive longitudinal scaling.
pacs:
25.75-q,25.75.Dw,25.75.GzCharged particle multiplicities have been studied extensively in high energy collisions because of the intrinsic interest in understanding the production mechanism. More recent interest comes in the context of searching for and studying new forms of matter that are expected to be created in heavy ion collisions at ultrarelativistic energies. A key quantity that contains information about the longitudinal aspects of the multiparticle production process, and that has provided valuable input for discriminating between phenomenological models in the past ref1 , is the rapidity distribution of identified particles. When particle identification is not available, the almost equivalent pseudorapidity distribution of charged particles suffices. For this reason, such distributions have been studied in detail in hadron + proton ref2 , hadron + nucleus ref3 , and nucleus + nucleus Sch1 collisions.
Since the first collisions were achieved at the Relativistic Heavy Ion Collider (RHIC), the PHOBOS collaboration has obtained extensive information on pseudorapidity distributions of charged particles produced in collisions for nucleon-nucleon center-of-mass energies () between 19.6 and 200 GeV and over a large range of collision geometries. We have observed, for example, that the particle density in the midrapidity region changes smoothly as a function of Bac1 and that the total charged particle production scales linearly with the number of participants pet . Further detailed observations of the shape of the pseudorapidity distribution show a scaling according to the “limiting fragmentation” hypothesis Bac3 . The study of a simpler system such as at the same energy as is essential to gain insight into which aspects of the data follow from the initial interacting states or general properties of the hadronic production process, and which are the consequence of the very different environments created in and collisions.
In this Letter we present the results of detailed measurements of the pseudorapidity distributions of primary charged particles, , as a function of collision centrality in collisions at beam over a wide pseudorapidity range of 5.4. The pseudorapidity, , is defined as , where is the emission angle relative to the direction of the deuteron beam. The results for collisions are compared to collisions and inelastic collisions at as well as to p(, K+) + nucleus collisions at lower energies.
The data were obtained with the multiplicity array of the PHOBOS detector BackNim at RHIC. The array consists of an octagonal barrel of silicon detectors, the Octagon, surrounding the interaction region in an approximately cylindrical geometry covering . This array is augmented by two sets of three annular silicon counter arrays, the Rings, along the beam pipe far forward and backward of the interaction region (). This array is identical to that used in our study of collisions Bac3 . The setup also includes two sets of 16 scintillator counters () which were used in the primary event trigger and in the offline event selection.
The centrality determination was based on the observed total energy deposited in the Ring counters, ERing, which is proportional to the number of charged particles hitting these detectors. The choice of this centrality measure was based on extensive studies utilizing both data and Monte Carlo (MC) simulations that sought to minimize effects of auto-correlations on the final dNch/d result. These effects can be significant when using other centrality measures dAumin , resulting in enhancements (suppressions) in the reconstructed midrapidity yields of up to 30% for central (peripheral) collisions. The MC simulations used in the study included both HIJING HIJING and AMPT AMPT event generators coupled to a full GEANT GEANT simulation of the PHOBOS detector.
Four additional centrality measures, discussed in Ref. dAumin , were created in order to study the detailed effects of auto-correlation biases. Ratios of the reconstructed dNch/d distributions obtained from the five centrality measures for data and, independently, for the MC simulations were found to agree, giving confidence in the entire methodology. This information, together with knowledge of the unbiased MC simulated “truth” distributions, provided a clear choice of the centrality measure based on the Ring detectors as that which yielded the least bias on the measurement. It is important to note that this study only provided guidance with respect to the choice of ERing for the experimental centrality measure, and the final experimental dNch/d results do not rely in any way on the detailed shape of the distributions from the MC simulations.
The multiplicity signals of ERing were divided into five centrality bins, where each bin contained 20% of the total cross section. For this to be done correctly, the trigger and vertexing efficiency had to be determined for each bin. Knowledge of the efficiency as a function of multiplicity allowed for the correct centrality bin determination in data as well as the extraction of the corresponding efficiency-averaged number of participants. A comparison of the data and the MC simulations yielded an overall efficiency of 83%.
Results of the Glauber calculations implemented in the MC were used to estimate the average total number of nucleon participants, , the number of participants in the incident gold, , and the deuteron, , nuclei, as well as the number of binary collisions, , for each centrality bin (see Table 1).
The details of the analysis leading to the measurements of can be found in Ref. Back2001 . The measured was corrected for particles which were absorbed or produced in the surrounding material and for feed-down products from weak decays of neutral strange particles. Uncertainties in associated with these corrections range from 6% in the Octagon up to 28% in the Rings. These uncertainties dominate the systematic errors.
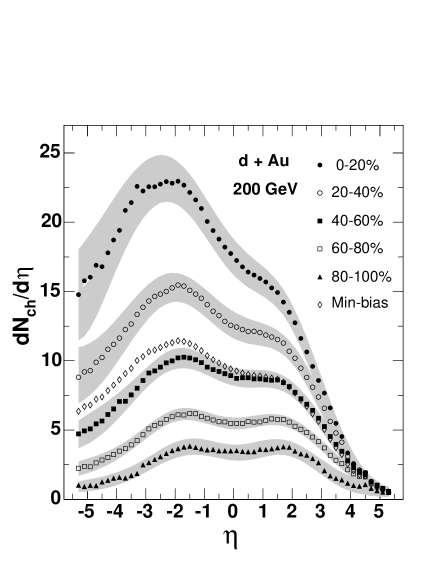
Figure 1 shows the pseudorapidity distributions of primary charged particles for collisions at in five centrality bins and for minimum-bias events. A detailed discussion of our minimum-bias distribution can be found in Ref. dAumin . As a function of collision centrality, the integrated charged particle multiplicity in the measured region () and the estimated total charged particle multiplicity extrapolated to the unmeasured region using guidance from the shifted p+nucleus data (see Fig. 2) are presented in Table 1. The centrality bins 0-20% and 80-100% correspond to the most central and the most peripheral collisions, respectively. The pseudorapidity is measured in the nucleon-nucleon center-of-mass frame; a negative pseudorapidity corresponds to the gold nucleus direction. For the most central collisions, the mean of the distribution is found to be negative, reflecting the net longitudinal momentum of the participants in the laboratory (NN) frame. For more peripheral collisions, the mean tends to zero as the distribution becomes more symmetric. For measurements of in the nucleon-nucleon center-of-mass system the Jacobian between and naturally produces the “double-hump” structure in even if there is no structure in .
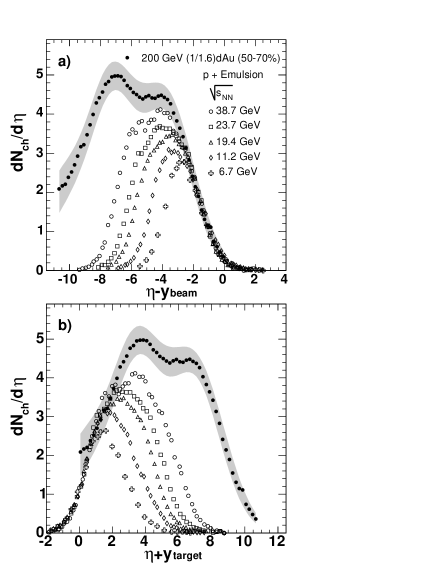
Now, we compare our results with p + A data obtained at lower energy, and discuss the energy and centrality dependence of the data. Figure 2 compares distributions of to p + Emulsion (Em) collisions at five energies Sver87 ; Abd87 , in the effective rest frame of both the projectile “beam” (a) and target (b). For p + Em data the pseudorapidity distributions represent the sum of shower and gray tracks. It should be noted that is measured in a different reference frame for and p + Em. This means that, compared to collisions, the p + Em pseudorapidity distributions are suppressed by the Jacobian for . The 50-70% centrality bin of collisions was selected in order to match as well as possible to where =3.4. The relative normalization of the for d + Au and p + Em collisions requires a ratio of /=1.6, such that the data correspond to the same number of nucleons interacting with the nucleus. A remarkably good agreement (limiting fragmentation) is observed in the fragmentation regions of the deuteron (gold) between d + Au and p + Em collisions at different energies. Furthermore, the overlap between the fragmentation regions of the deuteron (gold) and proton (Em) extends to lower with increasing collision energy. In Ref. RNQM04 we reported a similar comparison but for more central and p+Pb ref3 collisions. This extensive longitudinal scaling, also seen earlier in ref2 , p + A clv , and A + A Bac3 collisions, suggests that the dominance of the two fragmentation regions is a common longitudinal feature of all multiparticle production processes.
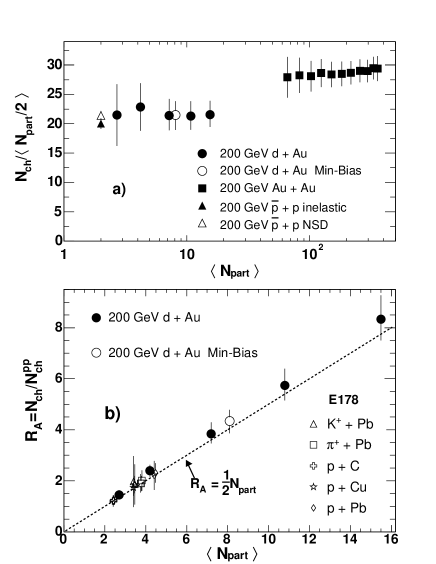
Figure 3a shows the total integrated charged particle multiplicity per participant pair for , pet collisions, inelastic nchine and NSD nchnsd all at the same energy, , as a function of the total number of participants. The results show that the total charged particle multiplicity scales linearly with in both and collisions. They also indicate that the transition between inelastic collisions and collisions is not controlled simply by the number of participants, as even very central multiplicity per participant pair shows no signs of extrapolating to the results. Not only do we find that the total charged particle production in scales linearly with , but also that the scaling is energy independent and is the same in all hadron + nucleus collisions ref3 . This is evident from Figure 3b where the ratio is plotted as a function of for a large variety of systems and energies. Here is the integrated total charged particle multiplicity for d+ A, p + A Elias80 and is for . It is this scaling, observed for the first time by Busza et al. wit2 , which led to the wounded nucleon model of Białas et al. Bial76 .
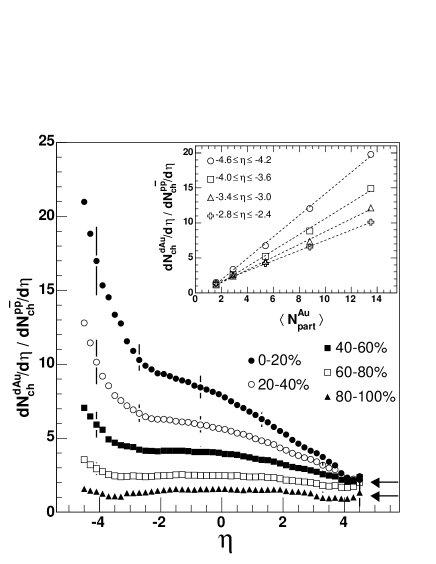
Finally, in Figure 4 we compare for all centralities, the ratio of distributions observed in collisions relative to that for inelastic ua5dn at the same energy. The inset figure shows the ratio as function of the number of gold participants, , for four regions in the gold direction. The results are consistent with a picture in which the production of particles with rapidity near that of the incident deuteron (gold) is approximately proportional to the number of deuteron (gold) participants. These results are consistent with lower energy p + A data Elias80 ; Dem and, with the quark-parton model of Brodsky et al. Bro77 .
In summary, we find that the longitudinal features of collisions at , as reflected by the centrality dependence of the pseudorapidity distributions of charged particles, are very similar to those seen in p + A collisions at energies lower by more than an order of magnitude. In particular, we find that in collisions the total multiplicity of charged particles scales linearly with the total number of participants, that the transition between the multiplicity per participant in and collisions is not controlled simply by the total number of participants, and that the energy dependence of the density of charged particles produced in the fragmentation regions exhibits extensive longitudinal scaling. These results impose strong constraints on models of multiparticle production.
This work was partially supported by U.S. DOE grants DE-AC02-98CH10886, DE-FG02-93ER40802, DE-FC02-94ER40818, DE-FG02-94ER40865, DE-FG02-99ER41099, and W-31-109-ENG-38, by U.S. NSF grants 9603486, 0072204, and 0245011, by Polish KBN grant 1-P03B-062-27(2004-2007), and by NSC of Taiwan Contract NSC 89-2112-M-008-024.
| Cent. (%) | |||||
|---|---|---|---|---|---|
| 0–20 | 13.5 1.0 | 2.0 0.1 | 14.7 0.9 | 157 10 | 167 |
| 20–40 | 8.9 0.7 | 1.9 0.1 | 9.8 0.7 | 109 7 | 115 |
| 40–60 | 5.4 0.6 | 1.7 0.2 | 5.9 0.6 | 74 5 | 77 |
| 60–80 | 2.9 0.5 | 1.4 0.2 | 3.1 0.6 | 46 3 | 48 |
| 80–100 | 1.6 0.4 | 1.1 0.2 | 1.7 0.5 | 28 3 | 29 |
| Min-Bias | 6.6 0.5 | 1.7 0.1 | 7.1 0.5 | 82 6 | 87 |
| 50-70 | 3.9 0.6 | 1.6 0.2 | 4.2 0.6 | 59 4 | 62 |
References
- (1) N.N. Nikolaev, Sov. J. Part. Nucl. 12, 63 (1981); D. Horn, Phys. Rep. C 4, 1 (1972) and references therin.
- (2) J. Whitmore, Phys. Rep. 27, 187 (1976); G.J. Alner et al., Z. Phys. C 33, 1 (1986) and references therein.
- (3) W. Busza, Acta Phys. Pol. B 8, 333 (1977); S. Fredriksson et al., Phys. Rep. 144, 187 (1987).
- (4) H.R. Schmidt et al., J. Phys. G. 19, 1705 (1993).
- (5) B. B. Back et al. Phys. Rev. Lett. 88, 022302 (2002).
- (6) B. B. Back et al., Preprint nucl-ex/0301017.
- (7) B. B. Back et al., Phys. Rev. Lett. 91, 052303 (2003).
- (8) Technically, the collisions were run at = 200.7 GeV, matching the beam rapidities for collisions at = 200.0 GeV, see http://www.agsrhichome.bnl.gov/RHIC/Runs/
- (9) B. B. Back et al., Nucl. Instr. Meth. A 499, 603(2003).
- (10) B. B. Back et al., Phys. Rev. Lett. 93, 082301 (2004).
- (11) M. Gyulassy et al., Comp. Phys. Comm. 83, 307 (1994).
- (12) Zi-wei Lin et al., Phy. Rev. C 68, 054904 (2003).
- (13) R. Brun et al., GEANT 3.21, CERN Lib., W5013, 1994.
- (14) B. B. Back et al., Phys. Rev. Lett, 87, 102303 (2001).
- (15) Compilation of world data in p-Em collisions, see S. Fredriksson et al., Phys. Rep., 144, 187 (1987); I. Otterlund et al., Nucl. Phys. B 142, 445 (1978).
- (16) A. Abduzhamilov et al., Phys. Rev. D 35, 3537 (1987).
- (17) R. Nouicer (for PHOBOS Collaboration), J. Phys. G: Nucl. Part. Phys. 30, S1133 (2004).
- (18) C. Halliwell et al., Phys. Rev. Lett. 39, 1499 (1977); I. Otterlund et al. , Nucl. Phys. B 142, 445 (1978).
- (19) G.J. Alner et al., Phys. Rep. 154, 247 (1987) and H. Heiselberg, Phys. Rep. 351, 161 (2001).
- (20) G.J. Alner et al., Phys. Lett. B 167, 476 (1986).
- (21) J.E. Elias et al., Phys. Rev. D 22, 13 (1980).
- (22) W. Busza et al., Phys. Rev. Lett, 34, 836 (1975).
- (23) A. Białas et al. Nucl. Phys. B 111, 461 (1976).
- (24) G.J. Alner et al., Z. Phys. C 33, 1 (1986).
- (25) C. DeMarzo et al. Phys. Rev. D 29, 2476 (1984).
- (26) S. J. Brodsky et al., Phys. Rev. Lett., 39, 1120 (1977).