Coulomb and nuclear breakup of a halo nucleus 11Be
Abstract
Breakup reactions of the one-neutron halo nucleus 11Be on lead and carbon targets at about 70 MeV/nucleon have been investigated at RIKEN by measuring the momentum vectors of the incident 11Be, outgoing 10Be, and neutron in coincidence. The relative energy spectra as well as the angular distributions of the 10Be+n center of mass system (inelastic angular distributions) have been extracted both for Pb and C targets. For the breakup of 11Be on Pb, the selection of forward scattering angles, corresponding to large impact parameters, is found to be effective to extract almost purely the first-order E1 Coulomb breakup component, and to exclude the nuclear contribution and higher-order Coulomb breakup components. This angle-selected energy spectrum is thus used to deduce the spectroscopic factor for the configuration in 11Be which is found to be 0.72 0.04 with a strength up to = 4 MeV of 1.05 0.06 e2fm2. The energy weighted E1 strength up to = 4 MeV explains 70 10 % of the cluster sum rule, consistent with the obtained spectroscopic factor. The non-energy weighted sum rule within the same energy range is used to extract the root mean square distance of the halo neutron to be 5.77(16) fm, consistent with previously known values. In the breakup with the carbon target, we have observed the excitations to the known unbound states in 11Be at = 1.78 MeV and = 3.41 MeV. Angular distributions for these states show the diffraction pattern characteristic of =2 transitions, resulting in =(3/2,5/2)+ assignment for these states. We finally find that even for the C target the E1 Coulomb direct breakup mechanism becomes dominant at very forward angles.
pacs:
P21.10.Jx, 21.10.Hw, 24.50.+g, 25.60.GcI Introduction
Breakup reactions have played key roles in investigating the properties of weakly-bound halo nuclei over the past decade HANS95 ; TANI95 . The breakup reaction on a light target, induced predominantly by the nuclear interaction, is characterized by an unusually narrow momentum distribution of a core fragment and an enhanced reaction cross section, reflecting the extended neutron halo structure. Indeed, the halo structure was first uncovered for 11Li by observing the enhanced interaction cross section for this nucleus TANI85 , and the narrow momentum distribution of 9Li following the breakup of 11Li on a carbon target KOBA88 ; ORR92 . In addition to these techniques, more recently, the one nucleon knockout reaction in coincidence with rays from the core fragment has been successfully used to determine spectroscopic factors of halo states AUMA00 .
The breakup reaction of halo nuclei on a heavy target predominantly occurs as Coulomb breakup (Coulomb dissociation). This reaction is of particular interest due to substantially enhanced Coulomb breakup cross sections found for halo nuclei KOBA89 . This phenomenon was first interpreted as the presence of a soft electric dipole (E1) resonance IKED92 , which occurs as a vibration of the core against halo due to the low density of the halo cloud. More recently, by using kinematically complete measurements of the Coulomb breakup, spectra of electric dipole strength () have been directly obtained for one-neutron halo nuclei 11Be NAKA94 and 19C NAKA99 , and two-neutron halo nuclei 6He AUMA99 , 11Li IEKI93 ; SHIM95 ; ZINS97 , and 14Be LABI01 . It was found that for these halo nuclei a strong E1 strength of the order of 1 W.u.(Weisskopf Unit) was observed at very low excitation energies of about 1 MeV. However, the mechanism for such large E1 strength was not due to a soft dipole resonance, but rather due to a direct breakup into the continuum, as shown by our earlier study of the Coulomb breakup of 11Be NAKA94 . In the direct breakup mechanism, the observed enhancement of the E1 strength is interpreted as follows: the distribution is described approximately as a Fourier transform of , where is the radial coordinate of the neutron and the radial component of the wave function of the halo neutron OTSU94 . The large value of at large in a halo nucleus thus leads to a large E1 strength at low excitation energies. In fact, the distribution can be used to determine by inverse Fourier transformation NAKA94 ; MENG97 .
In this article, we will show the results of a new, full kinematical measurement of the breakup reactions of 11Be with a heavy target (lead) where Coulomb breakup dominates, and with a light target (carbon) where nuclear breakup dominates. We aim at a comprehensive understanding of the reaction mechanism of the breakup reactions both on heavy and light targets, thereby establishing a way of doing spectroscopy of halo nuclei by the breakup reactions, both for the ground state as well as for excited states in the continuum.
For the breakup with a Pb target, we focus mainly on extracting the Coulomb breakup component by using the information on the scattering angle, which is approximately inversely proportional to the impact parameter of the reaction. The analysis incorporating the scattering angle dependence has been obtained with much more statistics (more than 30 times) as compared to the previous experiment NAKA94 . The contribution of the nuclear breakup component and higher order effects in the breakup with a heavy target have recently drawn much attention. In fact, quite a few theoretical papers have suggested the necessity of careful treatments of these contributions NAGA01 ; DASS99 ; TYPE01a ; TYPE01b ; BERT92 ; BAUR92 ; ESBE95 ; MARG02 ; MARG03 ; THOM01 ; BAUR03 beyond the direct breakup mechanism based on a semi-classical first-order perturbation theory (equivalent photon method) which we successfully applied in the analysis of the previous experiment NAKA94 ; NAKA99 . For instance, a much larger nuclear contribution than the conventional estimation made by scaling the breakup cross section with the data obtained with a light target has been suggested in Ref. NAGA01 ; DASS99 . In this article, we prove that the direct breakup mechanism with the first-order Coulomb breakup is dominant, and the small nuclear contribution and higher order effects can be well controlled using the angular distribution of the center-of-mass system of 10Be + . This technique will thus offer a powerful spectroscopic tool that can extract precisely the halo wave function .
For the breakup with a C target, we focus on investigating the excitation of discrete resonant states by using the information of the excitation energy spectrum in combination with the scattering angle. Thereby, we aim at establishing a spectroscopic method to study the narrow discrete states in the continuum. Such states are hardly observed in the breakup with a heavy target due to the large direct-breakup contribution. We also examine the structureless part of the energy spectrum with the scattering angle distribution which is used to disentangle the reaction mechanism with the light target.
The 11Be nucleus is a suitable test case for these studies since ground state properties are well known. For example, the one-neutron separation energy is precisely known to be 504 4 keV AUDI93 . Furthermore, the simple one-neutron halo structure of 11Be has an advantage over two-neutron halo nuclei such as 11Li because the reaction mechanisms do not suffer from the complexity which may arise from the two-neutron halo correlations.
The breakup reactions of 11Be on targets from light to heavy mass have been studied by R. Anne et al. ANNE93 . The authors used mainly the inclusive neutron angular distributions. More recently, breakup reactions for 11Be have been studied at GSI in a full-kinematical way using Pb and C targets and at high energy, 520 MeV/nucleon PALI03 . Our present approach is a full-kinematical one. We can extract the excitation energy spectrum as well as the scattering angle of the c.m. (center of mass) system of 10Be and neutron. In particular, in this paper we emphasize the importance of the information on the scattering angle, which was not discussed in the GSI data. In addition, we have performed the experiment at a much lower energy as compared to the one at GSI, bringing in additional information on the reaction mechanism.
We organize the paper as follows: Section II describes the experimental method. Section III describes the experimental setup. In Sec. IV the results for breakup of 11Be on Pb and C targets are presented with detailed discussions including theoretical comparisons. Then, in Sec. V, the conclusions are given.
II EXPERIMENTAL METHOD
In the current experiment, we made a coincidence measurement of the momentum vectors of the incoming 11Be, outgoing 10Be, and neutron to deduce the relative energy between 10Be and the neutron, and the scattering angle of the c.m. system of 10Be + n. Here we describe the features characteristic of the invariant mass method which has been used to extract , and the method to extract .
II.1 Invariant mass method
The relative energy between 10Be and the neutron, which is related to the excitation energy of 11Be by , can be extracted by using the invariant mass method. The invariant mass of the intermediate excited state of 11Be is determined by measuring the momentum vectors, and , of the outgoing particles 10Be and neutron, respectively. Namely,
| (1) |
where and stand for the total energy of the 10Be fragment and the neutron, respectively. The relative energy between 10Be and the neutron is then determined as,
| (2) |
where and denote the mass of 10Be and of the neutron, respectively.
The advantage of the invariant mass method is that the energy resolution is as good as about a few hundred keV at = 1 MeV. This is due to the fact that the invariant mass is a function of four momenta of the outgoing particles, and is not affected by the widely spread secondary beam. In this sense, this method is appropriate for radioactive beam experiments. The good energy resolution is also attributed to the fact that is determined by the opening angle and the relative velocity between the outgoing 10Be and the neutron. In this case, the opening angle resolution of 10 mrad and the relative velocity resolution of 1%, which are easily achievable, can yield a good energy resolution of a few hundred keV at = 1 MeV. This is different from the missing mass method, where the resolution is determined by the value of the total mass which is of the order of tens of GeV. Thus, an energy resolution of the order of 10 MeV, even with the momentum resolution of the order of 0.1%, can only be achieved. Further advantages are the kinematical focusing and the availability of a thick target since the projectile has rather high velocity of more than 0.3 for intermediate incident energies. Relatively small detectors can thus cover most of the acceptance, which is very important in radioactive beam experiments as well.
It should be noted that there is a possibility that the 10Be fragment is produced in an excited state. In this case, a ray emission follows the reaction process and has been measured in the GSI experiment PALI03 . The excitation energy in this case has to be modified to = + + , where stands for the energy of the deexcitation ray from the daughter nucleus 10Be. In the current work, we did not use ray detectors. However, the probability of obtaining an excited 10Be, where the lowest excited state is located as high as 3.37 MeV, is very small for the Coulomb breakup process due to very small virtual photon numbers for this high excitation energy. Since the ratio of the virtual photon number at higher to that at lower is smaller for lower incident energies, this probability is even smaller in our case. In fact, this contribution is estimated to be less than 3% at the present incident energy of 69 MeV/nucleon compared to 6% observed at 520 MeV/nucleon PALI03 . The selection of large impact parameters done in the current analysis further reduces this number, leading to a negligible contribution resulting from the excited 10Be states. For the breakup with a light target, the GSI experiment found about 17% contribution of the non ground state component, and thus the treatment required additional care.
II.2 Scattering angle of the center of mass
The exclusive measurement of an incident 11Be momentum in addition to and allowed us to extract the scattering angle of the c.m. system of 10Be+n. This angle is determined by the opening angle between the direction of and that of the outgoing momentum vector of the center of mass obtained by . Here, the scattering angle is defined in the center of mass frame of the projectile and target.
Since we are dealing with a small relative energy of less than 5 MeV compared to the total kinetic energy of about 770 MeV, the angle determined in this way represents the inelastic scattering angle of 11Be on the Pb or C target with very good approximation. For the Coulomb breakup, the scattering angle is directly related to the impact parameter as will be shown for the semi-classical approximation. For the nuclear breakup, the scattering angle is used mainly to determine the orbital angular momentum transfer in the transition to a given discrete state, and thus can be used to assign the spin-parity of the excited state.
III Experiments
The experiment was performed at the RIKEN Accelerator Research Facility (RARF). A secondary radioactive beam of 11Be was produced by fragmentation of a 18O primary beam at 100 MeV/nucleon in a thick Be target. The secondary beam was separated using the RIPS fragment separator KUBO92 , where an achromatic wedge-shaped energy degrader was installed at the intermediate dispersive focal plane to adjust the secondary beam energies to about 70 MeV/nucleon and to purify the secondary beam. The typical beam intensity was restricted to about 5104 particles/sec by setting the momentum slit down to 0.1% in order to meet the counting capabilities of the detectors. The resulting 11Be beam with a purity of about 99% was delivered to the experimental setup shown schematically in Fig. 1.
The 11Be ion bombarded a natPb target with a thickness of 224 mg/cm2 or natC target with a thickness of 376 mg/cm2. In addition, a no-target run was performed to subtract the background events generated by materials other than the target. The energy of the incident 11Be particle was determined from the time of flight (TOF), measured with two thin plastic scintillators with a thickness of 1 mm which were placed 4.57 m apart along the beam line. The average beam energy at the mid-plane of the target was 68.7 MeV/nucleon and 67.0 MeV/nucleon, respectively for the Pb and C targets. The position and angle of 11Be incident on the target were measured with two sets of multi-wire drift chambers (BDC). The energy and angle of the incident particle were combined to reconstruct the momentum vector of the projectile, i.e., .
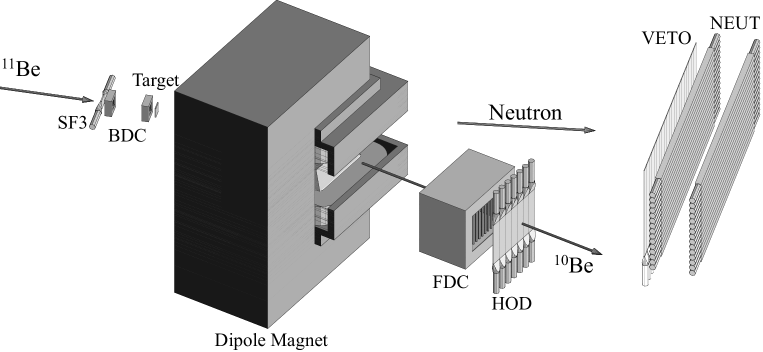
The breakup particles, 10Be and were emitted in a narrow cone at forward angles with velocities close to that of the 11Be incident ion. The neutrons were detected by the two layers of a neutron hodoscope array (NEUT), which has an active area of 214(H)92(V)cm2 and a depth of 6.1 cm for each layer. The front faces of NEUT were placed at 460 cm and 499 cm downstream of the target. The detector covered an angular range from degrees to degrees in the horizontal direction, and 5.6 degrees in the vertical directions. NEUT consists of 30 plastic scintillator rods (15 rods for each layer). Each detector has a dimension of 6.1 cm(D) 6.1 cm(V) 214 cm(H), coupled to two photomultiplier tubes on both ends. The front side of NEUT was equipped with a thin layer of plastic scintillators (VETO) set in order to reject the charged particle background. The TOF information of the neutron was obtained by taking the mean value of the two timings of the fired detector of NEUT. The horizontal position was obtained by taking the difference of the two timings. The vertical position was determined by the position of the fired rod. The momentum vector was thus reconstructed from the position and TOF information of these detectors. The momentum resolution (1) of the neutron in the projectile rest frame was 1.7% and 2.0% for the Pb and C targets, respectively. The intrinsic neutron detection efficiency of 13.4% for the threshold energy 6 MeVee (electron-equivalent) was obtained from a separate experiment using the 7Li()7Be reaction at 66.7 MeV. This energy threshold was used to reject all the -ray related events.
The 10Be fragment emitted in the reaction was bent by a large-gap dipole magnet, was traced by the multi-wire drift chamber (FDC) located downstream of the magnet, and penetrated the hodoscope (HOD) which consists of 7 plastic scintillator slats of 1 cm thickness. Particle identification was performed by combining and TOF information from the hodoscope with the magnetic rigidity information from the tracking. The momentum vector of 10Be () was deduced by the combination of TOF between the target and HOD (about 4 m), and tracking analysis. The momentum resolutions (1) of 10Be for the reaction with the Pb target were 0.80%, 0.77%, and 0.32% respectively for the , , and , which represent the horizontal, vertical, and parallel momenta. Those for the C target were 0.47%, 0.47%, and 0.32%, respectively. This difference in the energy resolution for the transverse directions according to the target is due to the different multiple scattering between the heavy and light targets.
The relative energy resolution was determined by a Monte-Carlo simulation incorporating the momentum resolutions of 10Be and the neutron. The relative energy resolution (FWHM) was thus estimated to be MeV and MeV respectively for the Pb and C targets. The angular resolution of in 1 was 0.41 degrees and 0.48 degrees respectively for the Pb and C targets.
The geometrical acceptance for the 10Be and neutron was estimated by a Monte Carlo simulation. Here, events were generated as a function of and , and the corresponding acceptance functions for the Pb and C targets were deduced for these observables. The net geometrical acceptance was obtained as a ratio of the breakup events of interest with and without acceptance correction. The acceptance thus estimated turned out to be 52% for the Pb target with the energy-angular ranges of 0 5 MeV and . The same quantity was 31% for the C target, with the ranges of 0 8 MeV and .
IV Results and Discussions
IV.1 Overview of spectra for Pb and C targets
The relative energy spectra for the Pb target and C target data are shown in Figs. 2(a) and (b), respectively. There, the cross sections for the breakup channel into 10Be + are plotted for the angular range () corresponding to the current whole acceptance, and for the selected forward angular ranges () for the Pb(C) targets. The angular ranges for the whole acceptance are different depending on the target used because the angle in the projectile-target center of mass frame is about twice as much as that in the laboratory frame for the C target, while they are about the same for the Pb target.
The spectra for the whole acceptance show conspicuously different characteristics depending on the target. A huge asymmetric peak is seen for the Pb target, while two peaks, corresponding to the known states at = 1.78 MeV and 3.41 MeV, are seen on top of the decreasing continuum for the C target. The breakup cross sections for the whole acceptance with integrated up to 5 MeV are 1790 20(stat.) 110(syst.) mb for the Pb target, and 93.3 0.8(stat.) (syst.) mb for the C target (see the first column of Table 1). Here, the systematic uncertainty comes mainly from that in the neutron detection efficiency, which affects solely the absolute normalization of the spectrum. A minor contribution to the uncertainty is due to the target excitation and due to the events decaying to the 10Be excited states, which can be significant for the carbon target data. These contributions have been estimated and subtracted using the Q-value spectrum reconstructed from all the four momentum vectors of 11Be, 10Be, and the neutron. The events excluded with this procedure were about 4 % and 19 % of the total events for the Pb and C targets, respectively.
The substantially larger cross section for the Pb target over the C target is a clear indication of the dominance of the Coulomb breakup for the Pb target. The current relative energy spectrum observed for the Pb target is consistent with our previous experiment NAKA94 . The absolute value in the current experiment is about 17% smaller in the central values. This discrepancy of the central value is within the systematic uncertainty (of about 20%) of the absolute value in the previous experiment. The current Pb spectrum is consistent with the GSI data PALI03 if one takes into consideration the different virtual photon spectra at the two different incident energies. The two peaks observed for the current carbon target data were not observed in the GSI data at 520 MeV/nucleon PALI03 . This fact may be attributed to the different contribution of the inelastic scattering to these states for different incident energies. The eikonal calculation in Ref. HENC96 suggests that the diffractive breakup, which contains the inelastic scattering to discrete states, is expected to have a factor of 3–5 larger cross section below 100 MeV/nucleon than at high energies. In fact, the current cross section is about 3 times larger than the value of 32.6(1.6) mb reported in Ref. PALI03 . Due to the smaller cross section at higher energies, the peaks might not have been statistically significant in the GSI experiment. The larger cross section and the better energy resolution at intermediate energies compared to higher energies may be better suited for spectroscopic studies of such discrete unbound resonance states.
It should be noted that the removal cross section in the coincidence measurement with the detectors placed in the forward direction adopted in the current and in the quoted GSI experiments corresponds to the diffractive breakup cross section, while the other component of the reaction, the 1 knockout process, is out of the acceptances. Taking into account the fact that the diffractive breakup cross section is expected to be about half of the total removal cross section at intermediate energies HENC96 , we find that the current cross section is consistent with the value of 259(39) mb obtained for the 11Be + 9Be reaction with no coincidence with the neutron at a similar incident energy of 60 MeV/nucleon AUMA00 .
| Target | (mb) | (mb) | (mb) |
|---|---|---|---|
| Pb | 179020(stat.)110(syst.) | 151092 | 28020 |
| C | 93.30.8(stat.)(syst.) | 12.5 | 80.80.8 |

IV.2 Pb target data
Here below we discuss in detail the combined results of angular distribution and the relative energy spectrum obtained for the 11Be breakup on the Pb target, used to extract the pure Coulomb breakup contribution.
IV.2.1 Framework of the analysis
The Coulomb breakup cross section can be factorized into the E1 transition part (structure part) and the reaction part. For the E1 transition, we analyze the data in terms of the direct breakup mechanism, which has successfully explained the distributions for the Coulomb breakup of one-neutron halo nuclei at low excitation energies NAKA94 ; NAKA99 ; PALI03 . For the reaction part, we use two methods: 1) the semi-classical first order perturbation theory of the equivalent photon method JACK75 ; BERT88 , 2) the quantum mechanical DWBA/coupled-channel calculation ECIS RAYN97 . In the case of the equivalent photon method the double differential cross section can be given as,
| (3) |
where stands for the number of virtual photons with photon energy and scattering angle . is the reduced transition probability for an E1 excitation. The photon number represents the reaction part, and represents the structure part.
In the ECIS approach, we discretized the excitation energy. For each energy bin, the from the structure model was integrated to obtain the Coulomb deformation length parameter (=, with deformation parameter and nuclear radius ), which was then used as an input of the ECIS code to obtain the angular distributions. The reaction part is also independent of the spectrum in this quantum mechanical approach.
IV.2.2 Direct breakup mechanism
In the direct breakup mechanism NAKA94 ; OTSU94 ; MENG97 ; BERT92 ; BAUR92 , the distribution contained in Eq. (3), is described simply by the following matrix element
| (4) |
The wave function for 11Be in the ground state, , is represented by the product of the radial part and the angular part of the single valence neutron. The E1 operator involves , the relative distance between the core and valence neutron. The final state describes a neutron in the continuum. The matrix element represents approximately a Fourier transform of . In fact, it is an exact Fourier transform if one neglects the interaction in the continuum and the final state is assumed to be a simple plane wave. The spectrum at low excitation energy (small ) is therefore an amplified image of the density distribution for large , i.e., the halo distribution. In other words, the E1 amplitude at low relative energies is proportional to the asymptotic normalization coefficient of the halo wave function. Namely, the Coulomb dissociation probes exclusively the halo part of the wave function.
One can then relate the amplitude to the spectroscopic factor of the 11Be single particle state as described in Ref. NAKA94 ; NAKA99 ; DATT03 ; PALI03 . The wave function of the ground state of 11Be can be described as,
| (5) | |||||
where and represent the spectroscopic factor for each configuration in the term expansion. The first term is the halo configuration since the -wave valence neutron has no centrifugal barrier and, combined with the very low binding energy, represents the halo tail. Hence, the distribution at low excitation energy is sensitive only to the first term of the wave function, as in,
| (6) |
The comparison of the E1 amplitude (or differential cross section) to the theoretical expectation thus leads to the determination of the spectroscopic factor for the halo state as was successfully shown in the previous experiments on 11Be NAKA94 ; MENG97 ; PALI03 , 15C DATT03 , and 19C NAKA99 .
IV.2.3 Angular distribution
Figure 3 shows the cross sections plotted as a function of the scattering angle of the 10Be + c.m. system of the 11Be breakup on the Pb target. Here the angular distributions are shown for the two energy regions of 0 5 MeV (a) and 0 1 MeV (b).

These angular distributions are compared to the calculations performed with the equivalent photon method and with the DWBA method (ECIS). For both cases, has been calculated according to Eq. (6), with the halo wave function obtained using a potential model based on a Woods Saxon potential with parameters = 1.236 fm and = 0.62 fm. The experimental value of the binding energy was used to determine the well-depth parameter. The final state, distorted wave function in the continuum was calculated using the same interaction potential.
In the equivalent photon method the angular distributions in Fig. 3 have been obtained by integrating the distribution over the relative energies and by folding with the experimental resolutions. The cutoff impact parameter for the calculation of the photon number adopted there is 12.3 fm, as given in Ref. NAKA94 . For the ECIS calculation, we assume a pure E1 Coulomb excitation with the optical model potential parameters determined by fitting the 17O + Pb elastic scattering data at 84 MeV/nucleon BARR88 . The values of the parameters adopted are given in Table 2.
The normalization to the experimental data has been obtained by matching the amplitude at the most forward angles for the 0 1 MeV data (see Fig. 3(b)). Note that the normalization obtained in the analysis shown in Fig. 3(b) (0 1 MeV) can reproduce the normalization used for Fig. 3(a) (0 5 MeV) as well. The resulting turned out to be 0.72 when using the ECIS technique and 0.69 when applying the equivalent photon method. The final determination on the spectroscopic factor and the discussion on its uncertainty will be presented with the relative energy spectrum below.
Shown in Fig. 3 are the angular distributions characterized by a forward peak and a sharp fall off, which can be easily understood in the semi-classical picture. When the Coulomb excitation occurs with a low-energy virtual photon as in the case of a loosely bound nucleus, the virtual photon is absorbed by the nucleus at a large impact parameter, or small scattering angles. In fact, the impact parameter is related to the scattering angle by in this semi-classical treatment, where stands for half the distance of the closest approach. The impact parameter axis in this relation is shown on the top of Fig. 3. One can see that even events at large impact parameters of more than 100 fm can contribute to the Coulomb breakup.
As for the comparison of the distributions, an overall agreement of the calculation with the experimental data has been obtained at forward angles for both energy regions, indicating the dominance of the E1 Coulomb breakup with the direct breakup mechanism. Between the two models, the quantum mechanical calculation gives a better agreement for a wider range of the angular distribution. This may be due to the fact that the ECIS code incorporates the quantum mechanical trajectory on the optical potential and the extended charge distribution of the target.
In spite of the successful explanation of the data at forward angles, there still remains a deviation at large scattering angles, in particular beyond the grazing angle (=3.8∘). This can be attributed to a larger nuclear contribution and/or higher order effects at these angles. Even for the ECIS calculation, a slight deviation remains for the angles above 1.3 degrees for 5MeV and above 2.8 degrees for 1 MeV. In turn, the selection of the data at forward angles is proved to be very effective to extract the almost pure E1 Coulomb breakup component. This is also supported by an elaborate theoretical calculation which included all higher order effects in Coulomb and nuclear excitations TYPE01b . There, the prediction has been that the pure E1 Coulomb breakup occurs within about one half of the grazing angle.
| Original Reaction | Energy/nucleon | ||||||
| (MeV) | (MeV) | (fm) | (fm) | (MeV) | (fm) | (fm) | |
| 17O+208Pb BARR88 | 84 | 50 | 1.067 | 0.8 | 57.9 | 1.067 | 0.8 |
| 11Be+12C (set a) JOHN97 | 48 | 155.9 | 0.632 | 0.994 | 92.66 | 0.593 | 1.042 |
| 12C+12C (set b) BUEN84 | 84 | 120 | 0.71 | 0.84 | 34.02 | 0.96 | 0.69 |
IV.2.4 Relative energy spectra
In Fig. 2(a), the relative energy spectrum selected for the forward angles ( 1.3∘) is compared with the pure E1 breakup of the ECIS calculation (solid curve) and that of the equivalent photon method (dotted curve). Since these two calculations give almost the same results, the dotted curve is hardly appearing in the figure. The angle of 1.3 degrees corresponds to 30 fm in the semi-classical framework. This angle-selected spectrum agrees perfectly with the calculation and shows that the selection of the forward angular region is, indeed, very effective to extract the E1 Coulomb breakup component. The spectroscopic factor for the halo ground state is thus deduced to be 0.72 0.04 (ECIS), and 0.69 0.04 (equivalent photon method), which are consistent with each other. These values agree well with those obtained from the angular distribution analysis. The extracted spectroscopic factors are listed in Table 3 and are shown there in comparison with those obtained in other breakup experiments and other experiments using different reactions.
| Reaction | E/A (MeV) | References | |
|---|---|---|---|
| Coulomb Breakup | 69 | Present | 0.72 0.04 (QM) |
| 0.69 0.04 (SC) | |||
| 72 | NAKA94 ; MENG97 | 0.80 0.20 (SC) | |
| 520 | PALI03 | 0.61 0.05 (SC) | |
| Transfer Reaction | 12.5 | ZWIE79 | 0.77 |
| TIMO99 | 0.60,0.36 | ||
| 35.3 | WINF01 | 0.67-0.80 | |
| Knockout Reaction | 60 | AUMA00 | 0.87 0.13 |
| ESBE01 | 0.79 0.12 |
The spectroscopic factor (=0.72) extracted from the data with the restricted angular range is then used to calculate the spectrum for the whole acceptance (using the ECIS method). The result of this calculation is shown in Fig. 2(a) where the overall agreement with the experimental data is evident, although a deviation at MeV can be observed. This deviation may be attributed to a nuclear contribution and/or to higher order effects in the electromagnetic excitation process. The difference between the calculation and the data provides a measure of these effects, as will be discussed in section IV.4. The dotted curve obtained with the equivalent photon method with = 0.69 is also shown in comparison with the data. In this case the deviation is larger due to the impact parameter cut as can be seen in the angular distributions of Fig. 3. The integrated cross section for the pure E1 breakup calculation (ECIS) and the residual cross section are listed in Table 1.
The integrated obtained from the data selected for the forward angles amounts to 1.05 0.06 e2 fm2 corresponding to 3.29 0.19 W.u for 4 MeV. This can be compared to the E1 non-energy weighted cluster sum rule as proposed in Ref. ESBE92
| (7) |
where represents the mean square distance between the valence neutron and the core, and and represent the atomic and mass numbers of 11Be in the present case. From the sum up to = 4 MeV, we obtain = 5.77 0.16 fm for the halo neutron, which is consistent with the value of 5.7 0.4 fm obtained from the GSI experiment.
The energy-weighted E1 sum rule (TRK sum rule) can be written as,
| (8) |
The TRK E1 sum for 11Be is 38.1 e2fm2MeV, while the observed strength (from the one-neutron decay threshold energy to = 4 MeV) amounts to 1.52 0.22 e2fm2MeV, which is only 4.0(5)% of the expected total TRK sum. In the present case, however, the cluster sum rule is more appropriate for a comparison with the experimental result. The cluster E1 sum (molecular sum) is defined by subtracting the contribution of the core internal motion from the total TRK sum as in ALHA82 ,
| (9) |
where suffix ’’ represents core-related quantities. The observed sum exhausts 70 10 % of the cluster sum of 2.18 e2fm2MeV for the 10Be motion. It should be noted that this value agrees with the spectroscopic factor for the halo state. The cluster sum may provide an alternative way of extracting the spectroscopic factor for the halo state.
IV.3 C target data
The relative energy spectra for 11Be + C at 67 MeV/nucleon shown in Fig. 2(b) have been investigated in combination with angular distributions. We first describe here the results on the two observed peaks by showing their angular distributions and compare the results with shell model calculations. We then further investigate the angular distribution to extract information on the reaction mechanism of the breakup with a light target.
IV.3.1 1.78 MeV and 3.41 MeV states
In the relative energy spectrum for the 11Be breakup on the C target, two resonance peaks centered at = 1.29 MeV ( = 1.79 MeV) and = 2.88 MeV ( = 3.38 MeV) have been observed with significant strengths embedded on the continuum component. These states correspond to the known states in 11Be at = 1.78 MeV (2nd excited state) and at = 3.41 MeV, as shown in Fig. 4 AJZE90 . So far, these states have been identified by transfer reactions on 10Be ZWIE79 and 9Be LIU90 . The 1.78 MeV state has been assigned to be a . As for the 3.41 MeV state, the spin-parity assignment has been more controversial, with positive parity AJZE90 and negative parity assignments LIU90 .

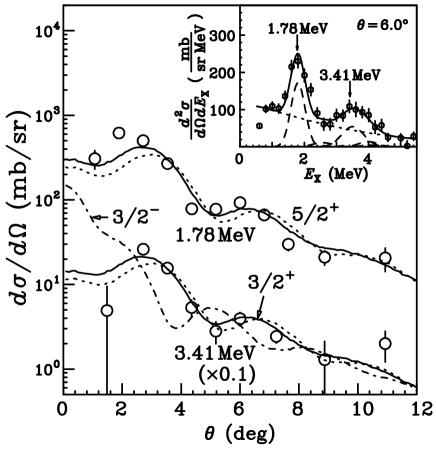
The angular distributions for the excitation of these states have been obtained by fitting the relative energy spectrum for each bin. The fitting function consists of Gaussians corresponding to known discrete states up to = 5.24 MeV plus arbitrary exponential and polynomial functions for the representation of the continuum background component. One example of the fitting result is shown in the inset of Fig. 5. We find that only the 1.78 MeV and 3.41 MeV states have significant cross sections amongst the known states.
The angular distributions thus obtained are shown in Fig. 5. The integrated cross sections up to = 12∘ amount to 10.7 2.1 mb and 5.9 1.2 mb respectively for the 1.78 MeV and 3.41 MeV states. A systematic uncertainty of about 20% arising from the ambiguity of the choice of the continuum background function is incorporated in the quoted uncertainties. We have compared these data with the DWBA calculation (ECIS code) using a standard vibrational model. Both angular distributions follow the patterns characteristic of =2 transition. In the ECIS calculations, we have adopted the and assignments respectively for 1.78 MeV and 3.41 MeV to reproduce the =2 transitions, although the choice of either the or assignment does not modify the angular pattern. The assignment in the ECIS calculation reflects the agreement with the level order in a shell model calculation for the positive parity states as described below (see Fig. 4). Two different optical potential parameter sets (a) JOHN97 and (b) BUEN84 , given in Table 2, are adopted for extracting the differential cross sections. The calculations are in good agreement with the data for both parameter sets. As for the 3.41 MeV state, assignment (=3/2-) is clearly excluded, as can be seen in Fig. 5.
The deformation lengths ) can be obtained from the DWBA analysis as well. The results are listed in Table 4. These deformation lengths as well as the experimental energies are compared to shell model calculation for the positive parity states in 11Be in the model space with the WBT effective interactions OXBA86 ; WARB92 . The comparison of the experimental and calculated energy levels is shown in Fig. 4. The deformation lengths can be obtained by introducing Bernstein’s prescription BERN81 ,
| (10) |
where and are proton and neutron multipole matrix elements. The parameters and represent the interaction strengths of the probe particle, respectively for protons and neutrons. We adopt since 12C is a probe as in the case of particles, where the same parameters are used. In the vibrational model, the factor is given by
where represents the nuclear spin of the final state. With these prescriptions, shell model calculations provide the matrix elements and from which the theoretical deformation lengths have been deduced. The results are presented in Table 4. In this calculation, we have adopted the conventional effective charges of and , which are commonly used in the -shell region BROW88 . The calculated deformation lengths are consistent with the experimentally obtained values, with a better agreement with the results obtained using the optical potential parameter set (a).
The reasonably good agreement both for the level energies and the transition strengths shows that the shell model describes rather well these positive-parity states with spin assignments of 5/2+ and 3/2+ respectively for 1.78 MeV and 3.41 MeV states. The main shell model configuration for the 1.78 MeV state is . On the other hand the 3.41 MeV state has only a small fraction of 1 single particle component, and a larger contribution of the configuration. It should be noted here that even if the 3.41 MeV state has a large component with the 10Be(2) excited core, this configuration decays into 10Be(g.s.) since the decay into 10Be(2) is energetically forbidden (see Fig. 4).
We note here that the inelastic scattering on a =0 target as in 12C rather favors the = 2 excitation because this reaction yields in principle, isoscalar excitations. This may be the reason for the observations of these positive parity states in the present experiment. The inelastic scattering on a different target, such as a proton, would be very interesting to study since this would excite states with different . A comparison of the transition strengths for the observed 1.78 MeV and 3.41 MeV states probed by a different target would be also interesting since this would lead an independent determination of and , thereby enabling the extraction of different neutron and proton deformations.
| State | (fm) | ||
|---|---|---|---|
| 1.78 MeV | 5/2+ | Exp. (set a) | 1.27 0.25 |
| Exp. (set b) | 1.16 0.23 | ||
| Shell Model | 1.23 | ||
| 3.41 MeV | 3/2+ | Exp. (set a) | 1.42 0.28 |
| Exp. (set b) | 1.02 0.20 | ||
| Shell Model | 1.36 |
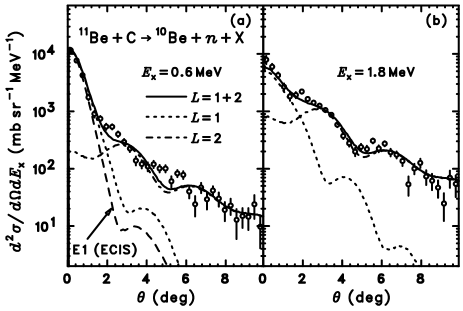
IV.3.2 Angular distribution and E1 Coulomb component
A further investigation of the reaction mechanism of the 11Be breakup on the C target based on the analysis of angular distributions has been performed. These are shown in Fig. 6 for a pure continuum region just above the neutron threshold (a), and in the region containing the 1.78 MeV state (b). We find that the angular distributions are characterized by a strong peak at very forward angles and a diffraction pattern at larger angles. These angular distributions are compared to ECIS calculations with a restriction of excitation multipoles to =1 and =2. The curves labeled =1 in Fig. 6 consists of calculation performed using E1 Coulomb excitation and the isoscalar component of the nuclear excitation HARA81 while for the =2 case a vibrational model for Coulomb and nuclear excitations has been adopted. An overall agreement of the data with this decomposition is obtained. In Fig. 6(b), we see a dominance of the =2 diffraction pattern, as expected. The remaining small deviations may be attributed to contributions from the =1 isovector nuclear excitation, higher multiple excitations, or from the events decaying into the 10Be excited states. Also shown in Fig. 6(a) is the result of the pure E1 Coulomb calculation with the direct breakup mechanism assuming a spectroscopic factor =0.72.
As a main result of this analysis we find that the notable peak at the forward angles is reproduced perfectly by the Coulomb breakup. We see the strong forward peak even in the Fig. 6(b) which shows the angular distribution for the excitation of the state at 1.78 MeV. This result led us to compare the relative energy spectrum for the C target at the selected angular range . As shown in Fig. 2(b), we have obtained indeed an excellent agreement with the E1 direct Coulomb breakup model even for the breakup with a light target such as carbon.
The present work on a light target has demonstrated that the invariant mass spectroscopy in combination with the angular distribution analysis offers a very useful spectroscopic tool for a loosely-bound nucleus, where unbound states are easily populated. In the present analysis, collective models have been adopted in the calculations for simplicity. It would be interesting to compare more elaborate microscopic reaction models to the present results. For instance, the Continuum-Discretized Coupled Channel (CDCC) method can be one of these powerful tools. The present results may provide a good test of such reaction theories of the breakup of loosely bound nuclei.
IV.4 Remarks on the nuclear contribution and higher order effects
In this section, we make an estimation of the nuclear and high multipolarities in the 11Be + Pb data. Practically, this estimation can be used to test the scaling between the nuclear breakup component in the breakup on Pb and that on C, which has been conventionally used for the estimation of the nuclear contribution. There, the Coulomb breakup spectrum has been extracted by subtracting the nuclear contribution estimated by the spectrum with a light target data as in,
| (11) |
where suffix “CD” stands for Coulomb dissociation, and is the scaling factor. This scaling method assumes that the breakup cross section is an incoherent sum of the Coulomb and nuclear diffractive dissociation. This method may be important for an experiment with smaller yields where the angular distribution as in the present work is hardly obtained. In the previous breakup experiment of 11Be on Pb at 72 MeV/nucleon NAKA94 , we adopted the parameter to be the ratio of the sum of the radii of the target and the projectile, which is 1.8. This is based on a simple geometrical argument that the nuclear excitation is a peripheral phenomenon. On the other hand, Ref.PALI03 extracted a larger value of 5.4 based on the eikonal calculation. In theoretical works, this ratio varies very much: a simple Serber model SERB47 that has a target mass dependence gives = 2.6 for Pb/C, while the model in Ref. NAGA01 , where target mass dependence is suggested, provides = 17.
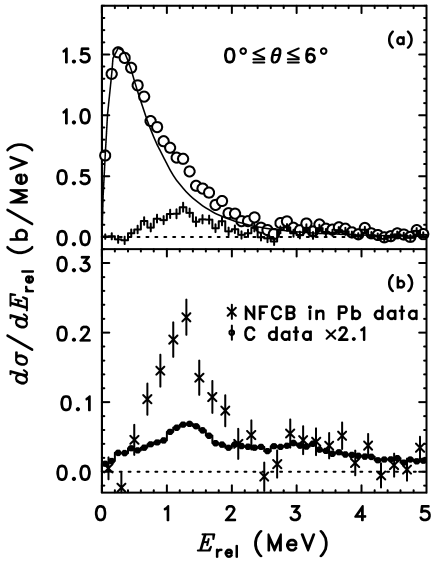
In the present work, we have extracted the Coulomb breakup contribution independently from this scaling factor by using the angular distribution. Therefore, the extracted pure Coulomb component can be used to estimate the scaling factor . Figure 7 displays the spectrum for the Pb target and for the whole acceptance () in comparison with the extracted E1 pure Coulomb direct breakup component (ECIS calculation, solid line) with the spectroscopic factor =0.72. The difference between the data and the estimated Coulomb contribution shown by the histogram provides nuclear contribution and/or higher order effects of Coulomb breakup. Since this difference represents the remaining breakup contribution after subtracting first-order Coulomb breakup, we call here this component NFCB, the non first-order Coulomb breakup. The NFCB component amounts to 280 20 mb which is 15.6 % of the total breakup cross section as shown in Table 1. Since we had an evidence for a Coulomb breakup component with the carbon target data, the NFCB in the carbon target was also extracted and the result is 80.8 0.8 mb, also given in the same table.
The NFCB spectrum is compared with that for the C target in Fig. 7(b). The C target data is scaled to match the integrated cross section for 2 MeV, where a good agreement in the spectral shape is obtained. With this comparison, we have obtained = 2.1 0.5, consistent with the value of 1.8 adopted in the previous experiment, and with the value obtained from the Serber model. This value is also consistent with the eikonal calculation which gives = 2.4 at this incident energy IBRA03 . However we find a strong deviation at the resonance region near the 1.78 MeV state, where is about 6. The cause of this large deviation cannot be easily understood. We infer that this may be either due to a strong nuclear and Coulomb interference for this particular resonant state. The other possible reason is a higher order Coulomb excitation effect around this energy region. In any cases, the possibility of mass dependence of for the nuclear breakup cross sections in Ref. NAGA01 can be clearly excluded. Due to the consistency at the energy region where the structureless diffractive dissociation dominates, we may adopt the = 2.1(5) as an estimation of the nuclear contribution at this incident energy.
The value of = 2.1(5) is smaller than that obtained at GSI at 520 MeV/nucleon. According to eikonal calculation HENC96 , the energy dependence of can be understood by the fact that at higher energies the black-disk like picture is more vague by low NN cross sections. Namely, the Serber-type picture is to be modified at higher energies.
V Summary and Conclusions
In this paper, we have investigated the Coulomb and nuclear breakup of 11Be on Pb and C targets at 69 MeV/nucleon and 67 MeV/nucleon, respectively. By measuring the momentum vectors of the incoming 11Be, of the outgoing 10Be, and the neutron in coincidence, we have extracted the relative energy spectra as well as the angular distributions of the scattering of the 10Be + c.m. system on both targets.
The obtained angular distribution of the 10Be + c.m on Pb has been found to be well described by the first-order E1 Coulomb breakup mechanism, in particular for the very forward angular regions corresponding to large impact parameters in the semi-classical point of view. The experimental relative energy spectrum selected for 30 fm (or 1.3∘) is in perfect agreement with the 1st order pure E1 Coulomb calculation with the direct breakup mechanism, leading to a spectroscopic factor of the halo configuration of 0.72 0.04.
The E1 non-energy weighted sum, corresponding to the integrated strength has been compared to the cluster sum rule, leading to a root-mean square distance of 5.77 0.16 fm for the neutron in its halo state. The energy weighted cluster sum rule has been applied to the present case. The energy weighted E1 strength has been found to be 70 10 % of this sum rule. It is interesting to note that this value agrees with the value of =0.72(4).
We have investigated experimentally the inelastic breakup scattering of 11Be on C target. We have observed two peaks corresponding to the = 1.78 MeV and 3.41 MeV states. The angular distributions for these states show =2 excitation patterns, leading to their spin-parity assignments of =(3/2,5/2)+. The amplitude of the angular distribution has provided the deformation lengths for these states as well. The energy levels and the transition densities have been compared to shell model calculations for the low-lying positive parity states of 11Be in the model space with the WBT effective interaction. We have found that the energy levels and deformation lengths are rather well reproduced. The comparison with the shell model calculation also suggests = 5/2+ and = 3/2+ as preferred assignments for the = 1.78 MeV and 3.41 MeV states, respectively. The deformation lengths are also well reproduced with the shell model calculation with Bernstein’s prescription and the conventional values of effective charges.
The angular distributions have been investigated further to disentangle the reaction mechanism. We have found that the =1 Coulomb component is strong at very forward angles in contrast to the =2 pattern in the angular distribution around the 1.78 MeV resonance. In fact, the relative energy spectrum for is well reproduced by the pure E1 direct breakup model. This result shows that Coulomb breakup occurs at forward angles even on a light target such as carbon.
Finally, we have estimated the nuclear breakup and/or higher order effects by subtracting the calculated pure E1 Coulomb component for the Pb target. By making a comparison of the subtracted spectrum with the C target, the scaling factor of nuclear contribution for Pb target to C target is estimated. The scaling factor needed to reproduce the data at 2MeV has been found to be = 2.1(5), which is consistent with Serber-type models. This value is smaller than =5.4 extracted from data at higher energies. This incident energy dependence can be qualitatively explained in the eikonal picture.
The present work demonstrates that breakup reactions, both on light and heavy targets, are powerful spectroscopic tools for low-lying states of loosely bound nuclei where the excitation above the particle emission threshold is close to the ground state. In particular, this work shows that the combination of angular distribution data with the relative energy spectra is very effective for extracting structure information by disentangling Coulomb and nuclear excitations. It can be easily foreseen that the study of the inelastic scattering to states above the threshold with different targets would provide complementary information on the excitation process and on the structure of excited states in the continuum. More elaborate theoretical work on breakup reactions would be desirable to construct the spectroscopic properties in a more microscopic way for the future RI beam science.
Acknowledgements
Sincere gratitude is extended to the accelerator staff of RIKEN for their excellent operation of the beam delivery. Fruitful discussions with T. Motobayashi, K. Yabana, M. Ueda, M. Takashina, and K. Hencken are greatly appreciated. We thank also B. Abu-Ibrahim, Y. Ogawa, and Y. Suzuki for the useful suggestions on the eikonal calculation code IBRA03 . The present work was supported in part by a Grant-in-Aid for Scientific Research (No.15540257) from the Ministry of Education, Culture, Sports, Science and Technology (MEXT, Japan).
References
- (1) P.G. Hansen, A.S. Jensen, and B. Jonson, Annu. Rev. Nucl. Sci. 45, 591 (1995), and references therein.
- (2) I. Tanihata, Prog. Part. Nucl. Phys. 35, 505 (1995), and references therein.
- (3) I. Tanihata, H. Hamagaki, O. Hashimoto, Y. Shida, N. Yoshikawa, K. Sugimoto, O. Yamakawa, T. Kobayashi, and N. Takahashi, Phys. Rev. Lett. 55, 2676 (1985).
- (4) T. Kobayashi et al., Phys. Rev. Lett. 60, 2599 (1988).
- (5) N. Orr et al., Phys. Rev. Lett. 69, 2050 (1992).
- (6) T. Aumann et al., Phys. Rev. Lett. 84, 35 (2000).
- (7) T. Kobayashi et al., Phys. Lett. B 232, 51 (1989).
- (8) K. Ikeda et al., Nucl. Phys. A 538, 355c (1992).
- (9) T. Nakamura et al., Phys. Lett. B 331, 296 (1994).
- (10) T. Nakamura et al., Phys. Rev. Lett. 83, 1112 (1999).
- (11) T. Aumann et al., Phys. Rev. C 59, 1252 (1999).
- (12) K. Ieki et al., Phys. Rev. Lett. 70, 730 (1993); D. Sackett et al., Phys. Rev. C 48 118 (1993).
- (13) S. Shimoura et al., Phys. Lett. B 348, 29 (1995).
- (14) M. Zinser et al., Nucl. Phys. A 619, 151 (1997).
- (15) M. Labiche et al., Phys. Rev. Lett. 86, 600 (2001).
- (16) T. Otsuka et al., Phys. Rev. C 49, 2289R (1994).
- (17) A. Mengoni et al., in Proceedings of the International Symposium on Capture gamma-ray and Related topics, edited by G.L. Molnar, T. Belgya and Zs. Revay, (Springer, 1997), p. 416.
- (18) M.A. Nagarajan, C.H.Dasso, S.M. Lenzi, and A. Vitturi, Phys. Lett. B 503, 65 (2001).
- (19) C.H. Dasso, S.M. Lenzi, and A. Vitturi, Phys. Rev. C 59, 539 (1999).
- (20) S. Typel and G. Baur, Phys. Rev. C 64, 024601 (2001).
- (21) S. Typel and R. Shyam, Phys. Rev. C 64, 024605 (2001).
- (22) C.A. Bertulani and L.F. Canto, Nucl. Phys. A 539, 163 (1992).
- (23) G. Baur, C.A. Bertulani, and D.M. Kalassa, Nucl. Phys. A 550, 527 (1992).
- (24) H. Esbensen, G.F. Bertsch, and C.A. Bertulani, Nucl. Phys. A 581, 107 (1995).
- (25) J. Margueron, A. Bonaccorso, and D.M. Brink, Nucl. Phys. A 703, 105 (2002).
- (26) J. Margueron, A. Bonaccorso, and D.M. Brink, Nucl. Phys. A 720, 337 (2003).
- (27) I.J. Thompson and J.A. Tostevin, Nucl. Phys. A 690, 294c (2001).
- (28) G. Baur, K. Hencken, and D. Trautmann, Progr. Part. Nucl. Phys. 51, 487 (2003).
- (29) G. Audi and A.H. Wapstra, Nucl. Phys. A 565, 1 (1993); G. Audi, A.H. Wapstra and M. Dedieu, Nucl. Phys. A 565, 193 (1993), and references therein.
- (30) R. Anne et al., Phys. Lett. B 304, 55 (1993); R. Anne et al., Nucl. Phys. A 575, 125 (1994).
- (31) R. Palit et al., Phys. Rev. C 68, 034318 (2003).
- (32) T. Kubo et al., Nucl. Instrum. and Methods., B 70, 309 (1992).
- (33) K. Hencken, G. Bertsch, and H. Esbensen, Phys. Rev. C 54, 3043 (1996).
- (34) J.D. Jackson, Classical Electrodynamics, 2nd Edition (Wiley, New York 1975).
- (35) C. Bertulani and G. Baur, Phys. Rep. 163, 299 (1988).
- (36) J. Raynal, Coupled channel code ECIS97, also Notes on ECIS94, unpublished.
- (37) U. Datta Pramanik et al., Phys. Lett. B 551, 63 (2003).
- (38) J. Barrette et al., Phys. Lett. B 209, 182 (1988); R. Liguori Neto it et al., Nucl. Phys. A 560, 733 (1993).
- (39) B. Zwieglinski, W. Benenson, R.G.H. Robertson, and W.R. Coker, Nucl. Phys. A 315, 124 (1979).
- (40) N.K. Timofeyuk and R.C. Johnson, Phys. Rev. C 59 1545, (1999).
- (41) J.S. Winfield et al., Nucl. Phys. A 683, 48 (2001).
- (42) H. Esbensen and G.F. Bertsch, Phys. Rev. C 64, 014608 (2001).
- (43) H. Esbensen and G.F. Bertsch, Nucl. Phys. A 542, 310 (1992).
- (44) Y. Alhassid, M. Gai, and G.F. Bertsch, Phys. Rev. Lett. 49, 1482 (1982).
- (45) F. Ajzenberg-Selove, Nucl. Phys. A 506, 1 (1990).
- (46) G.-B. Liu and H.T. Fortune, Phys. Rev. C 42, 167 (1990).
- (47) P. Roussel-Chomaz, private communication; R.C. Johnson, J.S. Al-Khalili, and J.A. Tostevin, Phys. Rev. Lett., 79, 2771, (1997); The optical potential parameters were calculated by M. Takashina, private communication.
- (48) M. Buenard et al., Nucl. Phys. A 424, 313 (1982).
- (49) OXBASH, The Oxford, Buenos-Aires, Michigan State, Shell Model Program, B.A. Brown, A. Etchegoyen, W.D.M. Rae, MSU Cyclotron Laboratory Report number 524 (1986).
- (50) E.K. Warburton and B.A. Brown, Phys. Rev. C 46, 923 (1992).
- (51) A.M. Bernstein, V.R. Brown, and V.A. Madsen, Phys. Lett. B 103, 255 (1981); A.M. Bernstein, V.R. Brown, and V.A. Madsen, Comments Nucl. Part. Phys. 11 203 (1983)
- (52) B.A. Brown and B.H. Wildenthal, Ann. Rev. Nucl. Part. Sci. 38, 29 (1988).
- (53) M.N. Harakeh and A.E.L. Dieperink, Phys. Rev. C 23, 2329 (1981).
- (54) R. Serber, Phys. Rev. 72, 1008 (1947).
- (55) B. Abu-Ibrahim, Y. Ogawa, Y. Suzuki, and I. Tanihata, Comp. Phys. Com. 151, 369 (2003).