Transverse momentum and rapidity dependence of HBT
correlations
in Au+Au collisions at 62.4 and 200 GeV
Abstract
Two-particle correlations of identical charged pion pairs from Au+Au collisions at and 200 GeV were measured by the PHOBOS experiment at RHIC. Data for the 15% most central events were analyzed with Bertsch-Pratt and Yano-Koonin-Podgoretskii parameterizations using pairs with rapidities of and transverse momenta GeV/c. The Bertsch-Pratt radii and decrease as a function of pair transverse momentum, while is consistent with a weaker dependence. and are independent of collision energy, while shows a slight increase. The source rapidity scales roughly with the pair rapidity , indicating strong dynamical correlations.
pacs:
25.75.-q,25.75.Dw,25.75.GzRecent experimental results from all four experiments at the Relativistic Heavy Ion Collider (RHIC) have concluded that Au+Au collisions at the top RHIC energy ( GeV) have produced an extremely hot and dense state of matter phob_da ; star_da ; phen_da ; bram_da . This matter may have degrees of freedom that are purely hadronic (“hadronic gas”), purely partonic (“Quark-Gluon Plasma”, QGP), or an admixture of both. Identical-particle correlation measurements (Hanbury-Brown and Twiss, HBT) yield valuable information on the size, shape, duration, and spatiotemporal evolution of the emission source. Because the dynamics of a hadron gas and a QGP are naïvely expected to be quite different, HBT may allow us to discriminate between these three scenarios pratt84 ; pratt86 .
Experimentally, the correlation function is defined as
| (1) |
where and are the particle four-momenta, is the probability of a pair being measured with relative four-momentum , and and are the single-particle probabilities. The numerator is determined directly from data, while the denominator is constructed using a standard event-mixing technique.
can be fit to the Bertsch-Pratt parameterization of a Gaussian source in three dimensions bertschparam ; pratt86 ; crossterm ,
| (2) |
where is the component of along the beam direction; is the component along the pair transverse momentum ; and is the component orthogonal to the other two. The cross-term vanishes only for symmetric collisions with acceptances centered around midrapidity. The parameter represents the correlation strength and is expected to be unity for a completely incoherent source. According to the definitions of and , probes a mixture of the spatial and temporal extent of the source, while measures only the spatial component. In the special case of a boost-invariant, transparent, azimuthally symmetric source, the ratio may be a good indicator of the duration of the emission of particles from the source. Predictions for this quantity from hydrodynamic and transport models varied by over an order of magnitude gyulassy96 ; soff , but mostly focused on values between 1.5–2.0, while the first results from RHIC at GeV indicated a value near unity star130 ; phenix130 . A more recent three-dimensional hydrodynamic calculation (including opacity and tranverse flow) morita also was unable to reproduce the experimentally measured values for . The results at GeV also were consistent with a monotonic increase of from AGS energies ( 2–5 GeV), while and remained roughly constant. It should be noted that it is possible to fit the experimental data at RHIC to a variety of ansätze budalund ; blastwave ; renk , but the interpretation remains an open question. The wealth of HBT data over a large number of variables and their experimentally-determined systematic dependencies continue to create new challenges for theorists and add yet more pieces to the “HBT puzzle”.
The data reported here for Au+Au collisions at and 200 GeV were collected using the PHOBOS two-arm magnetic spectrometer during RHIC Run IV (2004) and Run II (2001), respectively. Details of the setup have been described previously phob_NIM . The spectrometer arms are each equipped with 16 layers of silicon sensors, providing charged particle reconstruction both outside and inside a 2 T magnetic field. The two symmetric arms and frequent magnetic field polarity reversals allowed for a number of independent cross-checks in the two-particle correlation measurement. A two layer silicon detector covering and 25% of the azimuthal angle provided additional information on the position of the primary collision vertex.
The primary event trigger was provided by two sets of 16 scintillator paddle counters, which covered a pseudorapidity range . More information on PHOBOS event selection and centrality determination can be found in phobos1 ; phobos2 .
The details of the track reconstruction algorithm can be found in phob_pbarp130 ; phob_spectra200 . Events with a reconstructed primary vertex position between -12 cm 10 cm along the beam direction and -0.1 0.2 cm and -0.05 0.2 cm along the transverse directions were selected to optimize vertex-finding precision, track reconstruction efficiency, and momentum resolution. Only particles which traversed the entire spectrometer were used in the analysis. A cut on the distance of closest approach of each reconstructed track with respect to the primary vertex ( cm) was used to reject background particles from decays and secondary interactions.
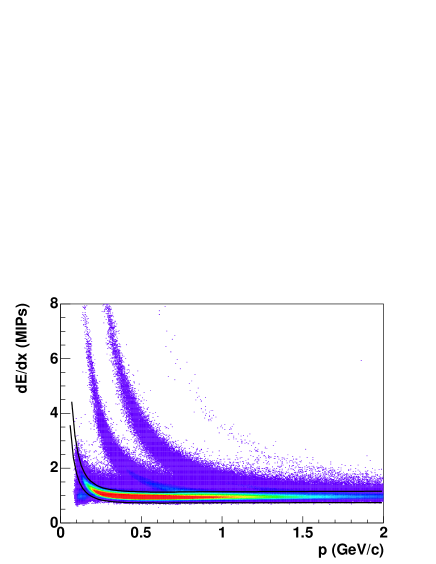
The final track selection was based on the probability of a full track fit, taking into account multiple scattering and energy loss. The momentum resolution is after all cuts. Particle identification was based on the truncated mean of the specific ionization loss in the silicon detectors. To identify pions, a cut of three RMS deviations away from the expected mean value of the specific ionization for pions was applied. This is shown as the region between the solid black lines in Fig. 1. Possible contamination from other particle species was studied using HIJING 1.35 HIJING and a GEANT 3.21 GEANT simulation of the full detector, applying the same reconstruction procedures to Monte Carlo events and data. The contamination from , , pp, , , and pairs is estimated to be less than 1%; non-identical pairs are estimated to contribute less than 10% throughout the entire range. To reject ghost pairs, only one shared hit out of six in the weak-field region and two shared hits out of five in the strong-field region were allowed per pair. A two-particle acceptance cut was applied to both data and background; the criterion for pair acceptance was defined by rad, where and are the relative pair separation in azimuthal and polar angle, respectively. In this analysis, events in the most central 15% of the cross section were selected. HIJING was used to relate the fraction of the cross section to , the mean number of participating nucleons phobos1 . The average number of participants for these events was estimated to be (303) at (62.4) GeV. About 7.3 (3.3) million and 5.5 (3.0) million pairs for (62.4) GeV survive all cuts including centrality selection.
The event-mixed background is constructed by combining single tracks from randomly selected different events into fake pairs. Events from widely spaced collision vertices may yield a background that cannot reproduce the same phase space as the actual data. This effect is particularly prominent for a small-acceptance detector such as PHOBOS. In this analysis, an “event class” is defined solely by the vertex resolution of the detector. Events were defined as belonging to the same event class if they had vertices within cm along the beam axis and cm along the vertical and horizontal axes. Background events are only constructed from tracks mixed from the same event class.
Systematic errors (90% C.L.) were determined by changing cuts in two-particle acceptance and single-track azimuthal acceptance, using different random seeds for mixed-event background generation, as well as varying the event class definition to create background events from pairs with narrower and broader vertex ranges. Additionally, these studies were performed for each individual spectrometer arm and the differences included in the systematic uncertainties.
Because the background is constructed from tracks belonging to different events, it does not a priori include multiparticle correlations (apart from a residual effect at the few percent level, which has been corrected following zajc84 ; cianciolo_thesis ). In order to study the HBT correlation, it is necessary to apply a weight to account for the Coulomb effect. The Coulomb correction can be expressed solely as a function of the invariant relative 4-momentum ,
| (3) |
where is the distribution of the relative separation of the particle pairs at emission, is the radius parameter conjugate to , and and are the Coulomb and plane wave-functions, respectively. A closed-form approximation and numerical interpolation for this relation was derived in 859_hbt for .
For variable holzman04 ,
| (4) |
This prescription was derived simultaneously and is nearly equivalent to the corrections applied by the CERES ceres , STAR star200 , and PHENIX experiments phenix200 ; our results showed no significant change using either correction method. The method is applied iteratively, successively fitting distributions of the correlation function and applying the fit values and to a new . Typically 2 or 3 iterations are sufficient for convergence.
The three-dimensional correlation functions were fit by Eq. (2) using MINUIT and the log-likelihood method. Table 1 shows the results of the fit for both and . The data were analyzed in the longitudinal co-moving system (LCMS) frame.
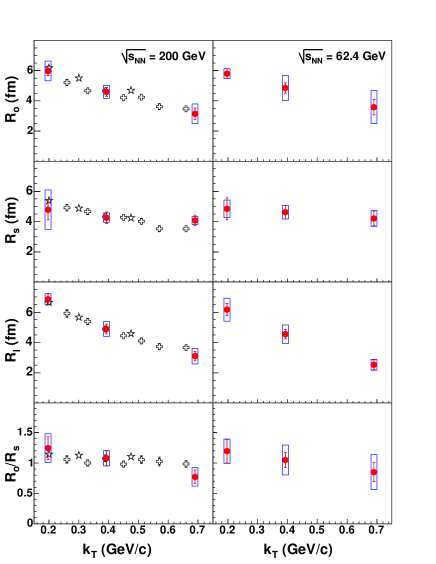
In Fig. 2, the Bertsch-Pratt parameters and the ratio are presented as a function of for pairs at GeV and GeV. The 200 GeV data are compared to data from STAR star200 and PHENIX phenix200 . Not shown are values for , which is roughly , and the cross-term , which is consistent with zero for all bins. The small vertical acceptance of the PHOBOS detector roughly translates into a small acceptance in , which is responsible for the large statistical and systematic uncertainties on the value of at low . Within errors, the values of are consistent with a weak dependence on , while the values of and decrease rapidly with increasing . Consequently, the ratio decreases from to for from 0.2 to 0.7 GeV/c. It should be noted that the STAR and PHENIX data are measured at midrapidity while the PHOBOS data are measured at ; additionally, STAR, PHOBOS, and PHENIX data are from the top 10%, 15%, and 30% of the cross-section respectively.
Despite the very different experimental acceptances, the data at 200 GeV agree remarkably well. The trends at GeV are qualitatively and quantitatively similar to those at 200 GeV, except that may be slightly smaller.
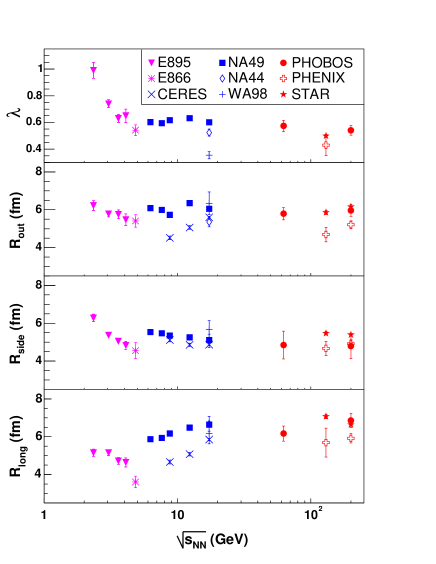
The Bertsch-Pratt parameters , , , and are presented in Fig. 3 as a function of center of mass energy from to 200 GeV. The data are pairs near midrapidity for comparable bins from nine different experiments. The data at GeV begin to fill the large gap between the top SPS energy and the 130 GeV RHIC data. Although there is some disagreement among experiments, the data do not appear to exhibit any sharp discontinuities, but smoothly vary as a function of collision energy.
The correlation function was also fit to the Yano-Koonin-Podgoretskii (YKP) parameterization yanokoonin ; podgoretskii
| (5) |
where is the longitudinal velocity of the source and , and are the relative 3-momentum difference projected in the transverse and longitudinal directions, respectively, and is the relative difference in energy. Employing this coordinate system provides the advantange of factorizing the velocity and duration of the source from the spatial parameters. In addition to fits in the LCMS frame, data were also fit in the laboratory frame as a cross-check and yielded consistent results.
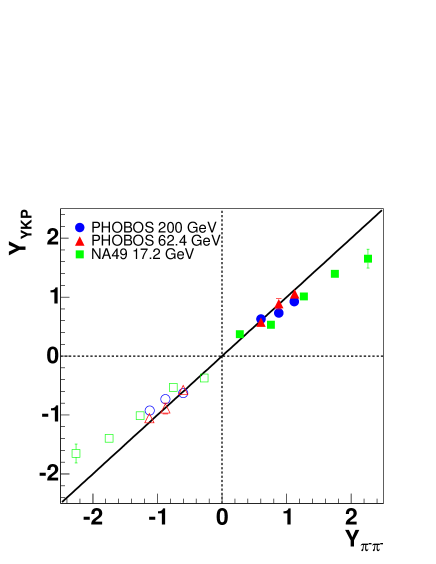
Table 2 shows the results of Yano-Koonin-Podgoretskii fits for and at both energies. In Fig. 4, the value of the source rapidity (as extracted from in Eq. 5) is plotted as a function of pair rapidity for pairs with GeV/c. Open circles indicate the results reflected about midrapidity. The data from NA49 na49ykp at GeV is also plotted; however, it should be noted the NA49 data presented here cover only GeV/c. The source rapidity scales with the rapidity of the pair, indicating the presence of strong position-momentum correlations. A static source would exhibit no correlation and would correspond to a horizontal line (). A source with strong dynamical correlations would correspond to a straight line along . The data are consistent with the latter scenario: particles emitted at a given rapidity were produced by a source moving collectively at the same rapidity.
| Species | (fm2) | ||||||
|---|---|---|---|---|---|---|---|
| 0.198 | |||||||
| 62.4 GeV | 0.392 | ||||||
| 0.680 | |||||||
| 0.198 | |||||||
| 62.4 GeV | 0.391 | ||||||
| 0.673 | |||||||
| 0.198 | |||||||
| 200 GeV | 0.393 | ||||||
| 0.685 | |||||||
| 0.198 | |||||||
| 200 GeV | 0.393 | ||||||
| 0.690 |
| Species | |||||||
|---|---|---|---|---|---|---|---|
| 0.602 | |||||||
| 62.4 GeV | 0.879 | ||||||
| 1.124 | |||||||
| 0.602 | |||||||
| 62.4 GeV | 0.878 | ||||||
| 1.124 | |||||||
| 0.602 | |||||||
| 200 GeV | 0.878 | ||||||
| 1.119 | |||||||
| 0.602 | |||||||
| 200 GeV | 0.877 | ||||||
| 1.122 |
In conclusion, we have measured HBT parameters in Au+Au collisions with the PHOBOS detector using both the Bertsch-Pratt and Yano-Koonin-Podgoretskii parameterizations at energies of GeV and 200 GeV. The ratio does not show significant deviation from unity over the entire range. The data at 200 GeV show a nice agreement between three RHIC experiments with different acceptances, centrality measures, and rapidity, which implies that the source parameters are fairly insensitive to these variables at this energy. Additionally, the Bertsch-Pratt parameters evolve smoothly as a function of over nearly two orders of magnitude.
This work was partially supported by U.S. DOE grants DE-AC02-98CH10886, DE-FG02-93ER40802, DE-FC02-94ER40818, DE-FG02-94ER40865, DE-FG02-99ER41099, and W-31-109-ENG-38, by U.S. NSF grants 9603486, 0072204, and 0245011, by Polish KBN grant 1-PO3B-062-27(2004-2007), and by NSC of Taiwan Contract NSC 89-2112-M-008-024.
References
- (1) B. B. Back et al., Phys. Rev. Lett. 91, 072302 (2003).
- (2) S. S. Adler et al., Phys. Rev. Lett. 91, 072303 (2003).
- (3) J. Adams et al., Phys. Rev. Lett. 91, 072304 (2003).
- (4) I. Arsene et al., Phys. Rev. Lett. 91, 072305 (2003).
- (5) S. Pratt, Phys. Rev. Lett. 53, 1219 (1984).
- (6) S. Pratt, Phys. Rev. D33, 1314 (1986).
- (7) G. Bertsch, Nucl. Phys. A498, 173 (1989).
- (8) S. Chapman, P. Scotto and U. Heinz, Phys. Rev. Lett. 74, 4400 (1995).
- (9) D. H. Rischke and M. Gyulassy, Nucl. Phys. A608, 479 (1996).
- (10) S. Soff, S. A. Bass and A. Dumitru, Phys. Rev. Lett. 86, 3981 (2001).
- (11) C. Adler et al., Phys. Rev. Lett. 87, 082301 (2001).
- (12) K. Adcox et al., Phys. Rev. Lett. 88, 192302 (2002).
- (13) K. Morita and S. Muroya, Prog. Theor. Phys. 111, 93 (2004).
- (14) M. Csanád et al., nucl-th/0403074.
- (15) F. Retière and M. A. Lisa, nucl-th/0312024.
- (16) T. Renk, Phys. Rev. C69, 044902 (2004).
- (17) B. B. Back et al., Nucl. Inst. Meth. A499, 603 (2003).
- (18) B. B. Back et al., Phys. Rev. Lett. 85, 3100 (2000).
- (19) B. B. Back et al., Nucl. Phys. A698, 555 (2002).
- (20) B. B. Back et al., Phys. Rev. Lett. 87, 102301 (2001).
- (21) B. B. Back et al., Phys. Lett. B578, 297 (2004).
- (22) M. Gyulassy and X. N. Wang, Comput. Phys. Commun. 83, 307 (1994).
- (23) GEANT 3.2.1, CERN program library.
- (24) W. Zajc et al., Phys. Rev. C29, 2173 (1984).
- (25) V. Cianciolo, Ph. D. thesis, M.I.T. (1994).
- (26) L. Ahle et al., Phys. Rev. C66, 054906 (2002).
- (27) B. Holzman et al., nucl-ex/0406027.
- (28) D. Adamová et al., Nucl. Phys. A714, 124 (2003).
- (29) J. Adams et al., Phys. Rev. Lett. 93, 012301 (2004).
- (30) S. S. Adler et al., nucl-ex/0401003.
- (31) F. Yano and S. Koonin, Phys. Lett. B78, 556 (1978).
- (32) M. Podgoretskii, Sov. J. Nucl. Phys. 37, 272 (1983).
- (33) H. Appelshäuser et al., Eur. Phys. J. C2, 661 (1998).
- (34) M. A. Lisa et al., Phys. Rev. Lett. 84, 2798 (2000).
- (35) I. G. Bearden et al., Phys. Rev. C58, 1656 (1998).
- (36) S. Kniege et al., nucl-ex/0403034.
- (37) M. M. Aggarwal et al., Eur. Phys. J. C16, 445 (2000).