Observation of decay of 115In to the first excited level of 115Sn
Abstract
In the context of the LENS R&D solar neutrino project, the spectrum of a sample of metallic indium was measured using a single experimental setup of 4 HP-Ge detectors located underground at the Gran Sasso National Laboratories (LNGS), Italy. A line at the energy (497.480.21) keV was found that is not present in the background spectrum and that can be identified as a quantum following the decay of 115In to the first excited state of 115Sn (). This decay channel of 115In, which is reported here for the first time, has an extremely low -value, = (24) keV, and has a much lower probability than the well-known ground state-ground state transition, being the branching ratio . This could be the decay with the lowest known -value. The limit on charge non-conserving decay of 115In is set at 90% C.L. as y.
keywords:
Indium , decay , spectroscopyPACS:
23.20.Lv , 23.40.-s , 27.60.+j, , , ,
1 Introduction
115In has been envisaged in the LENS project (Low Energy
Neutrino Spectroscopy) as a possible target for the real-time measurement of
low energy solar neutrinos. The detection principle is based on the inverse
electron capture (EC) reaction 115In(,e-)115Sn∗ on
115In, which has a threshold energy of 114 keV and populates the
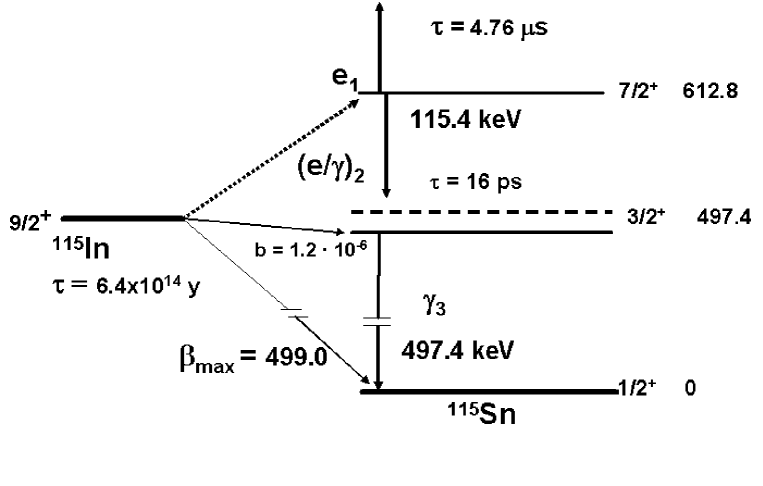
second excited state of 115Sn at 613 keV (see Fig. 5 later).
This state is metastable, with a life time = 4.76 s, and its
subsequent two-step decay to the ground state provides an highly specific
signature [1]. Namely, the prompt electron emitted in the
inverse-EC
reaction () is followed, with a typical delay of =4.76 s,
by a localized deposition of 116 keV ()2, in spatial
coincidence, and
by a -ray () of 497 keV (see Fig. 5).
Though 115In has several favorable features as a target
for low energy solar neutrinos (high isotopic abundance, low threshold,
strong -tag), the detection technique is extremely challenging
because 115In is unstable and can -decay directly to the
115Sn ground state. The specific activity of natural indium is 0.25
Bq/g and thus indium itself is the major irremovable source of background.
The LENS R&D project has demonstrated that the 106 background
suppression factor needed for the pp solar neutrino measurement
can be achieved, however at the cost of a very high segmentation
( cells) and of an one-order-of-magnitude increase of the
overall detector mass [1].
The most serious background that has to be faced is related to the
coincidence of two spatially-close indium decays. The coincidence of two
115In decays can mimic the -tag if the second has energy
close to the end point and emits a hard bremsstrahlung . The
importance of this source of background depends on the granularity of the
detector (because of the requirement of spatial coincidence), on the
energy resolution and on the indium bremsstrahlung spectrum. In order to
have a better comprehension and characterization of the bremsstrahlung, a
measurement of the spectrum of
an indium sample was performed with HP-Ge detectors
in the Low-Level Background Facility underground in the Gran Sasso
National Laboratories, Italy. During the analysis of the data we found evidence
for a previously unknown decay of 115In to the first excited level
of 115Sn, at the energy 497.4 keV.
In Section 2 we describe the indium sample and the experimental
details of the measurement. In Section 3 we present the spectrum and
the evidence for the line at 497 keV. In Section 4 we
discuss the interpretation of this line in terms of decay of 115In to the
first excited state of 115Sn and the consequent limit set on the 115In charge non-conserving decay. Finally, in Section 5 we
summarize our results and briefly describe some
possible future perspectives.
2 The setup
2.1 The sample and the detector
The sample used for the measurement consists of an ingot of metallic natIn
of mass (928.70.1) g. It has the shape of a cylindrical shell, with the
approximate
dimensions of 2.0 cm (internal diameter), 5.5 cm (external diameter) and 6.5 cm
(height).
The high-purity indium (6N5 grade) used for the production of the sample has been
provided by the Indium Corporation of America in May 2002.
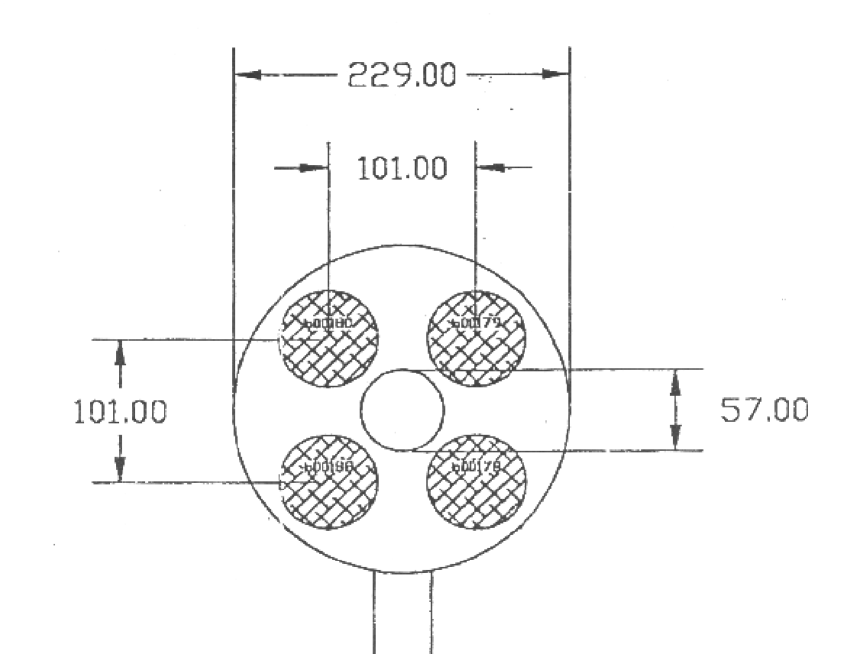
The spectrum of the indium source was measured using a set of 4 HP-Ge detectors
installed underground
at LNGS. The detectors are very similar coaxial
germanium crystals mounted altogether in one cryostat made by
Canberra; their main parameters are displayed in Table
1. They are arranged as shown in Fig. 1
and surround the indium sample, which is placed in the central well.
The experimental setup is enclosed in
a lead/copper passive shielding and has a nitrogen ventilation system against
radon.
One measurement of the indium ingot (2762.3 h of counting time for
each detector) and one of the background (1601.0 h) were carried out,
both with the complete shielding around the detectors.
| Detectors | ||||
|---|---|---|---|---|
| ge178 | ge179 | ge180 | ge188 | |
| Volume (cm3) | 225.2 | 225.0 | 225.0 | 220.7 |
| Endcap and holder material | Electrolytical Copper | |||
| Energy resolution (FWHM) at 1332 keV | 2.1 | 2.0 | 2.0 | 2.0 |
2.2 Detector performances
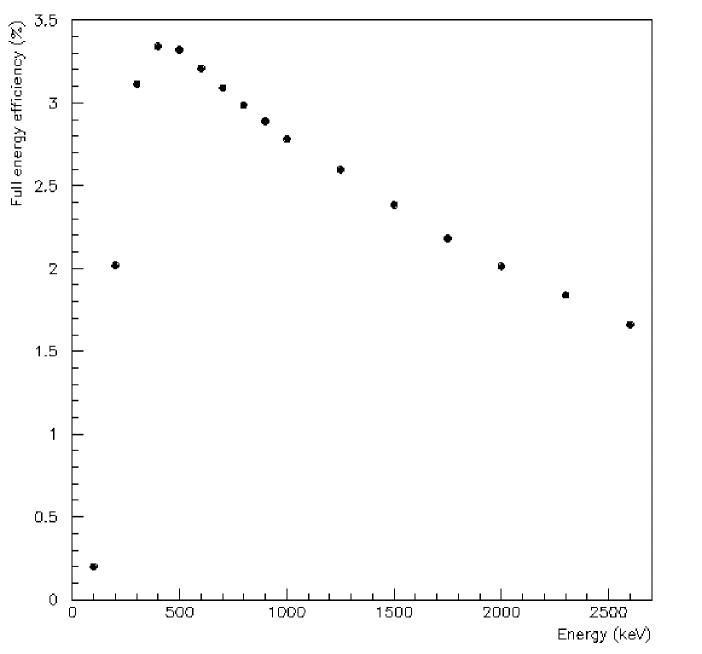
The detectors show a very good energy resolution and linearity. The efficiency of the configuration (detectors and ingot) has been evaluated using the Geant4-based code Jazzy, developed by O. Cremonesi111INFN Milano and Milano Bicocca University.. The computed full energy efficiency, i.e. the probability that a ray produced in a random position of the indium ingot deposits its full energy in one of the four Ge detectors, is displayed in Fig. 2 as a function of energy.
The Monte Carlo code has been checked, with the procedure described in Ref. [2], using a previous measurement performed in the same setup with a 60Co source (1173 keV and 1332 keV). Taking into account the 2505 keV sum peak in the experimental spectrum and neglecting the angular correlations of the two photons, the measured absolute efficiencies in this configuration agree with the computed ones at 12 and are consistent within their statistical uncertainities. On the basis of our previous experience with similar simulations of analogous experimental setups we estimate the systematic uncertainty on the Monte Carlo efficiencies to be 10%. In any case, the knowledge of the absolute efficiency at the few level is not needed for the present analysis, as it does not represent the main contribution to the uncertainty on the measured 115In 115Sn∗ decay rate (see Sect. 4). For this reason, we can conclude that our knowledge of the detector and of the absolute efficiency is satisfactory for our purposes.
3 Analysis of the measured spectra
3.1 Comparison of indium and background spectra
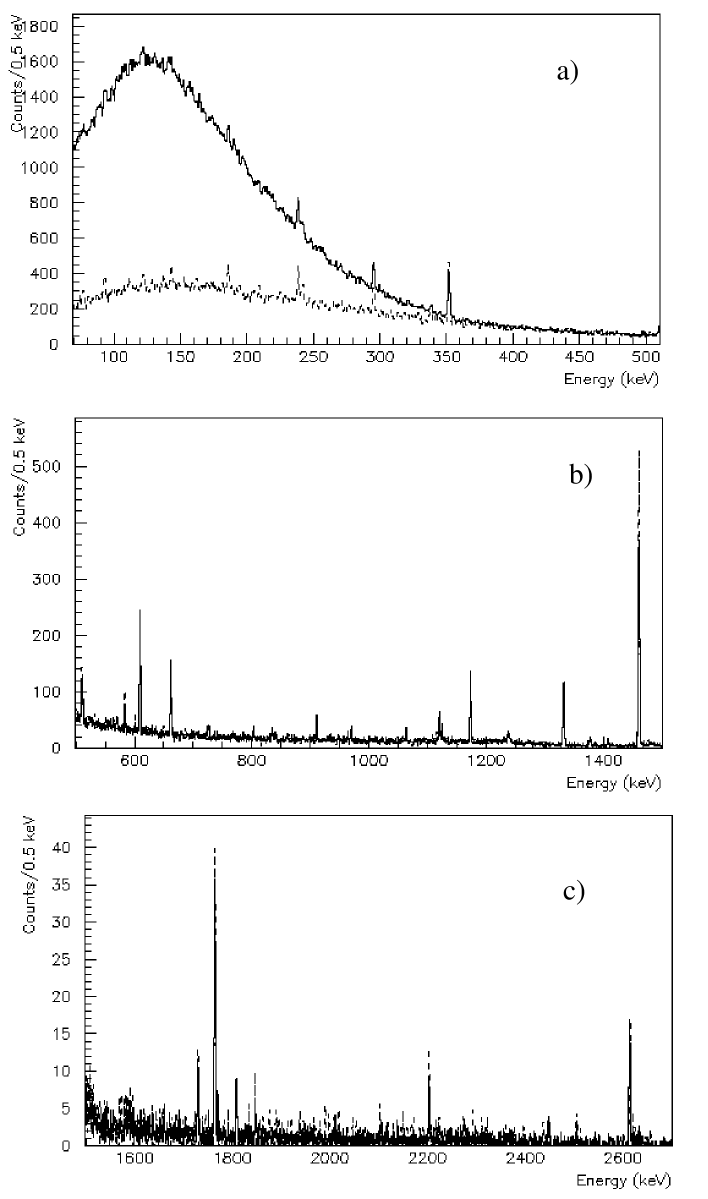
The spectra obtained by the four detectors for the indium sample and for the background
have been added (see Fig. 3) and analyzed using both
an automatic program
and visual inspection. In the
indium measurement, besides the continuous component (see Fig. 3a) due to the bremsstrahlung of
the electrons from the decay of 115In (end point: 499 keV), 42 lines
with energy above 200 keV could be identified: they are listed, together with their interpretation,
in Table Observation of decay of 115In to the first excited
level of 115Sn. The same lines, except the one at (497.480.21)
keV (which represents the main point of this paper and will be discussed in detail in the
following sections), are also found in the background spectrum, though some of them (e.g.
795, 1588 and 2447 keV) have a poor statistical significance because of the shorter
measurement time. As shown in Table Observation of decay of 115In to the first excited
level of 115Sn, the observed lines come from the
natural radionuclides and radioactive series (40K, 238U, 235U, 232Th) and
from cosmogenic or antropogenic nuclides (60Co, 137Cs, 207Bi,
26Al) that are usually
present as contaminations in normal copper and lead. The same Table
shows the counting rates of the
lines for the indium sample and the background, as well as their difference
(statistical errors only). For each line (except the one at 497 keV) the difference turns out to be
statistically consistent with zero. Hence there is
no statistical evidence of radioactive contamination of the indium sample, since the data are
consistent with contaminations of the experimental setup only (germanium crystals and passive
lead/copper shielding).
The efficiencies quoted in Table
Observation of decay of 115In to the first excited
level of 115Sn (full energy efficiencies) have been calculated in the hypothesis that the
rays are generated inside the indium sample so they include the effect of
self-absorption in the ingot itself.
The fact that in some cases the indium-background
difference rate is negative (though statistically consistent with zero) is explained because
indium is an effective ray absorber (the atomic number is 49) and can hence act as an
additional shielding for the Ge detectors with respect to the background measurement, where the
well is filled with a plexiglas plug.
3.2 The 497 keV line
As anticipated in Sect. 3.1, the only line of the indium spectrum which is not present in the background measurement and cannot be ascribed to the usual radioactive contaminants is located at the energy of (497.480.21) keV. The interesting region of the spectrum is shown in Fig. 4.
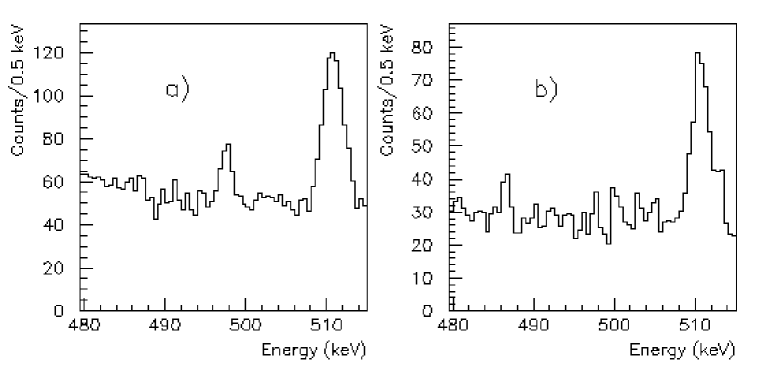
From the fit of the indium spectrum in the
energy region (487-508) keV with a Gaussian peak and linear background assumption,
we get a net area of (9022) counts, inconsistent
with zero at more than 4. This
corresponds to a counting rate of (0.780.19) counts/day. Variations
of the energy interval for the fit result in changes of the area inside the quoted uncertainty.
With the same procedure applied to the background spectrum, no Gaussian peak could be found
and the resulting area is (014) counts; the corresponding upper limit derived with the
Feldman-Cousins method [3] is 23.0 counts (90 CL) or
0.34 counts/day (90 CL).
It can hence be concluded that the peak under examination is statistically significant and
related with the indium sample, being absent in the background measurement.
4 Interpretation
4.1 Decay of 115In to the first excited state of 115Sn
The peak with the energy (497.480.21) keV found in the indium measurement and absent in
the background one can be explained with the decay of 115In to the first excited
level of 115Sn, whose excitation energy is 497.4 keV. Such a process has never been
observed previously and the decay of 115In was considered
up-to-date as going exclusively to the ground state of 115Sn [4, 5, 6].
Because of the large change in the nuclear angular momentum
(),
the ground state to ground state decay of 115In is a 4th forbidden transition
and has one of the largest known values ( 22.5). The measured half life
of 115In is y [4, 5, 6, 7].
According to the most recent table of atomic masses [8], the mass difference
between 115In and 115Sn is (4994) keV.
The decay 115In Sn∗ to the first excited level of 115Sn is hence
kinematically allowed, though with an extremely small value,
= (1.64.0) keV.
Using the area of the 497 keV peak observed in the indium spectrum, the
decay rate for the transition to the first excited level of 115Sn can be evaluated
through the relation
| (1) |
where
is the efficiency to detect the full energy with the 4 Ge
detectors, is the number of 115In nuclei in the sample, is the measurement time, is
the area of the peak and is the coefficient of conversion of quanta to electrons
for the given nuclear transition.
The full peak efficiency at 497 keV is = (3.320.33)% and it was evaluated
using the Monte Carlo simulation described in Sect. 2.2.
Taking into account the total mass of the indium sample (928.7 g), the atomic weight of indium
(114.8 gmol-1) [9] and
the isotopic abundance of 115In (95.7%) [10], the number of 115In nuclei in our sample
results to be =4.66.
The area of the peak is (9022) counts (see Sect. 3.2) and the electron
conversion coefficient for the transition is =8.1 [5].
With these values and =2762.3 h, the decay rate for the 115In
decay to the first excited level of 115Sn is estimated to be
| (2) |
that corresponds to a partial half life of
| (3) |
The probability of this process is thus near one million times lower than for the transition to the ground state of 115Sn (see Fig. 5); the experimental branching ratio is
| (4) |
The uncertainty on the decay rate and on the branching ratio mainly comes from the statistical error on the net area of the 497 keV peak.
Nuclear spin and parity are changed in the observed transition from the initial of the 115In ground state to of 115Sn∗; this is therefore a 2nd forbidden unique decay. The recommended value of for such a decay is equal to (11.70.9) [11]. With the measured value of the half life of y, the “experimental” value can be calculated as . On the other hand, the value can be estimated using the formalism described in [12]:
| (5) |
where is the value for the allowed transition and is the correction for the 2nd forbidden unique decay. The factor can be written as
| (6) |
where is the phase space integral
| (7) |
is the energy release in the -decay in units of the electron mass and is the correction for a non-zero value of the daughter nucleus. The phase space integral can be analytically calculated as
| (8) |
while the values are tabulated in [12]. The correction can be estimated following Ref. [13] as:
| (9) |
In this way the value for keV is equal to
, which is in agreement with the experimental value of
.
The value can also be evaluated with the help of the LOGFT tool
at the National Nuclear Data Center, USA [14] which is based on
procedures described in [15]. The
value of for keV calculated with the LOGFT code
is however very different from the
previous estimation: ;
this means that with such a the beta decay should go near 6 orders of
magnitude faster. One can solve the inverse problem and use the LOGFT code to
adjust the value corresponding to the measured
.
Such a procedure gives an extremely low value of
eV.
While both these calculations can be considered as very tentative and
not being
intended to be used for such low energies, the last estimation gives a hint
that the value in the beta decay 115In 115Sn∗
can be very close to zero222Even the history of the evaluation
for 115In gives some indication for this:
the value was slightly
lower than energy of the first excited 497.4 keV 115Sn state
in accordance with older tables of atomic masses,
keV [16] and () keV [17],
while it is slightly higher in the last evaluation, () keV [8]..
Such a unique situation could be used to establish a limit on the
antineutrino mass,
in addition to the experiments with 3H and 187Re, where up-to-date limits
are in the range of 2 eV [18] and 15 eV [19], respectively.
To do this in a competitive way both the 115In -value and the energy
of the 115Sn 497.4 keV level should be measured with an accuracy of 1 eV
or better.
The uncertainty in the energy of the 497.4 keV level is equal now to 22 eV [5]
and it could be further reduced doing an accurate investigation of the 115Sb
decay333It can be noted that energies of many lines of calibration sources
are known with an accuracy of eV, also in the 500 keV region
of our interest [4]..
The atomic mass difference 115In – 115Sn can possibly also be measured with an
accuracy of 1 eV. For example, the mass difference of 76Ge –
76Se was determined with 50 eV uncertainty in Ref. [20],
where it was stated that the Penning traps technique is able to deliver
even more accurate results.
Both such measurements require strong experimental efforts but the
physical result could be very interesting and important.
4.2 Possible imitation of the effect
In some nuclear processes rays with energies close to 497 keV are emitted. This
could give an alternative explanation of the peak observed in the experimental spectrum. Luckily,
additional rays are also emitted in such decays, allowing to tag those
mimicking effects.
The 115In nucleus has an isomeric state 115mIn with the energy = 336.2 keV and
a half life of 4.5 h [4]. With the probability of 0.047%
the 115mIn nucleus -decays
to the first excited level of 115Sn, with the subsequent emission of a 497 keV ray
[4, 5, 6].
However, in this case a ray with the energy = 336.2 keV is emitted
with much higher probability (45.84 [4]) because of the electromagnetic transition
from the isomeric 115mIn to the ground 115In state.
This huge peak at 336.2 keV, whose area should be 103
times bigger than that of the observed 497.4 keV peak, is absent in the
experimental spectrum; only a peak at 338.3 keV is observed, with the net area of
(13850) counts,
which corresponds to the decay of 228Ac from the 232Th natural chain
(see Table Observation of decay of 115In to the first excited
level of 115Sn).
Therefore the decay of the isomeric state 115mIn is absolutely negligible
and the 497 keV peak cannot be ascribed to it, not even in part.
Similarly, given also the underground location of the
experimental setup and the low flux of neutrons [21],
we conclude that reactions cannot
contribute to the peak under analysis.
Protons produced by fast neutron or cosmic ray muons can populate the second excited level
of 115Sn (Fig. 5) via the reaction on 115In (=0.9 MeV);
the 115Sn nucleus quickly returns to the
ground state with the emission of two rays of energy 115.4 and 497.4 keV. The contribution
originated by fast neutrons is practically zero (see f.i. [22]) because of the deep
underground location and the lack of hydrogenous materials in the setup. On the
other hand, since the
muon flux in the laboratory is extremely low (1 /m2h [23]),
also the contribution
of reactions induced by cosmic rays (see also [24]) to the 497 keV peak
is absolutely negligible ( 10-3 counts).
Some decays from the natural 238U and 232Th chains can also give rays
in the energy region of interest, though with very low intensity.
They are in particular [4] 214Bi ( = 496.7 keV, = 0.0069%), 228Ac
( = 497.5 keV, = 0.0059%) and 234mPa ( = 498.0 keV, = 0.062%).
However, the sum
contribution of these decays to the 497 keV peak is less than 1 count and can be easily estimated
using their stronger associated lines.444For instance, the area of the 338.3 keV line
of 228Ac, whose relative intensity is 11.27%, is only (13850) counts. Therefore, if the
contamination were located in the indium ingot, the estimated contribution to the 497 keV peak,
taking also into account the different full peak efficiency, would be (7.32.6)10-2
counts.
We could not figure out other sources than can mimic the experimentally observed 497 keV peak.
4.3 Charge non-conserving decay of 115In
The present measurements give also the possibility to set a limit on the charge non-conserving (CNC) decay of 115In, a process in which the transformation is not accompanied by the emission of an electron [25, 26]. It is supposed that instead of an , a massless particle is emitted (for example a , a quantum, or a Majoron): or or M) + . Up-to-date, the CNC decay was searched for with four nuclides only: 71Ga, 73Ge, 87Rb and 113Cd. Only lower limits on corresponding life times were established, in the range of () y (we refer to the last work on this subject [27], where all previous attempts are reviewed). Measuring only the quanta from the deexcitation of the 497 keV level of 115Sn, we cannot distinguish, in principle, which mechanism leads to the detected 497 keV peak: the CNC beta decay or the usual charge-conserving beta decay to the excited level of 115Sn. If the whole area of the observed 497 keV peak is considered as belonging to the CNC beta decay (instead of the much less exotic usual -decay of 115In), and substituting in the formula for the life time the values of efficiency and other parameters described in section 4.1 together with , the Feldman-Cousins 90% CL limit on the life time of this process is
| (10) |
Though this value is relatively low, it is determined for the first time for 115In, expanding the scarce information on the CNC processes.
5 Conclusions
From the measurement of the spectrum of a sample of metallic indium
performed with HP-Ge detectors in the Low-Level Background Facility of the
Gran Sasso
Laboratory, we have found evidence for the previously unknown decay
of 115In to the first excited state of 115Sn at 497.4 keV
().
The -value for this channel is = (24) keV; this
could be lower than the -value of 163Ho,
=2.565 keV [4, 28],
and hence be the lowest of all the known decays. The branching
ratio is found to be . We also set a
limit on the charge non-conserving decay of 115In y (90% CL).
This measurement was carried out in the context of the LENS R&D project,
with the aim of better characterize the 115In bremsstrahlung spectrum, which is
poorly known near its end-point.
The discovered decay of 115In on the first excited state of 115Sn could in
principle be dangerous for the LENS solar neutrino measurement, since it
is an irremovable background source of 497 keV rays.
The coincidence of 115In decay on the ground state of 115Sn and one 115In decay
on the first excited state can in fact mimic the -tag and
the possible impact is currently under investigation.
In a future work we plan to study the possible atomic effects on the half life of the
115In 115Sn∗ decay by measuring a new sample where indium is
present in a different chemical form (e.g. InCl3 solution instead of metallic
indium).
We also point out that, given the extremely low value, the decay
reported in this work could be used in a future experiment to directly measure the
neutrino mass. In order to reduce the background due to the decay of 115In to the ground state of 115Sn, such experiment would need a rejection power
of , that could be achieved tagging the 497 keV ray emitted in
coincidence with the particle. New
In-based semiconductor detectors or fast bolometers could be used for the purpose.
6 Acknowledgments
The authors would like to thank O. Cremonesi, for providing his Monte Carlo code to estimate the efficiencies, E. Bellotti and Yu.G. Zdesenko, for their continuous support and useful advices, and A. di Vacri, who collaborated in the early stages of this work. We would also like to express our gratitude to D. Motta, for his valuable advices and feedback, and to the LNGS Mechanical Workshop, especially to E. Tatananni and B. Romualdi, for the melting of the indium ingot.
References
- [1] R.S. Raghavan, Phys. Rev. Lett. 37 (1976) 359; R.S. Raghavan, hep-ex/0106054; T. Bowles, Talk at VIII International Workshop on Topics in Astroparticle and Underground Physics (TAUP03), Seattle (2003), to appear in the Proceedings
- [2] C. Arpesella et al., Nucl. Instr. Meth. A 372 (1996) 415
- [3] G.J. Feldman and R.D. Cousins, Phys. Rev. D 57 (1998) 3873
- [4] R.B. Firestone et al., Table of Isotopes, John Wiley & Sons, New York, 8th Edition (1996) and CD update (1998)
- [5] J. Blachot, Nucl. Data Sheets 86 (1999) 151
- [6] G. Audi et al., Nucl. Phys. A 729 (2003) 3
- [7] L. Pfeiffer et al., Phys. Rev. C 19 (1979) 1035
- [8] G. Audi et al., Nucl. Phys. A 729 (2003) 337
- [9] J.R. De Laeter et al., Pure and Appl. Chem. 75 (2003) 683
- [10] Handbook of Chem. Phys., 84th Edition, CRC Press (2003-2004)
- [11] E.Kh. Akhmedov, Beta decay, in: A.M. Prokhorov (Ed.), Physical Encyclopedia, Vol. 1 (Moscow, Sovetskaya Enciklopediya, 1988), p. 190, in Russian
- [12] B.S. Dzhelepov et al., Beta Processes. Functions for analysis of beta-spectra and electron capture (Leningrad, Nauka, 1972), in Russian
- [13] J.P. Davidson, Jr., Phys. Rev. 82 (1951) 48
- [14] http://www.nndc.bnl.gov/nndc/physco
- [15] N.B. Gove, M.J. Martin, Nucl. Data Tables 10 (1971) 205
- [16] G. Audi, A.H. Wapstra, Nucl. Phys. A 565 (1993) 66
- [17] G. Audi, A.H. Wapstra, Nucl. Phys. A 595 (1995) 409
- [18] V.M. Lobashev, Nucl. Phys. A 719 (2003) 153
- [19] M. Sisti et al., Nucl. Instrum. Meth. A 520 (2004) 125
- [20] G. Douysset et al., Phys. Rev. Lett. 86 (2001) 4259
- [21] P. Belli et al., Nuovo Cimento 101 A (1989) 959
- [22] M. Cribier et al., Astrop. Phys. 4 (1995) 23
- [23] MACRO Collaboration, M. Ambrosio et al., Phys. Rev. D 52 (1995) 3793
- [24] M. Cribier et al., Astrop. Phys. 6 (1997) 129
- [25] G. Feinberg, M. Goldhaber, Proc. Nat. Acad. Sci. U.S.A. 45 (1959) 1301
- [26] L.B. Okun in: Particle Data Group, K. Hikasa et al., Phys. Rev. D 45 (1992) VI.10
- [27] A.A. Klimenko et al., Phys. Lett. B 535 (2002) 77
- [28] F.X. Hartmann and R.A. Naumann, Phys. Rev. C 31 (1985) 1594
| Database lines | Indium spectrum | Background spectrum | Difference | ||||||
|---|---|---|---|---|---|---|---|---|---|
| Energy | Decay | Chain | Intensity | Position | Rate | Position | Rate | ||
| (keV) | () | () | (keV) | c/day | (keV) | c/day | c/day | ||
| 238.63 | 212Pb | 232Th | 43.3 | 2.55 | 238.34 | 6.031.00 | 238.64 | 6.000.87 | 0.031.33 |
| 242.00 | 214Pb | 238U | 7.43 | 2.59 | 241.84 | 2.990.70 | 241.70 | 3.300.63 | -0.300.95 |
| 295.22 | 214Pb | 238U | 19.3 | 3.08 | 295.16 | 5.370.82 | 295.23 | 4.470.93 | 0.901.24 |
| 300.01 | 227Th | 235U | 2.32 | 3.11 | 299.46 | 0.820.63 | 300.73 | 0.690.51 | 0.130.81 |
| 300.07 | 212Pb | 232Th | 3.28 | 3.11 | |||||
| 338.32 | 228Ac | 232Th | 11.27 | 3.27 | 338.33 | 1.200.43 | 337.95 | 1.410.48 | -0.210.65 |
| 351.06 | 211Bi | 235U | 12.91 | 3.30 | 351.88 | 8.790.47 | 351.88 | 10.310.96 | -1.511.07 |
| 351.93 | 214Pb | 238U | 37.6 | 3.30 | |||||
| 3.32 | 497.480.21 | 0.780.19 | - | 0.34 (90 CL) | - | ||||
| 510.77 | 208Tl | 232Th | 22.6 | 3.31 | 510.83 | 4.500.34 | 510.65 | 4.200.51 | 0.300.67 |
| 510.99 | e+ ann | * | 3.31 | ||||||
| 569.70 | 211Po | 235U | 0.5 | 3.25 | 570.11 | 0.710.24 | 570.36 | 0.570.18 | 0.140.30 |
| 569.70 | 207Bi | * | 97.7 | 3.25 | |||||
| 583.19 | 208Tl | 232Th | 84.5 | 3.23 | 583.18 | 1.620.19 | 583.53 | 1.800.27 | -0.180.33 |
| 609.31 | 214Bi | 238U | 46.1 | 3.19 | 609.29 | 7.070.28 | 609.27 | 6.960.36 | 0.120.45 |
| 661.66 | 137Cs | * | 85.1 | 3.13 | 661.76 | 4.340.26 | 661.27 | 4.050.30 | 0.290.40 |
| 727.33 | 212Bi | 232Th | 6.58 | 3.06 | 727.20 | 0.910.28 | 727.15 | 0.470.33 | 0.440.43 |
| 768.36 | 214Bi | 238U | 4.96 | 3.02 | 767.69 | 0.730.36 | 768.04 | 0.450.18 | 0.280.41 |
| 794.95 | 228Ac | 232Th | 4.25 | 2.99 | 794.93 | 0.560.21 | - | 0.67 (90 CL) | - |
| 803.10 | 206Pb∗ | * | 2.98 | 803.11 | 0.710.23 | 803.17 | 1.170.33 | -0.460.40 | |
| 834.84 | 54Mn | * | 100.0 | 2.95 | 834.82 | 0.730.19 | 835.44 | 0.750.18 | -0.020.26 |
| 835.71 | 228Ac | 232Th | 1.61 | 2.95 | |||||
| 839.04 | 214Pb | 238U | 0.59 | 2.95 | 840.89 | 0.500.15 | 839.72 | 0.360.18 | 0.140.23 |
| 840.37 | 228Ac | 232Th | 0.91 | 2.95 | |||||
| 860.56 | 208Tl | 232Th | 12.42 | 2.93 | 859.29 | 0.640.43 | 861.34 | 0.510.39 | 0.130.58 |
| 911.20 | 228Ac | 232Th | 25.8 | 2.87 | 911.30 | 1.790.16 | 911.16 | 1.700.35 | 0.090.38 |
| 934.10 | 214Bi | 238U | 3.03 | 2.85 | 933.68 | 0.400.14 | 934.53 | 0.210.21 | 0.190.25 |
| 964.76 | 228Ac | 232Th | 4.99 | 2.82 | 963.60 | 0.410.19 | 964.44 | 0.270.12 | 0.150.23 |
| 968.97 | 228Ac | 232Th | 15.8 | 2.81 | 969.17 | 1.160.26 | 968.95 | 0.840.18 | 0.320.32 |
| 1001.03 | 234mPa | 238U | 0.84 | 2.78 | 1001.00 | 0.350.14 | 1001.43 | 0.300.15 | 0.050.20 |
| 1063.66 | 207Bi | * | 74.5 | 2.73 | 1063.35 | 0.780.14 | 1063.69 | 0.900.15 | -0.120.20 |
| 1120.29 | 214Bi | 238U | 15.1 | 2.68 | 1120.27 | 1.460.12 | 1119.91 | 1.560.18 | -0.100.22 |
| 1124.00 | 65Zn + Cu Kα | * | 50.6 | 2.68 | 1124.09 | 0.890.10 | 1124.02 | 0.960.12 | -0.070.16 |
| 1173.24 | 60Co | * | 99.97 | 2.65 | 1173.20 | 4.920.32 | 1173.22 | 4.560.48 | 0.360.58 |
| 1238.11 | 214Bi | 238U | 5.79 | 2.61 | 1238.12 | 0.720.21 | 1237.81 | 0.840.21 | -0.120.30 |
| 1332.50 | 60Co | * | 99.99 | 2.53 | 1332.62 | 4.880.32 | 1332.16 | 4.520.45 | 0.360.55 |
| 1377.67 | 214Bi | 238U | 4.00 | 2.49 | 1377.53 | 0.440.14 | 1377.59 | 0.390.06 | 0.050.15 |
| 1407.98 | 214Bi | 238U | 2.15 | 2.46 | 1408.22 | 0.450.24 | 1408.25 | 0.480.30 | -0.030.39 |
| 1460.83 | 40K | * | 11.0 | 2.42 | 1460.92 | 18.140.60 | 1460.94 | 18.550.84 | -0.41.0 |
| 1509.23 | 214Bi | 238U | 2.11 | 2.38 | 1509.02 | 0.240.14 | 1508.86 | 0.240.06 | 0.000.15 |
| 1588.19 | 228Ac | 232Th | 3.22 | 2.31 | 1588.02 | 0.240.11 | - | 0.36 (90 CL) | - |
| 1729.60 | 214Bi | 238U | 2.92 | 2.19 | 1729.79 | 0.330.10 | 1729.84 | 0.480.12 | -0.150.16 |
| 1764.49 | 214Bi | 238U | 15.4 | 2.17 | 1764.49 | 1.580.20 | 1764.00 | 1.780.24 | -0.210.31 |
| 1770.24 | 207Bi | * | 6.87 | 2.17 | 1769.81 | 0.170.04 | 1770.00 | 0.220.07 | -0.050.08 |
| 1808.65 | 26Al | * | 99.8 | 2.14 | 1808.14 | 0.380.09 | 1808.44 | 0.300.09 | 0.080.13 |
| 1847.42 | 214Bi | 238U | 2.11 | 2.11 | 1847.53 | 0.140.07 | 1847.10 | 0.210.09 | -0.070.11 |
| 2204.21 | 214Bi | 238U | 5.08 | 1.89 | 2203.29 | 0.300.05 | 2203.37 | 0.330.09 | -0.030.10 |
| 2447.86 | 214Bi | 238U | 1.57 | 1.75 | 2447.86 | 0.190.09 | - | 0.27 (90 CL) | - |
| 2614.54 | 208Tl | 232Th | 99.0 | 1.66 | 2614.16 | 0.900.14 | 2615.08 | 0.640.17 | 0.260.22 |