Centrality and pseudorapidity dependence of elliptic flow for charged hadrons in Au+Au collisions at GeV
Abstract
This paper describes the measurement of elliptic flow for charged particles in Au+Au collisions at GeV using the PHOBOS detector at the Relativistic Heavy Ion Collider (RHIC). The measured azimuthal anisotropy is presented over a wide range of pseudorapidity for three broad collision centrality classes for the first time at this energy. Two distinct methods of extracting the flow signal were used in order to reduce systematic uncertainties. The elliptic flow falls sharply with increasing at 200 GeV for all the centralities studied, as observed for minimum-bias collisions at GeV.
pacs:
25.75.-qIt is widely accepted that a very dense and possibly new state of matter is being created in central Au+Au collisions dAhighpt at the Relativistic Heavy-Ion Collider (RHIC) at Brookhaven National Laboratory. The azimuthal anisotropy in the distribution of produced particles (“flow”) is a consequence of the initial spatial asymmetry of the collision zone and subsequent rescattering processes which convert this to a final momentum anisotropy. Measurements of flow are therefore sensitive to the system early in the collision and to its dynamical evolution.
There is an extensive data set on flow results from RHIC Star_v2_vsnpart_vspt_130 ; Star_v2_Pid_130 ; Star_v2_KLambda_130 ; Star_v2_Cummulant_130 ; Star_v2_AzimuthalCorr_130 ; Star_v2_pid_200 ; Star_v1_200 ; Phenix_v2_twopartcor_130 ; Phenix_v2_pid_200 ; phobos130flow ; phobosflowlimitfrag , but as of yet, the least understood result is the pseudorapidity and energy dependence of the elliptic flow, , measured over an extended -range phobos130flow ; phobosflowlimitfrag . Recently some theoretical progress has been made by introducing a longitudinal dependence in the source shape and/or by assuming incomplete thermalization away from recent_theory_Heinz ; recent_theory_Csanad . In this paper, we extend our earlier measurements by examining the dependence of the shape on the collision centrality. The elliptic flow of charged hadrons has been studied using data from the PHOBOS detector during the 2001 Au+Au run of RHIC. In addition to the “hit-based” method previously used in phobos130flow , a new “track-based” method was developed and employed to improve the accuracy of the measurement and provide a valuable consistency check of the hit-based analysis.
The PHOBOS detector consists of silicon pad detectors arranged in single and multiple-layer configurations surrounding the interaction region, as described in phobosdetector . The two multiple-layer magnetic spectrometer tracking arms are configured with a field free region near the interaction vertex followed by tracking inside the magnet. This leads to two classes of found tracks with different acceptances. “Straight-line” tracks cover with an azimuthal acceptance of centered at and . “Curved” tracks cover with a variable azimuthal acceptance of . Details of the tracking procedure are given elsewhere phobos200highpt . The single layer configuration includes the octagonal multiplicity detector (OCT) with and six annular silicon ring multiplicity detectors (RINGS), with . The rings and most of the octagon have full azimuthal coverage except near the middle of the detector (mid-rapidity for nominal vertices) where the azimuthal coverage drops by a factor of two.
Two sets of scintillating paddle counters were used for triggering and centrality determination phobosprl ; phobosPhysRevC ; whitepaper . In addition an online vertex trigger was employed, using two sets of Čerenkov detectors. The hit-based method required events whose collision vertex () was centered at cm away from the nominal vertex position, along the beam axis phobos130flow . The vertex trigger enabled a special sample ( million triggers) of such events to be taken. The track-based method required events with vertices within about 10 cm of the nominal vertex position, which allowed a large fraction of the 2001 Au+Au data set at 200 GeV ( million triggers) to be used. The minimum-bias sample for the hit-based method consists of all triggered events that have a valid reconstructed vertex. This engenders biases similar to those discussed in phobos130flow and leads to the average number of participants given in Table 1. For the track-based method, only the fraction of the cross-section unbiased by trigger and vertex inefficiencies is used to form the minimum-biased sample. The average number of participants for this method is also given in Table 1. For the centrality dependent analysis, the data samples were subdivided into the three centrality classes given in Table 1. The top of the cross-section, where the flow signal is smallest, was omitted to reduce the resulting statistical and systematic errors on the most central bin. Differences in the average number of participants between the two methods, for the same fraction of the Au+Au cross-section, occur because the track-based method is track weighted whereas the hit-based method is event weighted. This results in slightly higher values for the track-based method, which are insignificant given the systematic error in . For both methods the resulting centrality classes are unbiased. The summary of the number of events used is also given in Table 1.
| Centrality | Hit-based | Track-based | ||||
|---|---|---|---|---|---|---|
| Number Events | Number Events | |||||
| minimum-bias | – | 34,727 | 5,050,778 | |||
| central | 11,221 | 1,439,923 | ||||
| mid-central | 7,550 | 1,230,394 | ||||
| peripheral | 10,127 | 3,087,599 | ||||
Monte Carlo (MC) simulations of the detector performance based on the Hijing hijing event generator and GEANT 3.21GEANT simulation package were used for systematic error studies.
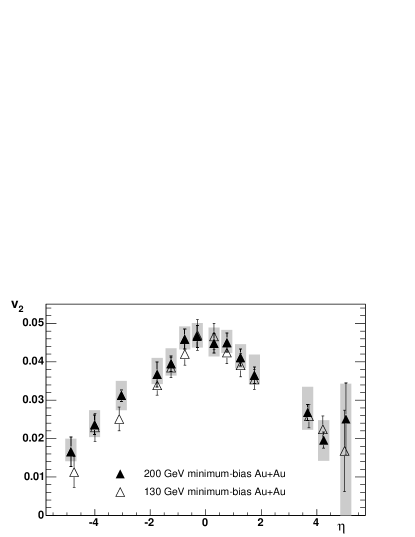
Figure 1 shows the minimum-bias result for the 200-GeV data using the hit-based method (as described in phobos130flow ). The data show a steady decrease in with increasing , similar to that seen at the lower energy of GeV (also shown). No significant difference in shape or magnitude is seen within the systematic errors. The ratio of at GeV compared to 130 GeV, averaged over all , is .
The track-based method correlates the azimuthal angle of tracks that traverse the spectrometer, , with the event plane as measured in the octagon, , event by event. The method used is based upon the scheme described by Poskanzer and Voloshin PoskVolo , where the strength of the flow is given by the Fourier coefficient of the particle azimuthal angle distribution
| (1) |
In this analysis only the component is studied and the true reaction plane, , is approximated by the event plane .
The use of tracking requires events with vertices near the nominal vertex range () to ensure maximum track acceptance in the spectrometer. Only the parts of the OCT detector with complete azimuthal acceptance (i.e. those away from mid-rapidity) are used to determine the reaction plane. Two sub-events, symmetric in and of equal charged particle multiplicity, are used to determine the event plane resolution. The sub-event sizes are vertex dependent, resulting in a resolution correction that is both centrality and vertex dependent. The resulting sub-event ranges lie between , and are widely separated, thus greatly reducing the effects of any short range non-flow correlations. The event plane is determined using
| (2) |
where is the hit’s measured angle, and the sums run over all hits in both sub-events. The sub-events are combined for the event plane determination in order to maximize its resolution. Vertex dependent corrections, some determined on an event-by-event basis, are used as weights () phobos130flow in order to remove acceptance and occupancy biases. The resulting distributions of event plane angles are found to be flat within .
To determine the coefficient, the measured distribution is divided by a mixed event distribution in order to remove detector related effects, such as non-uniformities in the azimuthal acceptance of the spectrometer:
| (3) |
where denotes and is the event plane resolution correction. The distribution, with zero flow, is constructed using an event mixing technique, where the of tracks in one event are subtracted from the of another event.
Normalized distributions, , and , are determined as a function of vertex position and for fine centrality bins ( of the cross-section per bin) since the event mixing technique requires similarity of the class of events examined. The centrality bin and vertex dependent event plane resolution correction are determined using the sub-event technique PoskVolo as
| (4) |
where and are the event planes from each sub-event. The factor converts the single sub-event resolution correction into a combined sub-event resolution correction. The factor is sometimes approximated as unity, but this approximation can break down, particularly when the event resolution is good. Its exact form is given in Refs. PoskVolo and cmv . For the resolutions measured in this data set, .
After averaging Eq. 3 over vertex positions and centralities falling into each broad centrality class defined in Table 1, the coefficient is extracted from the fit to an even-harmonic series. (Including orders higher than in the fit did not effect the extracted .) It should be noted that the resulting is a track weighted result over the broad centrality classes, since limited statistics precluded the from being determined for each fine centrality bin and then event weighted. For further details on this technique see cmv .
Extensive MC simulations have shown that the magnitude and shape of the flow signal are correctly reproduced by this method. No further corrections to the measured coefficient are necessary, such as potential corrections due to the density of particles or suppression corrections due to backgrounds, as required in the hit-based method.
In addition to the sources of systematic errors considered for the hit-based analysis phobos130flow , other studies performed for the track-based method include analysis of the effects related to tracking, such as varying cuts on the distance of closest approach of tracks to the collision vertex, differences between results obtained from the two spectrometer arms, momentum resolution, and dependence on the bending direction. Additionally, contributions due to the vertex dependency of the resolution corrections, different beam orbit conditions, and errors of the fit parameters were also accounted for.
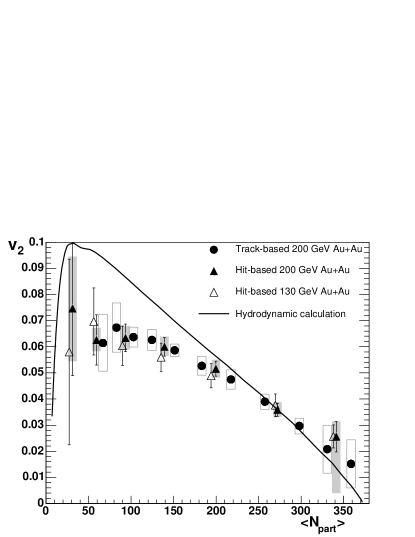
Figure 2 shows the centrality dependence of the determined using the straight line track-based method over a range of , allowing a direct comparison with the same result using the hit-based technique. The two techniques agree well over the full range of centrality. The curve in Figure 2 shows a hydrodynamic calculation for Au+Au collisions at GeV HydroLineModel . As seen for Au+Au collisions at 130 GeV Star_v2_vsnpart_vspt_130 (open triangles), the 200-GeV results at mid-rapidity are consistent with expectations from hydrodynamic models. There is no significant difference between the 130- and 200-GeV data in either the shape or magnitude of at mid-rapidity as a function of centrality within the errors.
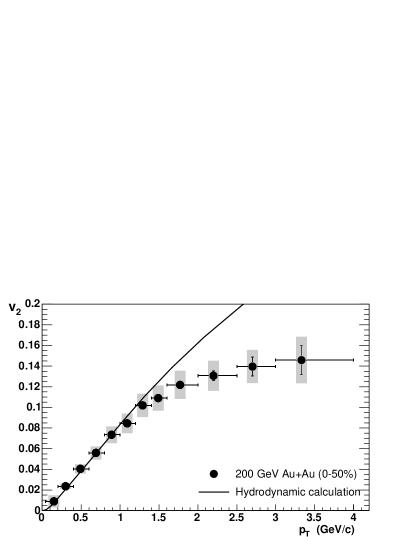
Using tracks that traverse the full field region of the spectrometer, the transverse momentum dependence of the flow strength can be measured. This is shown in Figure 3 for the top centrality for tracks averaged over the range . The curve shows the prediction of a hydrodynamical model HydroLineModel . As previously observed Star_v2_vsnpart_vspt_130 , the rises as increases and at above GeV/c tends to flatten out well below the hydrodynamic curve.
In these analyses, the reaction plane is determined in sub-events that are at different pseudorapidities from those where the is measured. This should significantly reduce the contribution of any non-flow effects to the measured , particularly those due to short-range correlations. Comparisons of the result to the reaction plane and cumulant methods results from reference Star_v2_Cummulant_130 , averaged over a similar centrality range, show that our result is most consistent with the one obtained with the four particle cumulant method QM2004Flow , suggesting that our track-based methodology is indeed largely immune to non-flow effects over the range .
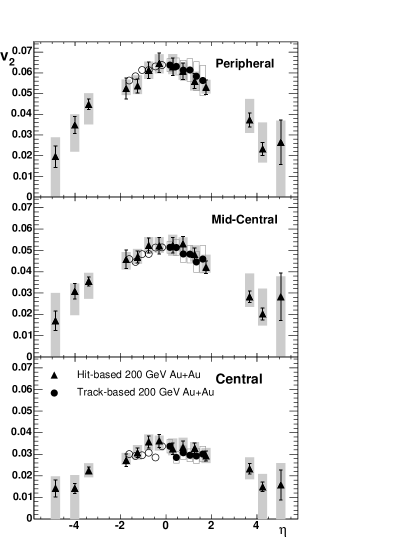
Figure 4 shows for three centrality classes as defined in Table 1. Excellent agreement is seen across all of the centrality classes over the range of overlap suggesting that our hit-based method is also minimally affected by non-flow effects around mid-rapidity.
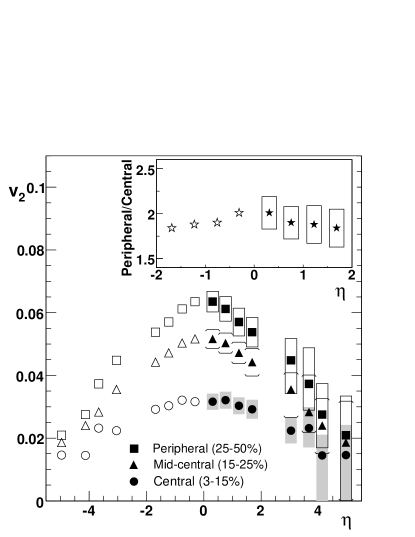
To examine how the shape of the distribution changes with centrality, the results of the hit-based method and track-based methods are combined. Although obtained in the same experiment, the measurements should effectively be considered independent of each other due to the very different methods and elements of the PHOBOS detector used; hence the results for each method are combined with the reasonable assumption that the errors are uncorrelated. First, the hit-based results that are approximately an equal distance away from mid-rapidity are combined (e.g. with , weighted by their statistical uncertainties. The points at and are just reflected due to the lack of symmetry of these points around . The track-based results at and are also combined to give at , and similarly for and , to give a at . The hit-based results and the track-based results with similar binning are averaged, weighted by their combined statistical and systematic uncertainties. The resulting data are shown in Figure 5. The pseudorapidity dependence of for the 3 centrality bins is similar to that observed in Fig.1 for minimum-bias data. For peripheral collisions, clearly already has a non-zero slope over the range . The overall shape of is not strongly centrality dependent within the uncertainties, appearing to differ only by a scale factor. This is illustrated in the insert of Fig. 5, which shows that the ratio of the peripheral to central data around mid-rapidity is approximately constant. However, it should be noted that the central data around mid-rapidity is also consistent with a flat distribution, given the uncertainties.
In summary, we have measured the centrality dependence of in Au+Au collisions at GeV. Excellent agreement with the track-based method further validates the use of the hit-based method. This method allowed for the study of the dependence over the large range of covered by the PHOBOS single-layer silicon detectors. The 200-GeV results clearly show that decreases with increasing , as seen for the 130-GeV Au+Au collisions. From comparisons of the results with four particle cumulant results we conclude that our flow measurements are largely immune to non-flow effects, over the range .
The predominant features of the distribution do not change significantly as a function of centrality from to . The flow still falls off as one moves away from mid-rapidity. It is hoped that this data can be used to more fully understand the strong dependence of the flow component.
This work was partially supported by U.S. DOE grants DE-AC02-98CH10886, DE-FG02-93ER40802, DE-FC02-94ER40818, DE-FG02-94ER40865, DE-FG02-99ER41099, and W-31-109-ENG-38, US NSF grants 9603486, 9722606 and 0072204, Polish KBN grant 1-P03B-06227, and NSC of Taiwan contract NSC 89-2112-M-008-024.
References
- (1) B. B. Back et al., Phys. Rev. Lett. 91, 072302 (2003); J. Adams et al., Phys. Rev. Lett. 91, 072304 (2003); S. S. Adler et al., Phys. Rev. Lett. 91, 072303 (2003); I. Arsene et al., Phys. Rev. Lett. 91, 072305 (2003).
- (2) K. H. Ackermann et al., Phys. Rev. Lett. 86, 402 (2001).
- (3) C. Adler et al., Phys. Rev. Lett. 87, 182301 (2001).
- (4) C. Adler et al., Phys. Rev. Lett. 89, 132301 (2002).
- (5) C. Adler et al., Phys. Rev. C 66, 034904 (2002).
- (6) C. Adler et al., Phys. Rev. Lett. 90, 032301 (2003).
- (7) C. Adler et al., Phys. Rev. Lett. 92, 052302 (2004).
- (8) C. Adler et al., Phys. Rev. Lett. 92 , 062301 (2004).
- (9) K. Adcox et al., Phys. Rev. Lett. 89, 212301 (2002).
- (10) S. S. Adler et al., Phys. Rev. Lett. 91,182301 (2003).
- (11) B. B. Back et al., Phys. Rev. Lett. 89, 222301 (2002).
- (12) B. B. Back et al., Phys. Rev. Lett. 94, 122303 (2005).
- (13) U. Heinz and P. Kolb, J. Phys. G: Nucl. Part. Phys. 30, S1229 (2004).
- (14) M. Csanad, T. Csorgo, B. Lorstad, Nucl. Phys. A742, 80 (2004).
- (15) B. B. Back et al., Nucl. Inst. Meth. A499, 603 (2003).
- (16) B. B. Back et al., Phys. Lett. B578, 297 (2004).
- (17) B. B. Back et al., Phys. Rev. Lett. 85, 3100 (2000).
- (18) B. B. Back et al., Phys. Rev. C 65, 061901 (2002).
- (19) B. B. Back et al., Nucl. Phys. A757, 28 (2005).
- (20) X. N. Wang and M. Gyulassy, Comput. Phys. Commun. 83, 307 (1994). HIJING v1.35 used.
- (21) GEANT 3.21, CERN Program Library.
- (22) A. M. Poskanzer and S. A. Voloshin, Phys. Rev. C 58, 1671 (1998).
- (23) C. M. Vale, Ph. D. thesis, Massachusetts Institute of Technology (2004).
- (24) P. F. Kolb, P. Huovinen, U. W. Heinz and H. Heiselberg Phys. Lett. B500, 232 (2001); P. Huovinen., Private Communication.
- (25) M. Belt Tonjes et al., J. Phys. G: Nucl. Part. Phys. 30, S1253 (2004).