The CLAS Electromagnetic Calorimeter at Large Angles
Abstract
The study of the response of the two modules of the large-angle electromagnetic shower calorimeter (LAC) of the CLAS detector to charged and neutral particles is reported. The results agree very well with the Monte Carlo simulation. The procedures adopted for the energy and timing calibration are also discussed, proving that the module geometry allows for simple self-calibrating energy and timing algorithms.
keywords:
CLAS , calorimeter , calibration , scintillatorPACS:
29.40.Vj, , , , , , , , , , , , , , , , ,
1 Introduction
The accelerator CEBAF at Jefferson Lab provides up to electrons to three experimental halls. Hall B houses the Large Acceptance Spectrometer CLAS, which is designed to study multi-particle final-state reactions induced by photons and electrons at luminosities up to . The charged particle momentum is analyzed using a 1 T toroidal magnetic field with azimuthal symmetry generated by six superconducting coils arranged around the beamline. Each sector between two coils acts as a single spectrometer instrumented with three layers of drift chambers (DC) for track reconstruction, one layer of scintillator counters for time-of-flight measurement (TOF), a gas filled Cherenkov counter (CC) and an electromagnetic shower calorimeter (EC). Drift chambers and time-of-flight define the sensitive region of each sector in the range of the polar angle from to , the forward calorimeter modules cover from to in each sector and the two modules of the large-angle calorimeter (LAC) extend the coverage up to in two CLAS sectors. In 1998 the two LAC modules as a part of the CLAS detector have been commissioned and since then they have been successfully operating to run the Hall B experimental program with electron and photon beams. The main features of the LAC module have been already described in previous papers where we reported the properties of the main components as the plastic scintillators [2, 4], the light guides [3] and the photomultipliers [5]. The detector structure and the response to minimum ionizing particle has been described in Ref. [6]. In this paper we report on the response of the LAC to charged and neutral particles. The results are based on data taken with both an electron and a photon beam impinging on a cryogenic target filled with liquid Hydrogen or liquid Deuterium. We first discuss the energy and timing response obtained from the detection of pions and protons. After that we show the performances for neutral particles: photons and neutrons.
2 The LAC Energy Response
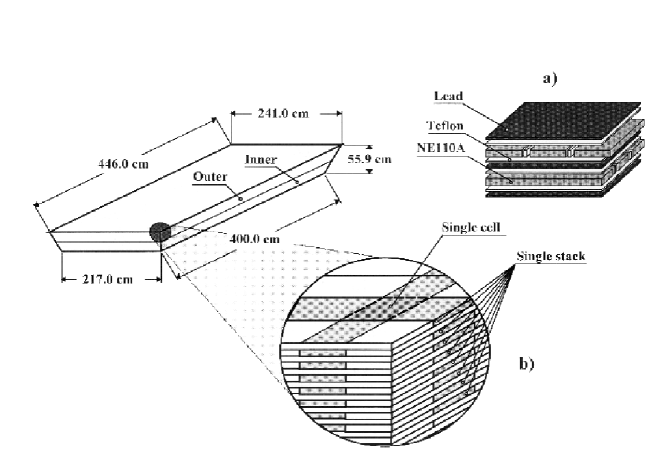
To discuss the energy and timing responses, we first give a brief description of the detector. The conceptual drawing of the internal structure is shown in Fig. 1: the LAC module has a rectangular shape with a sensitive area of 217x400 and the internal structure is made of 33 layers, each composed of a 0.20 thick lead foil and 1.5 thick NE110A plastic scintillator bars. Each scintillator layer is protected from the contact with the lead by thin Teflon foils. The width of the scintillators is roughly 10 and is slightly increasing from the inner layers toward the outer layers to provide a focusing geometry. Scintillators in consecutive layers are rotated by to form a 40x24 matrix of cells with area approximately 10x10 . The module is vertically divided into an inner (17 layers) and an outer (16 layers) parts with separate light readouts. Scintillators lying one on top of the other with the same orientation form a stack. The focusing geometry is such that any straight trajectory that originates from the target would hit two crossing stacks both in the inner part as well in the outer part. For each stack the light is collected at both ends separately using light guides coupled to EMI 9954A photomultipliers. For each module there are 128 stacks and 256 photomultipliers.
2.1 The Energy Calibration
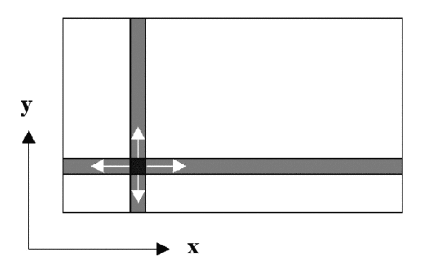
The energy calibration is performed continuosly checking off-line each photomultiplier. The ADC pedestals are measured every day and the gain inhomogenities are corrected off-line setting the peak of the minimum ionizing particle (MIPs) distribution to the same value for all photomultipliers according to the following procedure already used during the tests with cosmic rays [6]. Minimum ionizing particles have enough kinetic energy to penetrate in the detector and exit from the back side. The events corresponding to those particles (mainly high-momentum pions) that release their energy in a single cell are selected, in the off-line analysis, by imposing the presence of four ADC signals in the inner part and the four corresponding ADC signals in the outer part as shown in Fig. 2. As a preliminary step, the correction for the dependence from the cell position is applied considering that the light attenuation in scintillators relates the read-out charge to the “true” value according to the expression:
| (1) |
where is given by the coordinates of the center of the cell, is the stack length and the two parameters and (representing, respectively, the light attenuation length and the reflectivity of the end surface of the scintillator bars) are the constants that have been determined for each stack by the cosmic ray calibration described in Ref.[6] and stored in a database. After the position correction, the conversion factor charge-to-energy is evaluated, for each photomultiplier, in order to get the same MIPs peak position and to minimize the width of the overall deposited energy distribution.
After the energy calibration and the equalization of the read-out of the 512 photomultipliers, the calorimeter energy response has been studied for different detected particles and the results are discussed in the following sections.


2.2 The Response to the Ionizing Particles
Protons are a powerful tool to check the linear response of individual stacks in a wide energy interval. The protons detected by CLAS and used in this analysis originated from multipion emission off a liquid hydrogen target in electron scattering. They have been selected by .vs.momentum discrimination using informations from TOF and DC. Fig. 3 shows a typical distribution of the deposited energy in the LAC as a function of the proton momentum. Protons with momentum less than 0.6 release all their kinetic energy in the TOF placed in front of the LAC scintillators as well as in the LAC front-housing and are not detected in LAC. Protons with momentum up to 1 are completely stopped by the calorimeter while higher-momentum protons release a fraction of their kinetic energy that approaches at very high momenta the asymptotic value of 106 . This value corresponds to the energy released by MIPs in the LAC.
The momentum dependence of the deposited energy and the width of the deposited energy distribution agree with the Monte Carlo simulations. In Fig. 4 the momentum dependence of the width of the deposited energy distribution of the protons stopped in the calorimeter is reported. The dependence of from the deposited energy has been fitted with the expression
| (2) |
with in . The parameter resulted very small while the value is larger than expected assuming the contribution only from the fluctuations in the light transmission and collection. Actually different effects contribute to the widening the deposited energy distribution; they include non uniformity in the effective scintillators and lead thicknesses due to different proton incident angle as well as non-uniformity in scintillator intercalibration. The contribution of each single effect cannot be easily disentangled, therefore we compared the overall response of the LAC modules with a realistic Monte Carlo simulation where we assumed 5 collected in average by each photomultiplier as already measured in cosmic ray tests [6], and a photomultiplier intercalibration non-uniformity equal to 5 . The continuous line in Fig. 4 represents the result of the simulation and the agreement is fairly good.
2.3 The Response to the Electromagnetic Showers
To study the response to electromagnetic showers, the only possibility is the detection of the photons from the decay, because the flux of electrons scattered at large angles is too low and the contamination too high. The photons are identified selecting those events where the LAC energy signal has no TOF and DC signals in coincidence. The size of the electromagnetic shower is normally larger than the stack width and several stacks are involved in the detection. To reconstruct the photon energy first the two coordinates of the center of the shower are determined by weighting the coordinates of contiguous non-zero ADCs with their read-out, then for each ADC the read-out is corrected according to Eq. 1. Finally the photon energy is obtained multiplying the sum of the corrected ADC read-outs by the sampling factor . This factor has been determind from Monte Carlo simulations.
Unfortunately the photon energy spectra shows a continuous yield and cannot provide a direct test of the energy calibration. Nevertheless photon energy resolution could strongly affect the reconstructed mass of and its investigation can provide an indirect check of this procedure as discussed in Sec. 4.
3 The LAC Time Response
The time response of the detector can affects the detection and identification of neutral particles. Photons originated from mesons decay can be disentangled from neutrons only using their different time-of-flight. To provide discrimination good timing uniformity and resolution are required. The detector geometry allows a self-calibrating procedure. For each photomultiplier the relation between the particle time-of-flight and the corresponding TDC read-out already corrected for the time-walk according to Ref. [6] can be simply written as
| (3) |
being the length of the trajectory from the target to the detector, the particle velocity, the distance between the impact point in the detector and the photomultiplier, the propagation velocity of the light in the scintillator, the intrinsic time delay of each electronic chain and the overall calibration constant equal for all photomultipliers. To provide the correct relationship between and , the 512 different constants and need to be set properly.
We first proceeded to the equalisation of the time response by setting the values using signal from MIPs. Only events hitting a single cell were selected imposing the presence of four ADC signals in the inner part and of the four corresponding ADC signals in the outer part of the module. The ADC signals were originated from pairs of photomultipliers coupled respectively to the right and to the left hand side of the same scintillator stack. By using the corresponding TDC readouts and together with Eq. 3 we evaluated for each stack the half-sum
being the scintillator lenght, and the half-difference
With the adopted selection each event is represented by eight numbers: the values and for the inner-short stacks, and for the inner-long stacks and similar values for the outer stacks. is simply the particle time-of-flight and consequently, for each single event, the four have to assume the same value, or equivalently, to satisfy the equation
| (6) |
for any pair of the variables.
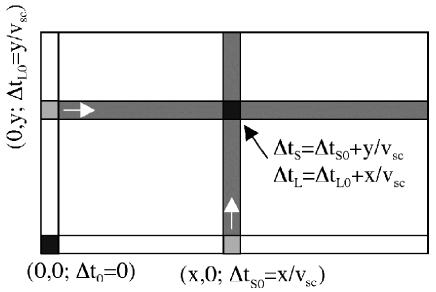
A similar relationship can be obtained for the four values as described in Fig. 5: for each stack the value has been set such that for events in the first cell the correspondig timing would be
| (7) |
being the stack distance from the bottom-left angle of the module or equivalently the stack coordinate. In this way it is easy to verify that the events detected in any cell with coordinates are associated to the same value for both short and long read-out:
| (8) |
With this condition, for each event the four have to assume the same value, or equivalently
| (9) |
for any pair of the variables.

Therefore it can be easily proved that equalizing the timing response of the LAC is equivalent to finding the values of the 512 that simultaneously set to zero the average value of the distributions and separately for the inner and the outer part of the detector, minimizing at the same time their widths. In Fig. 6 a typical result is reported.


To fix we used the time-of-fligth of the photons originated from decay. We selected photons candidates in the reaction with missing mass equal to and a neutral particle detected in coincidence by the LAC modules, then we evaluated from the time-of-flight the corresponding values being the length of the straight trajectory from the target center to the reconstructed impact point in the LAC. We set the value imposing the mean values of the distribution equal to 1. In Fig. 7 the distribution of for detected photons shows a gaussian shape with . Considering that the average distance from the target is 4 this value corresponds to a timing resolution well in agreement with that obtained in the preliminary tests with cosmic rays [6]. The timing response is very good in the whole range as shown in Fig. 8 where the reconstructed with LAC is compared to the from the TOF for protons () and (). The data were taken using a 4.0 electron beam incident on a liquid H2 target.
4 The Reconstruction of the Decay
The reconstructed value of the mass provides a quantitative check of the LAC energy equalisation and calibration. Any energy miscalibration would in fact provide an incorrect mean value and a larger width for the reconstructed mass distribution. To verify that the energy calibration procedure discussed in Sec. 2 is correct, we selected the events from the reaction with one photon detected in the LAC modules and one in the EC modules. The neutral hits in the calorimeters were identified by the absence of a matched track in drift chambers. Photons detected by the LAC generally belongs to low momentum pions that decay emitting the two photons with a large relative angle ; therefore candidate events corresponding to the decay were required to have a neutral hit in the LAC and a second neutral hit in the other LAC module or more favourably, in any EC module.

The meson mass has been reconstructed from the photon energies , and the angle between the direction of the two photons according to
| (10) |
The reconstructed , as shown in Fig. 9, peaks at the right energy and the width of the distribution is well in agreement with the Monte Carlo simulations. The data were taken using a 4.0 electron beam incident on a liquid H2 target.
5 The Neutron Detection
The LAC detector has been designed to provide high neutron detection efficiency. From Monte Carlo simulations a detection efficiency larger than for neutron momenta higher than 0.7 is expected. Neutrons as well as photons are identified by a neutral hit in the LAC and the particle velocity is reconstructed from the time-of-flight. Neutrons are separated from photons setting .

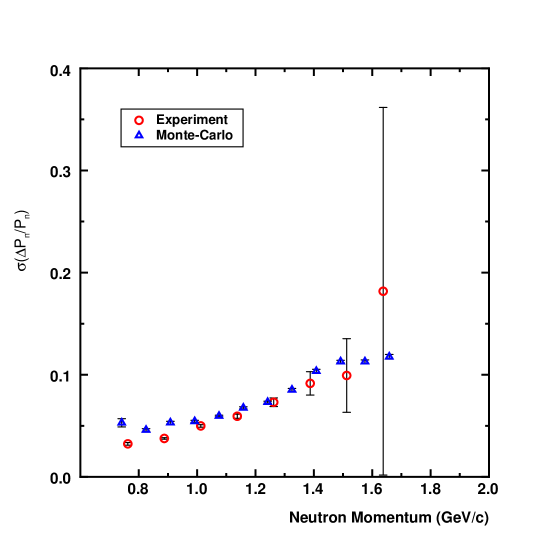
To study the LAC response, the neutrons candidates were selected through the deuteron photo-disintegration imposing a cut in the missing mass distribution below the pion production threshold and the direction of the missing momentum oriented within the solid angle defined by the two LAC modules. The data were taken using the 4.0 tagged photon beam incident on a liquid deuterium target. At this energy the neutrons detected in the LAC modules come mainly from the exclusive reaction . Typical neutron momenta vary between 0.7 and 1.5 . The comparison between the momentum reconstructed by the LAC time-of-flight and the missing momentum for neutron candidates is reported in Fig. 10. The distribution of the relative difference is correctly centered on zero. The width of this distribution has been studied as a function of and compared to the Monte Carlo expectations. The results are reported in Fig. 11 where the empty dots represent the experimental data and the full dots the simulation results: the agreement is fairly good in the whole investigated momentum range.
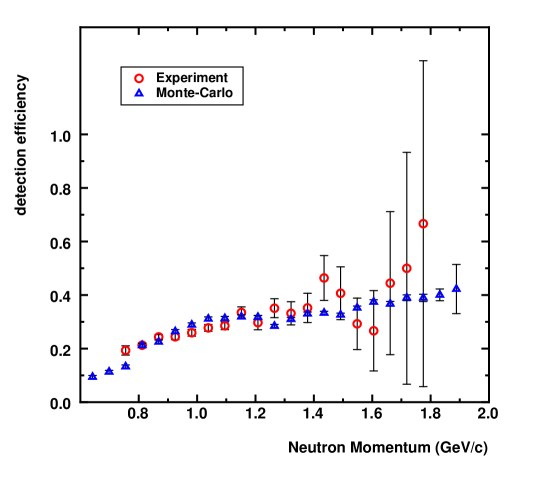
To evaluate the LAC efficiency we simply counted the fraction of candidates that generated a neutral hit in the LAC modules. In Fig. 12 we report the results (crosses) together with the Monte Carlo results (full dots) as a function of : as for the momentum resolution, there is complete agreement in the whole investigated momentum range.
6 Conclusions
The two modules of the large angle calorimeter of the CLAS detector have been commissioned in 1998 and since then successfully operated. In this paper we have first discussed the calibration procedures proving that the detector geometry allows for simple energy and timing calibrating algorithms. These procedures are based on the detection of minimum ionizing particles (pions) that provide the relative energy and timing intercalibration. The absolute energy calibration for electromagnetic shower detection is obtained applying a correction factor as obtained from Monte Carlo simulations, and has been checked with the reconstructed mass detecting one photon in the LAC module and one photon in the forward calorimeter. The dependence of the resolution from the deposited energy has been studied with protons completely stopped in the calorimeter. The timing absolute calibration is obtained setting for the photons that originate from the decay. The overall timing resolution for photons has been measured equal to . Finally the response to neutron has been studied as a function of the neutron momentum. The obtained momentum resolution and the detection efficiency fairly agrees with the Monte Carlo simulations. In particular the neutron detection efficiency is larger that for neutron momenta higher than 0.7 .
Therefore we can conclude that the two LAC modules show the expected performances.
7 Aknowledgements
This work was supported by the Istituto Nazionale di Fisica Nucleare. The Southeastern Universities Research Association (SURA) operates the Thomas Jefferson National Accelerator Facility for the United States Department of Energy under contract DE-AC05-84ER40150. We would like to thank E. Smith of the TJNAF for the fruitful discussions during the paper preparation.
References
- [1] M. Taiuti et al., INFN Internal Report INFN/BE-95/03 (1995)
- [2] M. Taiuti et al., Nucl. Instr. and Meth. A 357, (1995) 344
- [3] M. Taiuti et al., Nucl. Instr. and Meth. A 370, (1996) 429
- [4] P. Rossi et al., Nucl. Instr. and Meth. A 381, (1996) 32
- [5] M. Ripani et al., Nucl. Instr. and Meth. A 406, (1998) 403
- [6] M. Anghinolfi et al., Nucl. Instr. and Meth. A 447, (2000) 424