Crystal Ball Collaboration
Differential cross section of the charge-exchange reaction in the momentum range from 148 to 323 MeV/
Abstract
Measured values of the differential cross section for pion-nucleon charge exchange, , are presented at momenta of 148, 174, 188, 212, 238, 271, 298, and 323 MeV/, a region dominated by the (1232) resonance. Complete angular distributions were obtained using the Crystal Ball detector at the Alternating Gradient Synchrotron (AGS) at Brookhaven National Laboratory (BNL). Statistical uncertainties of the differential cross sections are typically 2-6%, exceptions being the results at the lowest momentum and at the most forward measurements at the five lowest momenta. We estimate the systematic uncertainties to be 3-6%.
pacs:
I Introduction
Several authors Bagheri et al. (1988); Fitzgerald et al. (1986); Hauser et al. (1971); Comiso et al. (1975); Jenefsky et al. (1977); Bayer et al. (1976); Berardo et al. (1972); Borcherding (1982) have measured differential cross sections in this momentum range. The previous data were taken using either neutron counters or -ray spectrometers with small solid angle acceptance. We are adding 160 new data points for the differential cross section taken with the Crystal Ball multi-photon spectrometer, which almost doubles the database in this momentum interval. The Crystal Ball provides complete angular coverage at these momenta by measuring the energy and impact location of the rays from decay. The detector efficiencies inherent in neutron detection are eliminated and the acceptance corrections associated with small detectors are reduced.
Precise data for pion-nucleon charge exchange (CEX) are of interest principally to obtain an accurate description of the N system via a consistent and complete set of scattering amplitudes. A partial-wave analysis (PWA) is typically used, but potential models and Lagrangians based on chiral perturbation theory are often used at low energy. These approaches are based on all reliable scattering data in the three channels that are experimentally accessible, and elastic scattering and CEX. These reactions are described by amplitudes , and , respectively. Assuming isospin invariance, these amplitudes are related by
Isospin symmetry is broken by electromagnetic effects and the up-down quark mass difference. Mass differences between the neutron and proton and the charged and neutral pions are manifestations of these effects. Gibbs, Ai and KaufmanGibbs et al. (1995) incorporated these mass differences and Coulomb corrections in a coupled-channel potential model. They included data up to Tπ = 50 MeV (Pπ = 128 MeV/), just below the range of data reported here. A surprising 7% breaking of isospin invariance was obtained at 40 MeV (113 MeV/). Similar isospin breaking was reported by MatsinosMatsinos (1997) using data up to Tπ = 100 MeV (Pπ = 197 MeV/) that overlaps with the data reported here. Fettes and MeissnerFettes and Meissner (2001a, b) investigated isospin breaking in the framework of chiral perturbation theory up to 100 MeV/ and obtained only a 0.7% effect in the s-waves, where Ref. Gibbs et al. (1995); Matsinos (1997) observed the largest effect. In all three analyses the data for CEX were the most limited in quantity.
The - mass and width differences are of interest to test calculations for isospin-breaking effects in hadrons, particularly the up-down quark mass difference. The Particle Data Group Hagiwara et al. (2002) includes three determinations of these differences Pedroni et al. (1978); Bernicha et al. (1996); Abaev and Kruglov (1995). Results from Ref. Pedroni et al. (1978); Bernicha et al. (1996) are both based on the total cross-section measurements for from Pedroni, et al.Pedroni et al. (1978). The energy independent partial-wave analysis of Abaev and Kruglov Abaev and Kruglov (1995) determined the isospin- phase shifts from elastic scattering data and again from and . Both measurements are needed in the latter case since the reactions involve both isospin and . The uncertainties in this determination were dominated by the existing CEX data.
Another example of the impact of N measurements on baryon structure is the N sigma term, which is a measure of chiral symmetry breaking in the strong interaction. It is obtained by the extrapolation of the s-wave pion-nucleon scattering amplitudes to a negative energy point by taking advantage of their analytic properties. CEX data affect the determination of the sigma term indirectly, but are important to provide a stable database to determine the amplitudes as close to threshold as possible before extrapolating to the non-physical region. Recent discussions of the sigma term can be found in the N NewsletterSainio (2002); Pavan et al. (2002); Olsson and Kauffman (2002); Stahov (2002). Reference Matsinos (1997) questions the determinations of the low-energy hadronic constants, including the N sigma term, in a framework that does not include isospin breaking.
The N scattering amplitudes extracted by PWA’s provide us with the best available information on the NN coupling constant and the N scattering lengths. Existing CEX data are more sparse and generally less precise than for elastic scattering. The data reported here remedy this situation in the resonance region and below.
II Experimental Setup
The Crystal Ball (CB) detector (see Fig. 1) was built by SLAC Bloom and Peck (1983) in the 1970’s and was used in several experiments at SLAC and DESY. The CB was moved to the C6 beam line of the Alternating Gradient Synchrotron (AGS) at Brookhaven National Laboratory (BNL). The data presented in this work were taken in October, 1998.
The Crystal Ball detector consists of 672 optically isolated NaI(Tl) crystals, a subset of 720 crystals that would complete a sphere. The openings for beam entrance and exit reduce the geometric acceptance to 93% of steradians. The complete sphere is approximated by an icosahedron consisting of 20 equivalent equilateral major triangles, each of which is divided into four minor triangles of nine crystals. The individual crystal dimensions vary slightly depending on their location within a minor triangle. They are truncated triangular pyramids, nominally 5 cm on edge at the inner radius, 13 cm at the outer radius, and 41 cm long. Each crystal is viewed by a single photomultiplier tube. The inner radius of the sphere of crystals is 25 cm. More detail on the CB is given in Ref.Starostin et al. (2001).
The cavity in the center of the CB housed a liquid hydrogen (LH2) target. The target geometry was a 10-cm diameter cylinder with spherical endcaps. The target length was 10.6 cm along the central beam axis. The target vacuum was maintained inside a cylindrical aluminum beam pipe (OD = 15.2 cm) with a thickness of 2.1 mm.
ST was the primary beam-defining scintillator and was placed just upstream of the entrance to the beam pipe. The dimensions were 5.1 cm x 5.1 cm x 0.42 cm (thickness) for the measurements reported here. It was viewed by two photomultiplier tubes to provide better timing resolution since all other signals were timed with respect to it.
A veto barrel (VB) was installed to reject events that had charged particles in the final state. It was constructed of four curved plastic scintillators that formed a cylindrical shell around the beam pipe. Each segment was 5 mm thick and 120 cm long. Each end of the four segments was viewed by a photomultiplier tube. The VB logic was formed by the logical AND of the two ends for a given segment followed by the OR of the four segments.
The Neutral Event trigger for the experiment was formed by
where S1, S2 and ST were the beam defining scintillators (see Fig. 1). WV and BH are not shown in Fig. 1. WV (for wavelength-shifting scintillator) was the logical OR of four trapezoidal counters that covered the crystals at the entrance tunnel to the CB in order to veto muons from decay. BH was the logical OR of four beam halo veto counters that were located around ST. The purpose of the WV and BH counters was to prevent accepting triggers from beam particles that hit ST but were within the (accidental) coincidence time of another beam-associated particle that would deposit energy in the CB. VB was used to veto charged particles produced in the target, predominantly from elastic scattering. CB represents the discriminator output of the fast analog sum of the NaI crystals except the edge crystals surrounding the entrance and exit tunnels. The discriminator threshold for CB was variable, but corresponded to an energy of 75 MeV for the data presented here. A trigger in which the VB was put in coincidence was also used. The number of charged triggers accepted by the data acquisition was reduced by a factor of 10 using a prescaler. Two beam veto scintillators downstream of the target, BV and BVS, were not used in the neutral event trigger but the location of BVS is shown in Fig. 1 because it was used for TOF measurements of the beam composition (described below).

Pion beam trajectories were measured by the six drift chambers between S2 and ST (three for the horizontal coordinate and three for the vertical coordinate). The drift chamber before the last beam bending magnet determined the difference in momentum of the beam particle from the nominal value set by the beam tune. A narrow P/P tune was used in the experiment. The width of the momentum distribution was measured to be 1.4% (rms), or P/P = 3.4% (FWHM).
III Data analysis
III.1 Procedure
The reaction was identified by measuring the energy and direction of the two photons from decay (BR = 98.8%). Each photon produces an electromagnetic shower in the NaI that spreads over several crystals around a central one. The cluster algorithm finds the crystal with maximum deposited energy and identifies it as the central one. A cluster was defined to be the central crystal and its nearest neighbors. Clusters with a central crystal energy greater than 7 MeV and an energy sum over all crystals in the cluster of at least 17.5 MeV were standard in this analysis.
The direction of the photon is determined by calculating the trajectory from the target center to the weighted average of the crystal positions, where the weighting factor is the square root of the deposited energy. The remaining crystals are searched to find the one with maximum energy to form the next cluster using the same criteria. The process is repeated until all the clusters are found.
With the assumption that the clusters originated from photons at target center, the invariant mass of photon pairs was found and compared to the mass. Two-cluster events that had an invariant mass between 97 and 181 MeV/ were selected in the analysis. The recoil neutron can also give a cluster. Three-cluster events were included if two of the clusters reconstructed to the mass within the same interval and if the location of the third cluster was consistent with the direction of the neutron. In principle, this procedure eliminates the need to determine the detection efficiency for neutrons in the NaI since the events are included in the yield regardless of whether the neutron is detected. The efficiency depends strongly on the threshold and increases with the neutron energyStanislaus et al. (2001). The percentage of three-cluster events was 1.6% at 148 MeV/ and increases to 8.3% at 298 MeV/.
The missing mass for producing the two clusters was calculated using the beam momentum information provided by the drift chambers. The missing mass was required to be within 110 MeV of the neutron mass. If this test was passed, the c.m. scattering angle of the was calculated and the data were histogrammed into 20 bins of . Runs with an empty target were taken at each momentum and yields were subtracted from the data taken with the full target.
The analysis was done in two ways. The “full-geometry” analysis included clusters for which the central crystal was on the edge bordering the entrance or exit tunnels. The “near-edge-cut” analysis rejected these events. These analyses required different calculations of the acceptance, which is discussed in the next section.
The average pathlength of the pion beam in the LH2 target was calculated using the trajectories determined from the drift chambers. All yields were corrected for empty target normalized to the live-time corrected beam monitor (). Since the target was emptied by displacing the hydrogen liquid with gas, the density of hydrogen gas was subtracted from the density of liquid (0.0711 g/cm3 at 21 K and 16 psi). Upon emptying, the temperature of the gas increased gradually to 60 K so the gas density at 30 K was used, giving a correction of (1.1 0.5)%.
III.2 Monte Carlo Simulation and Acceptance Calculation
The acceptance of the Crystal Ball for detecting ’s from was calculated using a Monte Carlo program based on GEANT gea . All 672 crystals, the CB enclosure, the target assembly, the beam pipe, and all scintillation counters in the trigger were included in the simulation. This simulation was used for several purposes: 1) to calculate the acceptance for ’s in the Crystal Ball for the different bins in , 2) to evaluate the fraction of events that would trigger the veto system, particularly the veto barrel that surrounded the target, and 3) to gain insight and confidence in the performance of the CB, such as using it to calibrate the beam momentum as discussed in the next section.
A separate program (DECKIN) selected a random interaction point in the LH2 target along the measured beam trajectories that had been saved from the experimental data. DECKIN then selected outgoing ’s from a given angular distribution and determined energy and direction of both final-state particles from two-body kinematics. This information was passed to the GEANT simulation program (CBall). The two photons from and the neutron were tracked through all elements on which they were incident and the deposited energy was recorded. The Monte Carlo events were then analyzed in the same way as the real data. The average acceptance for a given bin was the ratio of the number of events that passed the cuts divided by the number thrown.
The two photons and neutron traversed the LH2 target, the containment vessel, beam pipe and veto barrel scintillator before reaching the Crystal Ball. The photons could convert to or the neutrons could interact hadronically in any of these materials. The veto barrel rejected these events if the energy deposited exceeded the signal threshold. This threshold was low in order to reject minimum ionizing charged particles, so this correction was significant. It was evaluated as part of the Monte Carlo simulation.


Calibration of the veto barrel was accomplished using special runs for scattering taken with a charged trigger. The CB was used to determine the direction of the outgoing and the position at which it traversed the veto barrel. Comparison to Monte Carlo simulation of the same events provided the relationship between the energy deposited and the signal pulse heights recorded for all eight photomultiplier tubes. The attenuation length of the scintillation light along the veto barrel was determined from the correlation of the pulse height measured at both ends with the position that was determined for the . In the simulation for , this attenuation was applied to any energy that was deposited in the veto barrel and compared to the signal threshold. Simulated events that satisfied the VB logic were counted as charged events.
A gauge of the performance of the CB and of the Monte Carlo simulation is demonstrated in the invariant mass distribution in Fig. 2. The rms width of the distribution is 12.1 MeV, or 9.0%. An energy resolution of 1.74%/E0.315, where E is the crystal energy in GeV, was applied in the simulation. Comparison of the missing mass distribution is also shown in Fig. 2.
Comparison between data and results of the simulation for the total trigger energy (the energy deposited in all crystals except the edge crystals) is shown in Fig. 3. The full-geometry analysis was used for the comparison on the left. The plateau below 0.2 GeV is caused by events in which significant energy was deposited in a guard crystal. The trigger threshold at 75 MeV is readily seen on this plot. The trigger energy for the near-edge-cut analysis is shown on the right in Fig. 3, where the plateau is replaced by a tail in both the data and the simulation. The two-peak structure between 0.20 and 0.35 GeV in Fig. 3 reflects the parabolic angular distribution of the differential cross section at this momentum as shown in the results below. The cross section peaks at forward angles where the laboratory energy of the is highest, and also at backward angles where this energy is lowest. The small difference in the relative height of the the peaks is due to the difference between what is used in the simulation and what is measured. The ability of the simulation to reproduce in detail the invariant mass, missing mass and trigger energy under different conditions give confidence that it can be used to determine the acceptance.
The acceptance as a function of is shown for both full-geometry and near-edge-cut analyses in Fig. 4 at 298 MeV/. At this momentum 14% of the events were rejected due to inclusion of the veto barrel in the simulation. The acceptance for the near-edge-cut analysis falls almost to zero for the most forward angle bin at this momentum. The full-geometry analysis must be used here for a reasonable measurement of the differential cross section near . The full-geometry acceptance using a 20 MeV crystal threshold is also shown. This acceptance is 30% lower than that using the lower threshold.
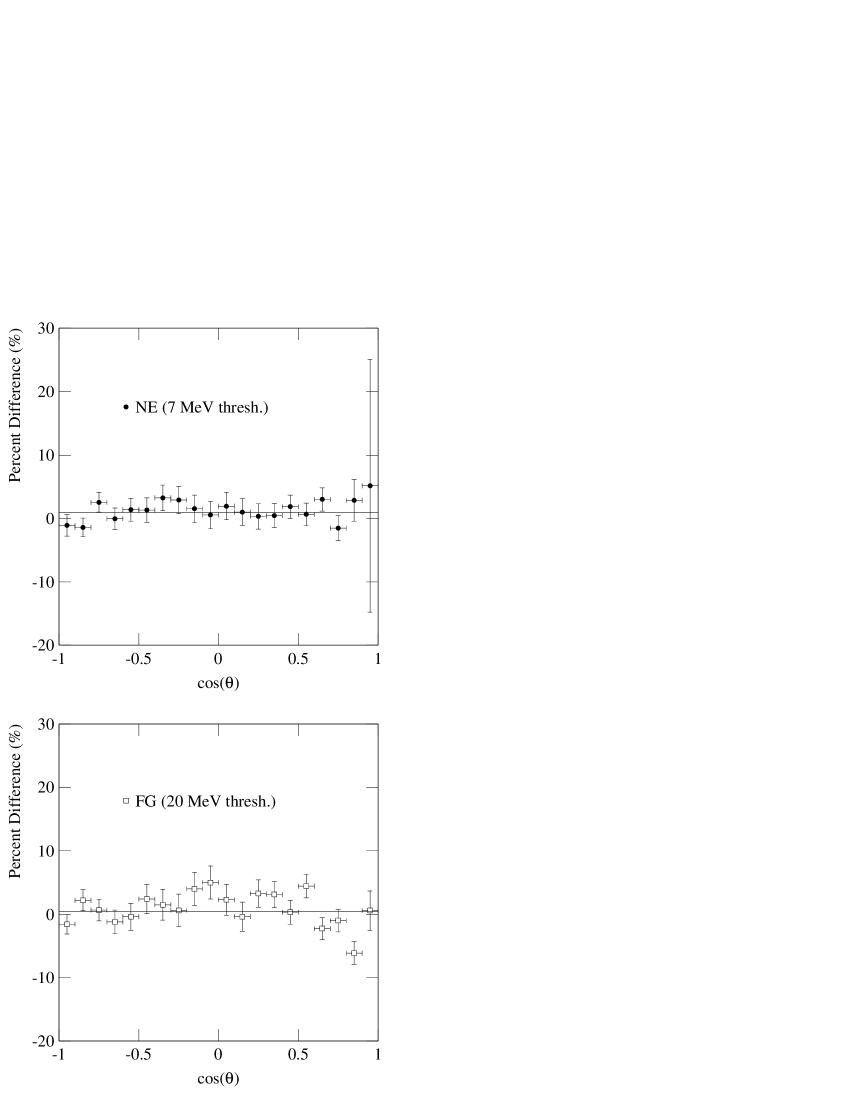
The acceptance-corrected yields for the three analyses shown in Fig. 4 are compared in Fig. 5. Using the full-geometry, 7-MeV threshold analysis as the standard, the percent difference of the near-edge-cut analysis is shown in the top half of the figure. The line is drawn at the average difference, which was just less than 1%. Little evidence of a shape difference is exhibited. Confidence is gained that the full-geometry analysis can be used to improve the statistics, particularly at the forward angles. The same comparison is made for the full geometry, 20-MeV threshold analysis in the bottom half of Fig. 5. The average of these yields is 0.45% higher than the standard analysis. The reproducibility of the acceptance-corrected yields at the 1% level for conditions in which the acceptance changes by as much as 30% lends credibility to the Monte Carlo simulation.
III.3 Beam momentum
The momentum calibration of the C6 and C8 beam lines have been checked extensively in previous experiments, including two recent publications from our collaborationStarostin et al. (2001); Tippens et al. (2001). The good energy and spatial resolution of the Crystal Ball can be utilized to determine the pion beam momentum at target center. The procedure was as follows:
-
•
The overall gain of the NaI crystals was adjusted so that the centroid of the invariant mass spectrum of two-cluster events equaled the mass. A similar procedure was applied to the Monte Carlo simulation.
-
•
The data were analyzed assuming different values of the “real” beam momentum. Monte Carlo events were generated and analyzed at the same intervals of the beam momentum (1 MeV/). The Monte Carlo events were distributed in angle as predicted by the recent GW SAID FA02 analysisArndt et al. (2004) at the nominal momentum.
-
•
The difference in the missing mass was plotted as a function of the momentum and found to be linear. A linear fit of the missing mass difference was performed.
-
•
The solution of the linear fit where the difference was zero was chosen as the correct central beam momentum at target center.
This technique gives the average momentum of the pions that produced charge-exchange events. These results can be compared to the pion momentum at target center by subtracting from the calibrated momenta the momentum loss in the beam scintillators, air, vacuum windows and half of the length of the LH2 target. Table 1 shows the values of the pion momenta obtained from these methods.
| CB Analysis | C6 Calibration |
|---|---|
| 147.9 | 146.6 |
| 173.8 | 174.0 |
| 188.3 | 186.7 |
| 212.3 | 209.8 |
| 237.9 | 236.3 |
| 271.2 | 268.0 |
| 298.3 | 296.5 |
| 322.8 | 321.3 |
The momenta from the CB analysis in Table 1 are used for the present results. The first dipole in the C6 line was adjusted slightly as part of the beam tuning procedure in order to center the beam on the target, which can produce small deviations from the nominal momentum for a given tune. The momenta from the C6 calibration are systematically lower by an average amount of 1.7 MeV/, which is adopted as the estimated uncertainty in the momenta.

III.4 Beam contamination and systematics
The contamination of muons and electrons in the beam were evaluated using time-of-flight (TOF). This technique limited the upper momentum to 323 MeV/ in order to provide adequate separation between ’s, ’s and ’s. Data at higher momenta (up to 750 MeV/) require a separate analysis of the electron contamination from the Cherenkov counter and will be published at a later time. Pion fractions at ST were determined directly from the S1-ST TOF (5.2 m flight path, see Fig. 1b) at the four lowest momenta. The S1-BVS TOF (8.9 m flight path) was used at the four highest momenta, which required a correction back to ST.
Sample TOF spectra are shown at 238 MeV/ in Fig. 6 for both S1-ST and S1-BVS. The S1-BVS TOF was used to determine the contaminations at this and higher momenta due to the overlap of the small muon peak with the pion peak in the S1-ST spectrum.
The on-momentum muons in the middle peak originate from pions that decay in the vicinity of the production target and fall into the acceptance of the beam channel. Muons that originate from pion decay in the beam line before the last magnetic element typically fall outside of the channel acceptance. Muons that originate from pion decay after the last beam channel magnet cannot be distinguished from pions in the TOF. A correction to the pion area was made for these so-called decay muons that hit either ST or BVS. This fraction was determined from a beam line Monte Carlo program based on GEANT gea . The simulation started at the exit of the last quadrupole with the trajectories that were determined from the beam drift chambers. The ratio of decay muons to pions ranged from 1.8% (6.2%) at ST (BVS) at 323 MeV/ to 2.7% (8.8%) at 148 MeV/. The BVS percentages were higher due to its larger size (15.2 cm x 15.2 cm x 0.6 cm thick) and the decay of pions between ST and BVS.
The simulated TOF distributions for the decay muons peaked near the pion peak but had tails on both sides corresponding to forward- and backward-going muons in the pion frame. Thus four gaussian peaks were fitted to determine the peak areas corresponding to ’s, on-momentum ’s, ’s and decay ’s. The ratio of decay ’s to ’s in the fit was forced to be that predicted by the beam Monte Carlo simulation.
Other constraints were utilized in the fits. Widths of the peaks were averaged for the different particles at lower momenta where the peaks were well separated and applied as constraints at the higher momenta where they overlapped. The positions were constrained by calculating the positions for the different momenta and applying a small linear correction determined empirically at the lower momenta. The on-momentum muon areas in the fits to the S1-ST TOF at the four highest momenta were constrained by assuming that the ratio of these muons that appeared in the S1-BVS TOF was the same as for electrons. This assumption was verified by the beam line Monte Carlo simulation and from the analyses at the lower momenta.


.
Corrections were applied for decay and multiple scattering of beam pions between ST and the target. These corrections were determined using the beam line Monte Carlo program to start with pions at the center of the drift chambers and propagate them to the target center. The fraction of pions within the target radius at target center to the number traversing ST was recorded. The multiple scattering losses are significant, resulting in an additional reduction of pions at target center (compared to decay alone) of 5% at 323 MeV/c and 19% at 148 MeV/c. An uncertainty of 20% of this correction was applied and is the dominant contributor to the overall systematic uncertainty at the lower momenta.
IV Results
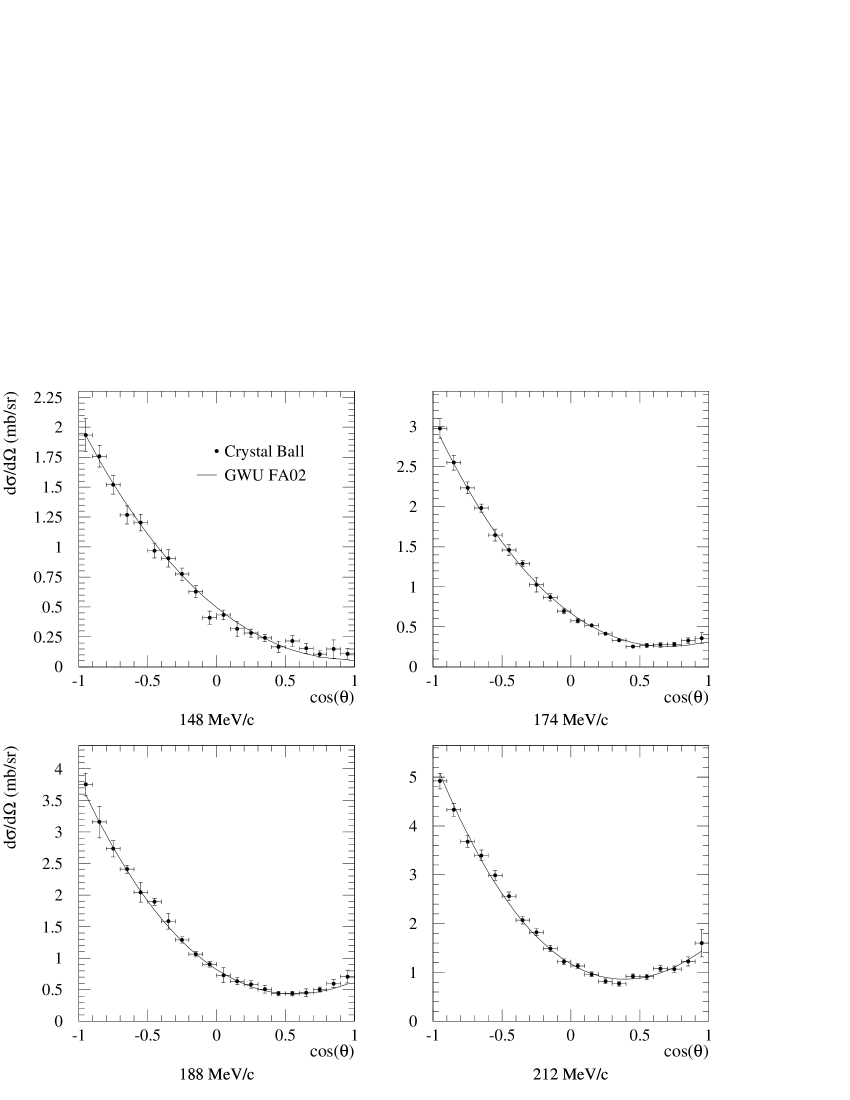
The obtained values of differential cross sections are shown in Tables 2 and 3. They are plotted in Fig. 7 and Fig. 8 together with the results of the FA02 partial-wave analysis of the George Washington group Arndt et al. (2004). The statistical uncertainties of the differential cross section are typically 2-6% except at the lowest momentum and the forward-angle points at the three lowest momenta where the cross sections decrease to a few tenths of a mb.
A minimum systematic uncertianty of 2.0% was applied at all momenta to account for the calibration of the veto barrel, the uncertainty of determining the probability of vetoing legitimate events in the veto scintillators. An additional 1.5% was added at all momenta to account for the uncertainties in effective target length, hydrogen density, and the residual gas in the target for the empty runs. The following systematic uncertainties were included in Tables 2 and 3: 1) the uncertainties in the fits of the pion peak in the TOF spectra (1%), 2) the statistical uncertainty for the counts in the pion peak in the TOF spectra (0.5 - 1.4%), and 3) 20% of the multiple scattering losses to the pion beam (1.1 - 5.9%). The quadrature summation of these factors gives total systematic uncertainties of 3.1% to 6.5%, increasing as the beam momentum decreases.
The data presented here were analyzed independently at ACU and PNPI. Consensus was obtained on the systematic factors and initial differences in the separate analyses were useful in estimating the systematic uncertanties. Independent energy calibrations, cuts, acceptance calculations and the like produced point-to-point differences in the results between the analyses. These differences were almost always smaller than the statistical uncertainties, in which case the cross section reported is the weighted average and the uncertainty is the simple average. For the cases where the cross section differed by more than the statistical uncertainty the uncertainties were increased so that they extended to the points obtained from the separate analyses.
The differential cross sections were integrated to obtain the total charge-exchange cross sections at the eight momenta. These cross sections, statistical uncertainties and total uncertainties are listed in Table 4. The systematic uncertainty was added in quadrature to the statistical uncertainty for the total uncertainty. The results are shown in Fig. 9. As with the differential cross sections, the general agreement with the GWU FA02 partial-wave analysis is good. The most accurate data on which the partial-wave analysis is based are Ref.Bugg et al. (1971); Friedman et al. (1993). These experiments measured the fraction of beam pions that converted to neutral final states in a hydrogen target and made corrections for small effects such as .
V Conclusion
Differential cross sections of the charge-exchange reaction are presented in the region of the (1232) resonance. The present results nearly double the database for these measurements in this momentum interval. Complete angular coverage is provided at all momenta using the Crystal Ball multi-photon spectrometer.
The obtained cross sections are in good agreement with the results of the GWU FA02 partial-wave analysis based on earlier experiments. These data provide more robust input for determinations of the mass and width splitting of the - resonances and to investigate isospin breaking using partial-wave analyses, potential models or chiral Lagrangians. The data will be useful for obtaining some of the most important numbers in hadronic physics: the NN coupling constant, the N sigma term, and the up-down quark mass difference.
| Momentum | 148 MeV/c | 174 MeV/c | 188 MeV/c | 212 MeV/c | ||||
|---|---|---|---|---|---|---|---|---|
| Systematic unc. | 6.5% | 5.2% | 4.5% | 4.0% | ||||
| unc. | unc. | unc. | unc. | |||||
| -0.95 | 1.934 | 0.136 | 2.976 | 0.121 | 3.752 | 0.180 | 4.920 | 0.161 |
| -0.85 | 1.757 | 0.089 | 2.550 | 0.094 | 3.159 | 0.251 | 4.330 | 0.132 |
| -0.75 | 1.520 | 0.079 | 2.234 | 0.073 | 2.734 | 0.130 | 3.681 | 0.115 |
| -0.65 | 1.267 | 0.075 | 1.983 | 0.050 | 2.409 | 0.066 | 3.397 | 0.108 |
| -0.55 | 1.204 | 0.069 | 1.646 | 0.073 | 2.045 | 0.158 | 2.987 | 0.099 |
| -0.45 | 0.970 | 0.062 | 1.459 | 0.065 | 1.894 | 0.054 | 2.561 | 0.089 |
| -0.35 | 0.905 | 0.073 | 1.288 | 0.038 | 1.584 | 0.126 | 2.071 | 0.078 |
| -0.25 | 0.774 | 0.052 | 1.025 | 0.092 | 1.291 | 0.049 | 1.822 | 0.072 |
| -0.15 | 0.627 | 0.050 | 0.868 | 0.045 | 1.064 | 0.042 | 1.487 | 0.064 |
| -0.05 | 0.410 | 0.054 | 0.696 | 0.029 | 0.903 | 0.042 | 1.219 | 0.057 |
| 0.05 | 0.434 | 0.040 | 0.575 | 0.027 | 0.728 | 0.118 | 1.135 | 0.055 |
| 0.15 | 0.317 | 0.065 | 0.519 | 0.024 | 0.636 | 0.059 | 0.962 | 0.051 |
| 0.25 | 0.282 | 0.033 | 0.414 | 0.024 | 0.584 | 0.060 | 0.820 | 0.047 |
| 0.35 | 0.241 | 0.031 | 0.332 | 0.022 | 0.506 | 0.061 | 0.768 | 0.046 |
| 0.45 | 0.166 | 0.047 | 0.253 | 0.024 | 0.439 | 0.036 | 0.919 | 0.052 |
| 0.55 | 0.217 | 0.043 | 0.266 | 0.027 | 0.439 | 0.037 | 0.909 | 0.053 |
| 0.65 | 0.154 | 0.043 | 0.274 | 0.029 | 0.452 | 0.059 | 1.077 | 0.062 |
| 0.75 | 0.107 | 0.028 | 0.280 | 0.026 | 0.501 | 0.039 | 1.066 | 0.068 |
| 0.85 | 0.149 | 0.077 | 0.326 | 0.035 | 0.597 | 0.063 | 1.224 | 0.091 |
| 0.95 | 0.110 | 0.046 | 0.360 | 0.069 | 0.707 | 0.103 | 1.600 | 0.282 |
| Momentum | 238 MeV/c | 271 MeV/c | 298 MeV/c | 323 MeV/c | ||||
|---|---|---|---|---|---|---|---|---|
| Systematic unc. | 3.5% | 3.4% | 3.1% | 3.1% | ||||
| unc. | unc. | unc. | unc. | |||||
| -0.95 | 7.117 | 0.214 | 7.579 | 0.196 | 6.370 | 0.127 | 4.521 | 0.098 |
| -0.85 | 5.956 | 0.134 | 6.694 | 0.120 | 5.360 | 0.073 | 3.694 | 0.070 |
| -0.75 | 5.273 | 0.107 | 5.610 | 0.206 | 4.646 | 0.106 | 3.290 | 0.063 |
| -0.65 | 4.582 | 0.066 | 4.889 | 0.196 | 3.953 | 0.083 | 2.756 | 0.063 |
| -0.55 | 3.897 | 0.061 | 4.230 | 0.109 | 3.387 | 0.080 | 2.370 | 0.052 |
| -0.45 | 3.408 | 0.055 | 3.614 | 0.134 | 2.929 | 0.122 | 2.070 | 0.048 |
| -0.35 | 2.880 | 0.065 | 3.073 | 0.067 | 2.527 | 0.062 | 1.769 | 0.042 |
| -0.25 | 2.468 | 0.070 | 2.713 | 0.061 | 2.207 | 0.051 | 1.606 | 0.040 |
| -0.15 | 2.071 | 0.074 | 2.459 | 0.057 | 1.994 | 0.033 | 1.443 | 0.036 |
| -0.05 | 1.862 | 0.046 | 2.215 | 0.053 | 1.927 | 0.032 | 1.491 | 0.037 |
| 0.05 | 1.690 | 0.040 | 2.166 | 0.052 | 1.966 | 0.032 | 1.597 | 0.038 |
| 0.15 | 1.570 | 0.035 | 2.117 | 0.098 | 2.081 | 0.033 | 1.790 | 0.040 |
| 0.25 | 1.545 | 0.065 | 2.335 | 0.055 | 2.325 | 0.036 | 1.946 | 0.042 |
| 0.35 | 1.614 | 0.036 | 2.484 | 0.082 | 2.651 | 0.040 | 2.374 | 0.048 |
| 0.45 | 1.758 | 0.038 | 2.808 | 0.063 | 3.077 | 0.043 | 2.803 | 0.054 |
| 0.55 | 1.881 | 0.051 | 3.242 | 0.084 | 3.513 | 0.066 | 3.307 | 0.062 |
| 0.65 | 2.158 | 0.058 | 3.658 | 0.120 | 4.248 | 0.058 | 3.924 | 0.075 |
| 0.75 | 2.447 | 0.056 | 4.277 | 0.100 | 4.934 | 0.103 | 4.517 | 0.115 |
| 0.85 | 2.861 | 0.247 | 5.170 | 0.149 | 5.872 | 0.118 | 5.547 | 0.352 |
| 0.95 | 3.393 | 0.308 | 5.686 | 0.169 | 6.765 | 0.147 | 6.217 | 0.262 |
| Momentum | Total Cross Section (mb) | Statistical Uncer. | Total Uncer. |
| 147.9 | 8.5 | 0.3 | 0.9 |
| 173.8 | 12.8 | 0.3 | 1.1 |
| 188.3 | 16.6 | 0.5 | 1.2 |
| 212.3 | 24.5 | 0.5 | 2.4 |
| 237.9 | 38.0 | 0.5 | 2.1 |
| 271.2 | 48.4 | 0.5 | 2.6 |
| 298.3 | 45.7 | 0.4 | 2.3 |
| 322.8 | 37.1 | 0.5 | 1.9 |
Acknowledgements.
This work was supported in part by the U.S. DOE and NSF, by the Russian Foundation for Basic Research, and by NSERC of Canada.References
- Bagheri et al. (1988) A. Bagheri, K. A. Aniol, F. Entezami, M. D. Hasinoff, D. F. Measday, J.-M. Poutissou, M. Salomon, and B. C. Robertson, Phys. Rev. C 38, 885 (1988).
- Fitzgerald et al. (1986) D. H. Fitzgerald, H. W. Baer, J. D. Bowman, M. D. Cooper, F. Irom, N. S. P. King, M. J. Leitch, E. Piasetzky, W. J. Briscoe, M. E. Sadler, et al., Phys. Rev. C 34, 619 (1986).
- Hauser et al. (1971) M. G. Hauser, K. W. Chen, and P. A. Crean, Phys. Letters B 35, 252 (1971).
- Comiso et al. (1975) J. C. Comiso, D. J. Blasberg, R. P. Haddock, B. M. K. Nefkens, P. Truoel, and L. J. Verhey, Phys. Rev. D 12, 738 (1975).
- Jenefsky et al. (1977) R. F. Jenefsky, C. Joseph, M. T. Tran, B. Vaucher, E. Winkelmann, T. Bressani, E. Chiavassa, G. Venturello, H. Schmitt, and C. Zupancic, Nucl. Phys. A 290, 407 (1977).
- Bayer et al. (1976) W. Bayer, H. Hilscher, W. O’connell, H. Schmitt, Č. Zupančič, L. H. Guex, C. Joseph, M. T. Tran, B. Vaucher, E. Winkelmann, et al., Nucl. Instr. and Methods 134, 449 (1976).
- Berardo et al. (1972) P. A. Berardo, R. P. Haddock, B. M. K. Nefkens, L. J. Verhey, M. E. Zeller, A. S. L. Parsons, and P. Truoel, Phys. Rev. D 6, 756 (1972).
- Borcherding (1982) F. O. Borcherding, Ph.D. thesis, UCLA (1982).
- Gibbs et al. (1995) W. R. Gibbs, L. Ai, and W. B. Kaufmann, Phys. Rev. Lett. 74, 3740 (1995).
- Matsinos (1997) E. Matsinos, Phys. Rev. C 56, 3014 (1997).
- Fettes and Meissner (2001a) N. Fettes and U.-G. Meissner, Phys. Rev. C 63, 045201 (2001a).
- Fettes and Meissner (2001b) N. Fettes and U.-G. Meissner, Nucl. Phys. A 693, 693 (2001b).
- Hagiwara et al. (2002) K. Hagiwara et al., Phys. Rev. D 66, 010001 (2002).
- Pedroni et al. (1978) E. Pedroni et al., Nucl. Phys. A 300, 321 (1978).
- Bernicha et al. (1996) A. Bernicha, G. L. Castro, and J. Pestieau, Nucl. Phys. A 597, 623 (1996).
- Abaev and Kruglov (1995) V. V. Abaev and S. P. Kruglov, Z. Phys. A 352, 85 (1995).
- Sainio (2002) M. E. Sainio, in Proc. of 9th Int. Symp. on Meson-Nucleon Physics and Structure of the Nucleon, edited by H. Haberzettl and W. J. Briscoe (2002), p. 138, N Newsletter No. 16.
- Pavan et al. (2002) M. M. Pavan, R. A. Arndt, I. I. Strakovsky, and R. L. Workman, in Proc. of 9th Int. Symp. on Meson-Nucleon Physics and Structure of the Nucleon, edited by H. Haberzettl and W. J. Briscoe (2002), p. 110, N Newsletter No. 16.
- Olsson and Kauffman (2002) M. G. Olsson and W. B. Kauffman, in Proc. of 9th Int. Symp. on Meson-Nucleon Physics and Structure of the Nucleon, edited by H. Haberzettl and W. J. Briscoe (2002), p. 382, N Newsletter No. 16.
- Stahov (2002) J. Stahov, in Proc. of 9th Int. Symp. on Meson-Nucleon Physics and Structure of the Nucleon, edited by H. Haberzettl and W. J. Briscoe (2002), p. 116, N Newsletter No. 16.
- Bloom and Peck (1983) E. D. Bloom and C. W. Peck, Ann. Rev. Nucl. Sci. 33, 143 (1983).
- Starostin et al. (2001) A. Starostin et al., Phys. Rev. C 64, 055205 (2001).
- Stanislaus et al. (2001) T. D. S. Stanislaus et al., Nuc. Inst. and Meth. A 462, 463 (2001).
- (24) GEANT 3.21 CERN program library long writeup W5013, CERN, Geneva, Switzerland.
- Tippens et al. (2001) W. B. Tippens et al., Phys. Rev. D 63, 052001 (2001).
- Arndt et al. (2004) R. A. Arndt, W. J. Briscoe, I. I. Strakovsky, R. L. Workman, and M. M. Pavan, Phys. Rev. C (2004), to be published.
- Bugg et al. (1971) D. V. Bugg, P. J. Bussey, D. R. Dance, A. R. Smith, A. A. Carter, and J. R. Williams, Nuc. Phys. B 26, 588 (1971).
- Friedman et al. (1993) E. Friedman, M. Paul, M. Schechter, A. Altman, B. K. Jennings, G. J. Wagner, N. Fazel, R. R. Johnson, N. Suen, and Z. Fraenkel, Phys. Lett. B 302, 18 (1993).