A multi-detector array for high energy nuclear pair spectrosocopy
Abstract
A multi-detector array has been constructed for the simultaneous measurement of energy- and angular correlation of electron-positron pairs produced in internal pair conversion (IPC) of nuclear transitions up to 18 MeV. The response functions of the individual detectors have been measured with mono-energetic beams of electrons. Experimental results obtained with 1.6 MeV protons on targets containing 11B and 19F show clear IPC over a wide angular range. A comparison with GEANT simulations demonstrates that angular correlations of pairs of transitions in the energy range between 6 and 18 MeV can be determined with sufficient resolution and efficiency to search for deviations from IPC due to the creation and subsequent decay into of a hypothetical short-lived neutral boson.
pacs:
07.1.+a, 14.80.-j, 23.20.En, 29.30.Dn; or:
1 Introduction
Spectroscopy of internal pair conversion (IPC), has a long tradition [1]. It has been an essential tool to identify nuclear transitions with energies in the few MeV region. This paper describes an experimental arrangement which has been used in a search for elusive neutral bosons. In the investigations with this equipment we obtained positive signals for deviations from IPC which may be of basic interest.
The IPC-branching ratio relative to the competing process of -ray emission and the angular correlation of the pairs depend on the multipolarity of the transition and measurements of IPC have enabled an accurate determination of energy, spin and parity of many nuclear levels. Magnetic spectrometers have been used to identify coincident pairs in order to measure the multipolarity and, with high precision, the energy of the corresponding transition. However, the excellent energy resolution of magnetic spectrometers can only be achieved at the expense of a small acceptance and hence long counting times were needed for such measurements.
For high-statistics measurements of the angular correlation of pairs, primarily detector telescopes with large solid angles were used. Each telescope consists of two detectors, usually a combination of a thin (E) and a thick (E) detector operated in coincidence to suppress singles -ray events (e.g. from Compton processes). The angular correlation was then measured stepwise with two telescopes placed at different angles or, preferably, simultaneously by a multi-telescope assembly.
Following the early experience obtained in the fifties and sixties, several new large acceptance pair spectrometers have been constructed in the nineties in particular at KVI Groningen [2, 3, 4, 5, 6] and Stony Brook [7, 8, 9].
Some years ago, a search for neutral bosons [10], possibly emitted in nuclear transitions and decaying into pairs, has been started offering a new challenge to old techniques. Within the constraints of energy and spin-parity conservation, such a neutral boson would compete with -ray and IPC decay in certain nuclear transitions. The signature of such a boson would be its two-body decay into an electron-positron pair.
IPC occurs when a nucleus emits an pair instead of a -ray quantum. Together with the recoil of the emitting nucleus this forms a planar three-body decay with usually a small opening angle, E0 transitions forming a noticeable exception to this rule. However, in the conceivable case when the nucleus emits a neutral boson, instead of IPC, this happens by two-body decay. When the boson subsequently decays into an pair, again a two-body decay occurs, resulting in back-to-back emission of the pairs in the centre of mass system. In the laboratory system the momentum of the decaying boson makes this angle smaller than 180o but leaves the distribution totally different from IPC: the distribution becomes truly instrumental in searches for such elusive neutral particles.
Various experimental studies have provided constraints on the possible existence of light, elusive neutral bosons [11, 12]. Short-lived neutral bosons have been searched for in beam dump experiments [13, 14, 15] for the mass region between the threshold at 1.022 MeV/c2 and the mass of the muon (105.7 MeV/c2). It is interesting to note that these searches still allow a mass-lifetime window for masses between 5 and 100 MeV/c2 at lifetimes shorter than 10-13 s.
A decade ago our interest in the possible existence of a hitherto undiscovered neutral boson was also triggered by results from emulsion studies [16, 17] of relativistic heavy ion reactions, in which a distinct cluster of pairs was observed at short distance from the interaction vertex. Interpreted in terms of the emission and subsequent decay of a light boson, the relevant events show an average invariant mass of 9 MeV/c2 and lifetime s.
The possibility to investigate the open mass-lifetime window provided the motivation [18] to build an apparatus to perform high-statistics IPC measurements of E1 and M1 transitions and to search for anomalies in the angular correlations of pairs with invariant mass between 5 and 15 MeV/c2 and a lifetime shorter than s.
2 General considerations
In order to investigate deviations from normal internal pair-conversion, a thorough understanding of the apparatus and its properties has to be achieved and demonstrated. Therefore, extended simulations and calibration procedures were performed during several stages of the construction of the spectrometer. The simulations were performed with the GEANT code from CERN[22].
Besides the IPC process, also the background of external pair creation (EPC) and multiple lepton scattering must be considered. For this purpose several event generators were developed and applied to the code. Below we give a survey of the most important generators used in this implementation. A more detailed description is given in the PhD thesis of Fröhlich [18].
2.1 Internal pair conversion (IPC)
For E1 and M1 transitions the formulation by Goldring [23] for the triple differential pair conversion coefficient is used. In the Born approximation for E1 and M1 multipolarities the differential transition probabilities are:
| (1) | |||||
with the sign equal to for M1 and for E1. The parameter is the pair energy in units of , is the total momentum in units of , and is the fine structure constant.
The square of the invariant mass of the electron positron pair, , depends on the opening angle according to
| (2) |
where is close to unity for sufficiently high pair energies. The dependence of the differential pair conversion coefficient in Eq. 1 is mainly determined by the second term and is similar for E1 and M1 transitions over a wide range of correlation angles. It has the approximate shape of .
For E0 transitions the differential production cross section for pair conversion can be written in first order as [26, 27, 28, 29]:
| (3) |
Here is an anisotropy factor, given in Born approximation for light nuclei by:
| (4) |
Equations 2 and 3 are used as input for a two dimensional random generator, provided by the HBOOK library (CERN) [22], to generate the emission angle and the energy of the positron in an IPC event.
2.2 External pair conversion (EPC)
Except for monopole transitions, all excited nuclear levels decay predominantly by -ray emission. Therefore special attention has to be paid to the background created by external pair conversion (EPC) in the spectrometer [31, 32, 33, 34]. For Eγ between 10 and 20 MeV and for values smaller than 20 the cross section for EPC on a nucleus can be approximated by:
| (5) |
The cross-section for EPC in the field of the atomic electrons is a factor smaller, with 1.13 at 17 MeV transition energy. It amounts to about 15% for 12C and therefore should be added to the contribution by nuclear EPC.
The standard implementation of EPC in GEANT consists of two steps: i) selection of the first lepton’s energy by an acceptance-rejection method (von Neumann) [12] within the constraints of the Bethe-Heitler theory, ii) selection of the opening angle between the leptons by using an approximation to the theory by Tsai [35]. The momentum vectors of the leptons and the recoiling nucleus are then given by momentum conservation.
The comparison of the energy- and angle distributions of this implementation to results obtained by the theory of Olsen [32], which is more appropriate for the transition energies considered here, shows significant differences. The standard implementation results in a shift of the maximum of the energy distribution by a factor 2 and in a more moderate slope of the opening angle distribution. This leads to an overestimation [18] of larger opening angles by a factor of up to 10. Therefore, the standard GEANT routines were modified to include an option to create lepton pairs according to the theory of Olsen [32].
The essential difference between EPC and IPC stems from the fact that EPC depends on the geometry of the setup. As a result the simulation of EPC requires at least two orders of magnitude more computing time than for IPC. To keep the computing time within reasonable limits, the probability for EPC was increased by a factor 1400 in our simulations.
The angular correlation for EPC is strongly peaked around and is well described by exp . Using the option for the Olsen theory results in degrees, whereas the standard GEANT option yields .
2.3 The two-body decay of a boson
For our boson search it is crucial that the disintegration of the boson into an pair is a two body decay. In the centre of mass system (CM) of the boson the and are emitted under 180o. In the laboratory system the boson moves with , resulting in opening angles which can be much smaller than 180o.
In the simulations, the emission of the boson as well as its decay into a lepton pair were assumed to be isotropic in the respective CM systems. The invariant mass of the boson, the positron and electron momenta and and their energies and are related by
| (6) |
where is the angle between the electron and positron momenta.
3 Apparatus
3.1 Detector system
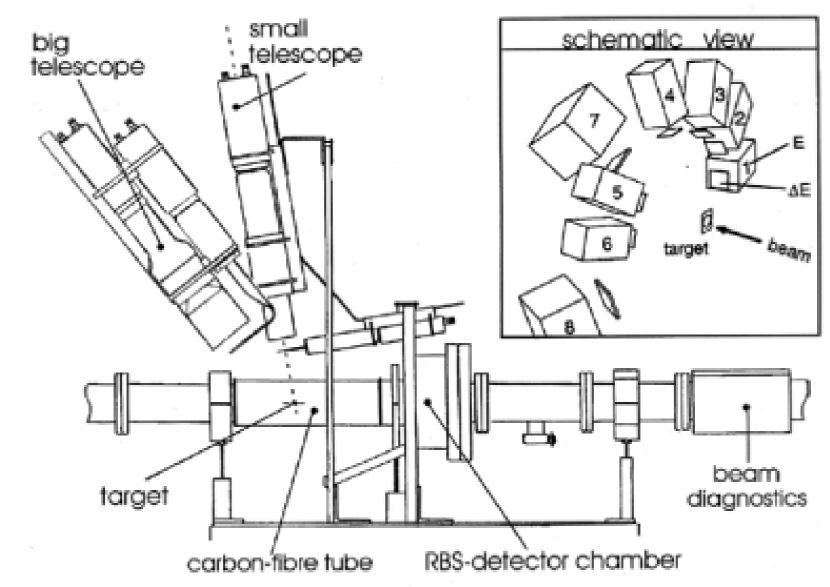
The IKF spectrometer consists of six detector telescopes. They are mounted at fixed angles allowing the simultaneous observation of 15 correlation angles. Each telescope consists of a E-detector ( cm2; thickness: 0.1 cm), and an E-detector ( cm2; thickness: 7.0 cm). The telescopes are positioned on a circular rail with the beam axis as center. In order to allow for a differential study of the energy split of the lepton pairs, this basic array has been extended by two “larger” telescopes for collecting better statistics (E-detectors: cm2 and thickness: 0.3 cm; E-detectors: cm2 and thickness 7.0 cm). In the energy region of interest (5 to 20 MeV) the energy loss of the electrons is roughly constant and amounts to 200 keV for the 1 mm and 600 keV for the 3 mm E-detectors [43]. The two larger detectors can be mounted to cover a selected range of correlation angles, e.g. where deviations from the decay pattern of conventional IPC were observed. Their implementation into the basic array raised the number of correlation angles to 28.
By displacing the target along the beam axis changes in the relative angles between the detectors remained to some extent still possible. The distances from the E-detectors to the target are about 11 and 14 cm for the small and the large detectors respectively.
3.2 Beam and Target
In Fig. 1 a side view of the experimental setup is sketched. The beam, coming from the right hand side, first passes a beam diagnosis chamber. To minimize the amount of material around the target, a 24 cm long electrically conducting carbon fibre tube with a radius of 3.5 cm and a wall thickness of only 0.8 mm is used. The target, positioned perpendicular to the beam, was held by a single rod of 3 mm thickness at the side opposite to the spectrometer system. Aluminum target frames of a thickness of only 0.3 mm had outer dimensions of 2025 mm2 and an inner diameter of 15 mm. Target foils were thin: typically less than 2 mg/cm2. Their thickness was either adapted to the resonance width of the reaction under investigation or to the demand of a sufficient true-to-random ratio of coincidences. The beam is stopped in a tantalum cup at 150 cm behind the target. In order to achieve approximately the same average path length inside the target for all detected leptons, the detectors were installed at slightly inclined angles (by 25o for the small telescopes) relative to the target plane. In this way, interference by the target frame is avoided with only a moderate reduction of the correlation-angular range.
| Detector | Distance | Solid angle | Polar | Azimuthal |
|---|---|---|---|---|
| angle | angle | |||
| [cm] | [10-2 sr] | |||
| 1 | 11.50 | 3.57 | 174.6o | 63.4o |
| 2 | 12.00 | 3.28 | 150.5o | 64.6o |
| 3 | 11.50 | 3.56 | 127.8o | 63.4o |
| 4 | 11.65 | 3.48 | 86.3o | 63.8o |
| 5 | 10.70 | 4.12 | 26.2o | 66.3o |
| 6 | 10.93 | 3.87 | 0.34o | 64.3o |
| 7 | 13.02 | 9.57 | 49.7o | 41.7o |
| 8 | 15.20 | 8.76 | -34.2o | 64.6o |
In Table 1 the azimuthal and polar angles of the detectors are listed together with the distances to the target. In Table 2 the relative central correlation angles are listed for all 28 detector combinations. The rather high redundancy in correlation angles provides an independent way to examine the detector efficiencies (see section 3.6).
| Relative | Det. |
|---|---|
| angle | comb. |
| 20.6o | 2-3 |
| 21.8o | 1-2 |
| 23.8o | 5-6 |
| 31.3o | 5-7 |
| 31.3o | 6-8 |
| 36.4o | 4-7 |
| 37.2o | 3-4 |
| Relative | Det. |
|---|---|
| angle | comb. |
| 42.0o | 1-3 |
| 44.9o | 6-7 |
| 54.6o | 4-5 |
| 54.9o | 5-8 |
| 57.6o | 2-4 |
| 63.6o | 3-7 |
| 68.0o | 7-8 |
| Relative | Det. |
|---|---|
| angle | comb. |
| 76.4o | 4-6 |
| 77.9o | 1-4 |
| 79.0o | 2-7 |
| 90.0o | 3-5 |
| 91.6o | 1-7 |
| 103.8o | 4-8 |
| 108.4o | 3-6 |
| Relative | Det. |
|---|---|
| angle | comb. |
| 108.3o | 2-5 |
| 122.8o | 1-5 |
| 122.9o | 2-6 |
| 122.4o | 1-8 |
| 126.7o | 3-8 |
| 129.3o | 1-6 |
| 130.6o | 2-8 |
As the lepton ranges in the E-detectors vary strongly with energy, a Lucite light guide has been inserted between scintillator and photomultiplier in order to make the detected pulse height independent of the position of the scintillation light emission. These light guides had a length of 10 cm for the small and 5 cm for the large telescopes, respectively. The dependence of the E-detector’s signals on the position of the photon emission was checked in a series of measurements with a collimated 207Bi source and a magnetically analyzed 90Sr source. The measured pulse heights for any position on the long side (detector depth) of a scintillator block were constant within 1% for all E-detectors of the small telescopes [18]. Also the E-detectors were coupled via light guides to their photomultipliers.
During prolonged beam-exposure the target may deteriorate by sputtering or by contamination with decomposing or condensing vacuum remnants. For on-line monitoring of the status of the target the setup was complemented with a surface barrier detector for Rutherford backscattering spectroscopy (RBS) mounted at 175o scattering angle. By comparing the continuously monitored RBS spectra during the measuring periods, any change in the homogeneity of the target can immediately be identified by a deterioration of the peak to background ratio and/or a broadening of the RBS structures [18]. In contrast to the natural boron, the LiO2 targets for the 7Li(pBe reaction had to be exchanged once every two hours. During this time the Li-backscatter signal typically dropped below 50%.
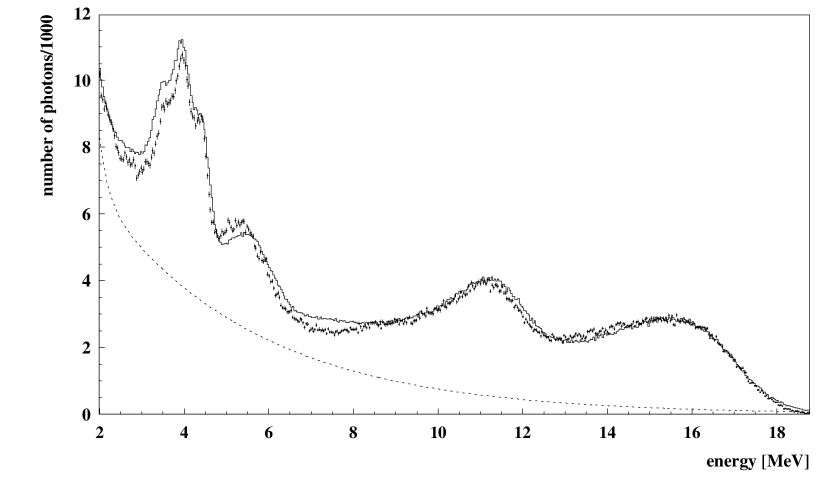
In order to provide a means to compare the measured conversion spectra to the corresponding -spectra, a 3”3” NaI(Tl) detector (not shown in Fig. 1) was located at 53.3 cm vertically from the beam axis covering a solid angle of 16.3 msr. The detector response function has been measured up to energies of 2.7 MeV and has been extrapolated to higher energies assuming an energy dependent Gaussian line shape plus tails (see Fig. 2). Its total detection efficiency in the energy range considered here has been obtained by GEANT simulations. Fig. 2 demonstrates that the GEANT-simulation adequately reproduces the -ray spectrum following the bombardment of a natural boron target with 1.6 MeV protons. For cases where a better resolution of the -ray detection is necessary, the set up was complemented by a Ge(Li) detector.
3.3 Line shapes of the E-detectors
The response of the detectors to monochromatic leptons was investigated at the linear electron accelerator (LINAC) of the Strahlenzentrum Giessen. The electron beam was collimated to a spot of (1.01.0) cm2, and had an energy spread of less than 5% FWHM. The beam entered the telescopes in normal condition, i.e. through the E-detectors into the E-detectors, along the telescope axis. As a typical example Fig. 3 shows the measured response of an E-detector to electrons at six different energies in the range of 6 to 18 MeV. The histograms in the left column of Fig. 3 represent GEANT-simulations of this “Giessen setup” assuming an energy-dependent Gaussian energy resolution function.
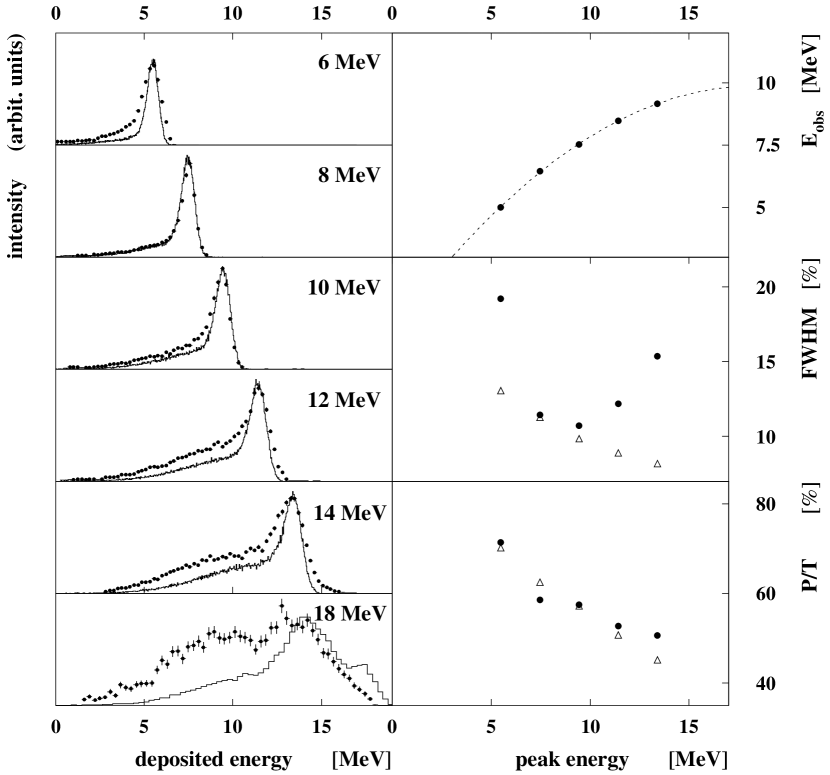
The observed line shapes of all six small telescopes are identical within a few percent. Their energy signals show saturation at higher incident energy as described by the equation:
| (7) |
Here Edep is the deposited electron energy, Eobs is the observed energy proportional to the ADC channel number and is a limiting energy parameter, which was found to be about 40 MeV.
From the GEANT simulation for 18 MeV electrons it is obvious that only in a small fraction of the events the energy is fully absorbed. This is due to the limited depth (70 mm) of the E-detectors. The dominant peak around 14.5 MeV is due to energy loss. Measurement and simulation show a satisfactory agreement for the measurements with 6 to 14 MeV electrons. As the transition energy is shared among the two leptons, a full absorption efficiency up to 15 MeV for the individual detectors is sufficient to investigate the desired range of energies up to 18 MeV. When the range of the pair asymmetry can be limited to more symmetrical values (e.g. ), this range is extended to 25 MeV.
The above calibration implied the use of a focused electron beam and normal impact on the detectors. A comparison of the results thus obtained in Giessen with results from the full experimental setup indicates that a larger number of electrons are scattered out of the detectors, resulting in a decrease of the peak to total ratio, from e.g. 0.6 at 8 MeV in the calibration run to 0.4 in the production run. Furthermore, slightly different line shapes are expected for electrons and positrons, especially in the low energy range [36].
3.4 Solid angles and efficiencies of the detector telescopes
The determination of the correlation angular distributions required a good knowledge of the solid angles and the efficiencies of the telescopes. In view of this the telescopes were made equal to each other and were installed with carefully measured geometrical parameters (mean angle and distance to target spot).
The solid angle acceptances of the telescopes were calculated according to the geometrical parameters and dimensions of the apparatus relative to the target position (see Table 1). The results were verified by simulations with the GEANT code. From these simulations singles and coincidence efficiencies were derived. In a next step, the combined detector efficiencies and solid angles were verified by comparing the measured singles telescope spectra with those obtained by the GEANT simulations. The multi-detector array, by its high redundancy, provides a comfortable way to monitor the combined detector efficiencies by permanently surveying the singles telescope spectra. According to this analysis, the total electron detection efficiency of the detectors was larger than 90% and equal (within a few percent) for all telescopes.
The solid angles and the efficiencies of the later supplemented “large” telescopes were determined by fitting their correlation-angular dependences relative to those extracted for the ”small” telescopes.
3.5 Results from the GEANT simulations
The three main sources for external pair conversion (EPC) in the experimental setup are the target foil, the target frame and the carbon fibre tube. Since the EPC cross-section is proportional to Z (Eq. 5), care has been taken to use low Z components of minimized dimensions. Due to the use of very thin targets, the EPC within the target material represents a negligible fraction of all detected EPC events. The contributions by the target frame are kept low by the tilt angle of the telescopes relative to the target plane. As expected, the carbon-fibre tube, with its thickness of 0.8 mm is the dominant EPC source. This is verified by a projection of the positions of pair conversion onto the instrumental components. About 95% of all EPC pairs, detected by a particular combination of telescopes, are created in a region inside the carbon fibre tube which has the size of a E-detector. This region is located at mid-angle between the two telescopes. The result demonstrates the strongly forward peaked angular distribution of EPC events as described in Section 2.2.
In the case of the 17.23 MeV E1 transition in 12C we compared the theoretical IPC distribution with GEANT simulations including EPC and ’out-scattering’ and found good agreement at all angles (Section 4.2).
3.6 Trigger for data readout and data-acquisition
The signals from the photomultipliers of the eight E- and E-detectors were processed in constant fraction discriminator units (CFD). The CFD-thresholds were adjusted slightly above the noise level for the E-detectors, which are essentially insensitive to -ray events, and somewhat higher for the E-detectors. Chance events from double (or multiple) hits by -ray events in the E-detectors are suppressed by about three orders of magnitude by requiring a E-E coincidence.
The resulting eight telescope signals are further processed in a CAMAC pattern-recognition module (MUEK), which has been developed at IKF [37]. In this module double telescope events are identified by their correlation angle. Due to the small absolute solid angles of the telescopes the rate of double telescope events was much lower than the single telescope rates. In order to allow the simultaneous measurement of single telescope events, the trigger module was set to allow a scaled-down fraction of single telescope events. In this way all experiments could be run almost at the maximum beam currents available. The spectra of single telescope events are used for on-line monitoring of the efficiencies and a first energy calibration of the E-detectors. Especially for the E-detectors with their low CFD thresholds this on-line survey was important. In the off-line analysis these spectra provide a reliable way to determine the telescope efficiencies, which are affected by the count-rate capability and stability of the electronics. Times and energies of all E- and E-detectors were recorded.
4 Experimental Results
The spectrometer has been used in experiments at the 2.5-MV Van de Graaff accelerator of the IKF. Here we report on studies of the two well known proton induced reactions 11BC and 19F(p, O at 1.6 MeV proton energy. For both reactions, angular correlations for pair emission can be found in the literature [38, 39, 40]. Both reactions could be observed simultaneously in our experiments, since a trace of fluorine contamination in the backing foil offered ample statistics for the E0 transition. The proton beam was focused to a beam spot size of approximately mm2 on the target. Its intensity (between 10 and 17 A) was limited by the count rate capability of the data processing, The cross-section of the 11B(C reaction shows a wide resonance ( MeV) at a proton energy of 1.4 MeV with a maximum cross-section of about 27 b/sr [41]. At this energy two dominant transitions govern the -ray emission spectrum [42]. One transition with Eγ = 17.23 MeV depopulates the 17.23 (I T=1) MeV level to the ground state of 12C. The other one with Eγ = 12.14 MeV depopulates the 16.57 MeV (I, T = 1) level to the first excited state [38]. Both transitions are of E1 character, their relative contributions at the given incident energy of 1.6 MeV and a target thickness of 600 g/cm2 were estimated to yield .
4.1 Sum- and difference energy spectra
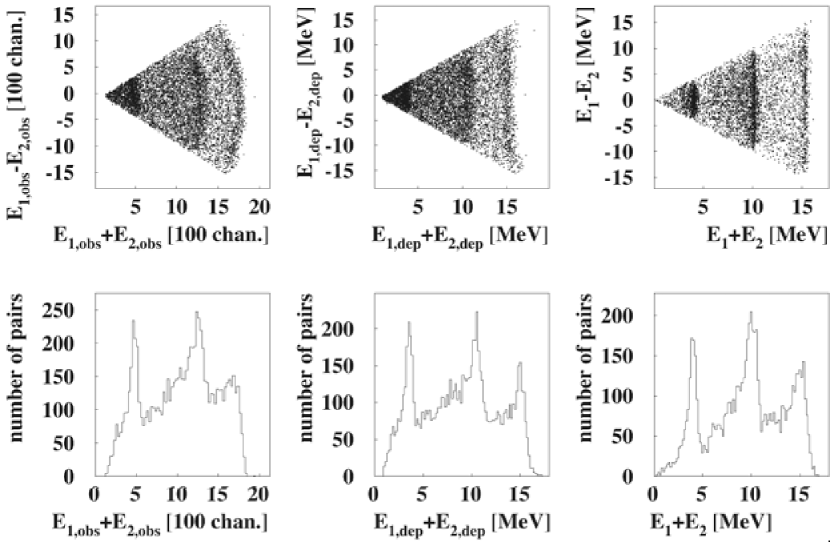
In the upper part of Fig. 4 correlation spectra for the detector combination 1 and 2 are shown for the 11B(p,e+e-)12C reaction at 1.6 MeV in their sum-energy versus difference-energy representation. In the lower part of Fig. 4 the projection onto the sum-energy axis is given. The structures at 11 and 15 MeV are due to the decay of the above mentioned two prominent excited levels in 12C. The deficit in energy for the 17-MeV transition (appearing at 15 MeV) is due to the energy signal saturation (see section 3.3).
The structure around 4 MeV is dominant over the whole angular range and is ascribed to the 6.05 MeV E0 transition in 16O. Its cross section results in 5 mb at 1.6 MeV. A contamination at the level of only 40 ng/cm2 of fluorine would explain the observed intensity. The apparent energy deficit of approximately 1 MeV is explained by energy loss in the carbon-fibre tube and is well reproduced by the GEANT simulations.
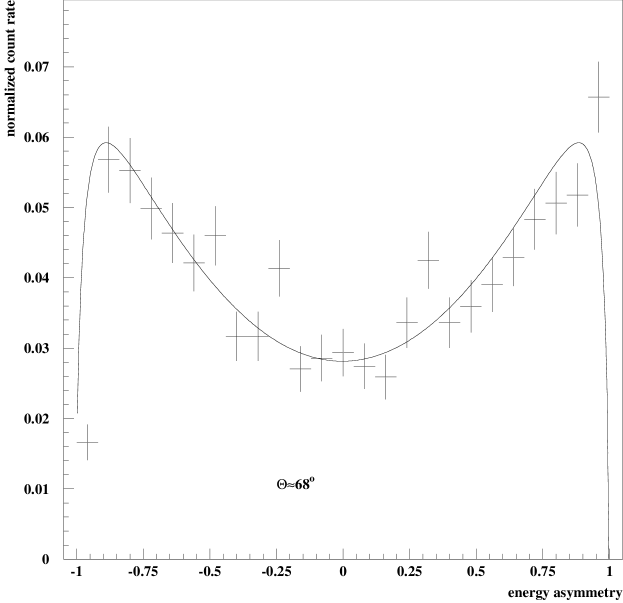
In Fig. 5 the energy difference of pairs is displayed in terms of the energy asymmetry . As the energy spectra at small correlation angles are contaminated by EPC, we present here a spectrum from the combination of the two ”large” telescopes which, in this experiment, had been mounted at a relative angle of 68 degrees. The spectrum is taken from a high-statistics run of the 7Li(p,e+e-)8Be reaction [10, 20, 21], which follows a similar decay pattern as the 11B(p,e+e-)12C reaction and has two prominent M1 lines at 14.64 and 17.64 MeV. The spectrum is generated with a gate on the sum-energy peaks of the latter two transitions. The theoretical expectations are well reproduced and demonstrate that the energy asymmetry spectrum is consistent with the conventional IPC process for M1.
4.2 Distribution of opening angles
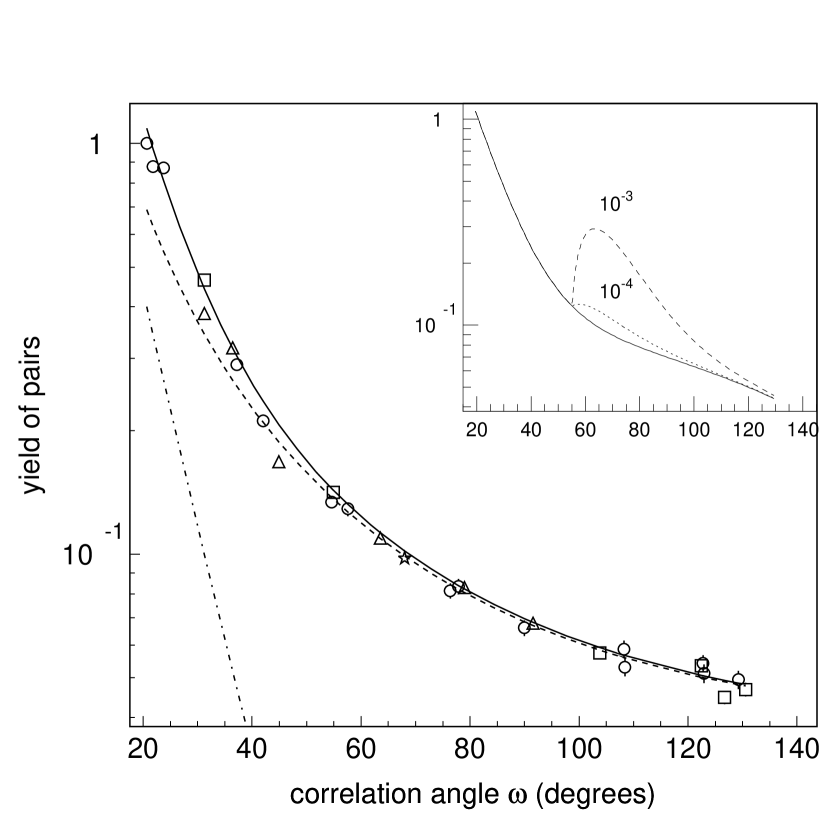
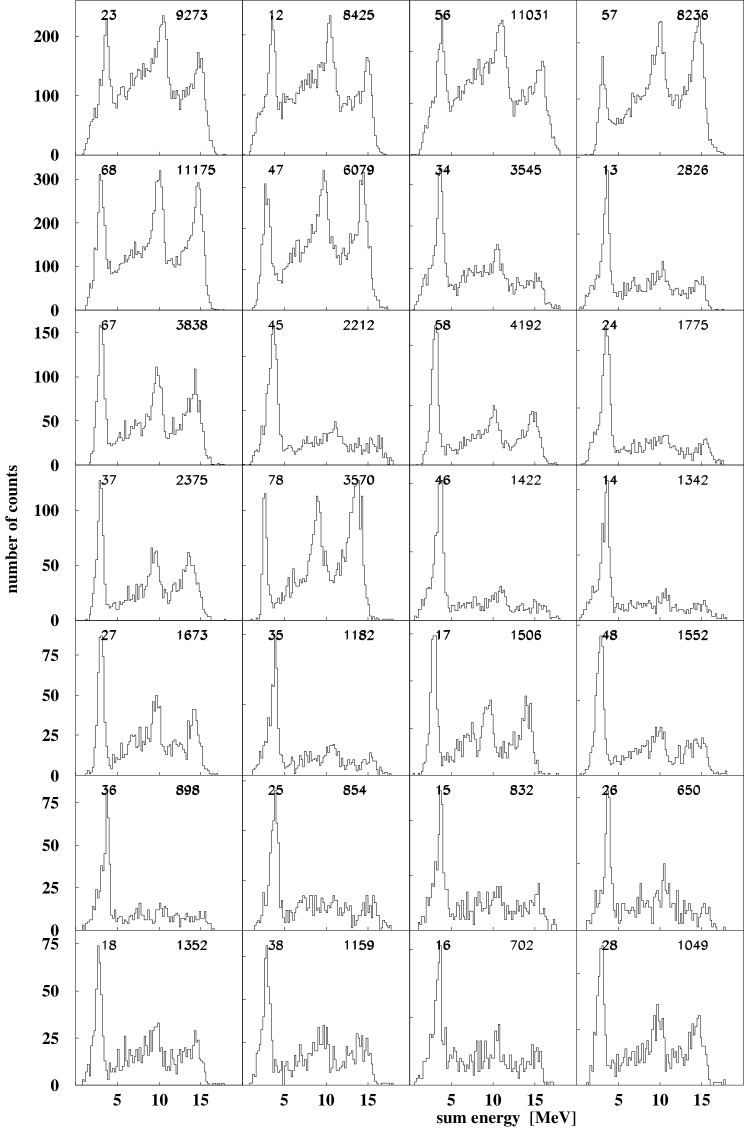
Fig. 6 shows the sum-energy spectra of the boron measurement for the different telescope combinations. Since most of the leptons are within the minimum ionizing range, their energy loss in the target and the E-detectors only results in a constant offset in the sum energy spectra. The target thickness used in the experiments was 600 g/cm2 and accounts for an energy loss of 96 keV for 1.6 MeV protons [44]. This leads to different offsets for the three types of combinations; small telescopes with small telescopes, small telescopes with large telescopes and the combination of the two large telescopes. At closer inspection, the position of the 6.05 MeV structure varies slightly depending on the thickness of the two E-counters, as discussed in section 3.1. Fig. 6 also shows the large differences between the distributions of E0 and E1 transitions. Whereas the E0 contribution below 5 MeV is pronounced in all spectra, the two E1 structures at sum-energies E 5 MeV are strongest at small opening angles and are largely reduced at large correlation angles.
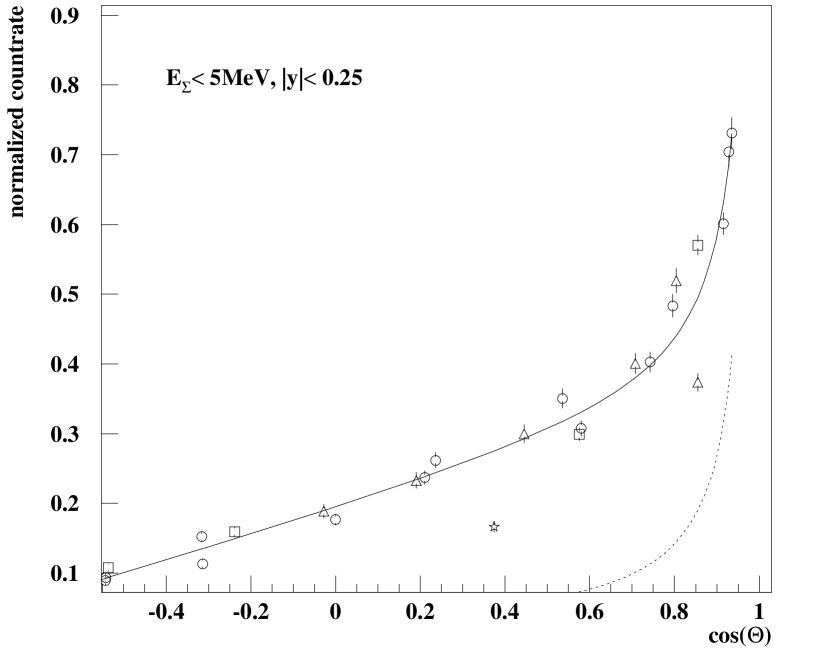
The opening angle distribution for E0 transitions is expected to follow a (1 + cos -dependence. This is demonstrated in Fig. 7 where the measured opening angle distribution is plotted as a function of cos. A good correspondence to the theoretically expected dependence is observed except for the (7-8) telescope combination which suffers from a higher cut-off in the sum spectrum.
Fig. 8 shows the opening angle distribution for the IPC contributions from the two E1-transitions populated in the 11B(p,eC reaction. The data have been projected with a threshold on the sum energy E 5 MeV. The pair intensities have been scaled to unity at the smallest correlation angles. The dashed lines represent theoretical IPC distributions [25] normalized to the data points at large () where the contributions from EPC and multiple scattering are minimal. The size of these latter contributions (dot-dashed lines) has been estimated by means of the GEANT Monte Carlo simulations using the EPC angular correlation from ref. [32] as generator for the 12C events [18]. The solid line in Fig. 8 represents the sum of all contributions.
In case of a hypothetical neutral boson with a mass of 9 MeV/c2, we would observe a steep rise beginning at and followed by a smooth decrease towards the larger angles. In the insert the signatures are displayed for the decay of a 9 MeV/c2 boson with branching ratio relative to -ray emission of and . From the absence of any deviations from the conventional conversion processes in isovector E1 transitions, upper limits were derived on of scalar or vector bosons [10, 19, 20, 21]. They vary from to for a boson mass between 6 to 15 MeV/c2 with a value of for a 9 MeV/c2 boson at the 95% confidence level.
5 Conclusion
A multi-detector array has been constructed to measure energy and angular correlations of IPC from high-energy nuclear transitions. The information of all possible combinations of the eight lepton detector telescopes allows the simultaneous detection of correlation angles between 20 and 130 degrees. The energy resolution of the lepton telescopes is sufficient to identify and separate the nuclear transitions by means of the sum energy and energy asymmetry for lepton pairs from transitions in the energy range between 5 and 18 MeV. By comparing the results of various calibration experiments to extended Monte Carlo simulations with the program code GEANT, it has been shown that the spectrometer is well suited to perform searches for an elusive short-lived neutral boson with a mass between 6 and 15 MeV/c2.
A series of dedicated experimental studies have already been performed with this setup. In one experiment, an excellent agreement with conventional IPC was found for the isovector E1 transitions at 12.2 and 17.2 MeV in 12C. These measurements result in an upper limit of for the branching ratio of a hypothetical boson with a mass of 9 MeV/c2. The latter value is significantly below the theoretical pair conversion coefficient [25] of for a 17.2 MeV E1 transition, indicating the high sensitivity of the experimental device.
6 Acknowledgements
We acknowledge Th. W. Elze (IKF), K. Stelzer (IKF), R. van Dantzig (NIKHEF) and T.J. Ketel (NIKHEF) for valuable discussions. Many thanks are due to K. Hildenbrand (GSI) for his assistance during the construction of the spectrometer, to M. Waldschmidt (IKF) for the excellently prepared targets and to W. Arnold and C. Wesselborg with their technical staff at the Giessen LINAC for help during the calibration runs. The members of the Nuclear Physics Group at ATOMKI, Debrecen, Hungary: A. Krasznahorkay, M. Csatlós, Z. Gaczi, J. Gulyás, M. Hunyadi and Z. Máté are acknowledged for the continuation of the experimental program using the IKF-spectrometer at their MGC-20 cyclotron [45]. One of the authors (K. A. M.) likes to thank the Deutsche Forschungsgemeinschaft (DFG) for financial support in the frame of the Graduiertenkolleg Schwerionenphysik Giessen-Frankfurt.
7 References
References
- [1] R. Wilson, Internal Pair Formation, in: K. Siegbahn (Ed.), Alpha-, beta- and gamma-ray spectroscopy, Vol. 2, North-Holland Publishing Company, Amsterdam, 1965, Ch. XXV(c), p. 1557.
- [2] A. Buda, Thesis, University of Groningen, 1994.
-
[3]
A. Buda, J.C.S. Bacelar, A. Balanda, J. van Klinken,
Z. Sujkowski and A. van der Woude,
Nucl. Instr. and Meth. A335 (1993) 479. -
[4]
A. Buda, J.C.S. Bacelar, A. Balanda, J. van Klinken,
Z. Sujkowski and A. van der Woude,
Nucl. Phys. A553 (1993) 509c. -
[5]
A. Buda, J.C. Bacelar, A. Balanda, A. Krasznahorkay,
H. van der Ploeg, Z. Sujkowski and
A. van der Woude, Phys. Rev. C53 (1996) 157. -
[6]
A. Buda, J.C. Bacelar, A. Balanda, Z. Sujkowski,
A. van der Woude, R. Bersch, H. Ching,
I. Dioszégi, D.J. Hofman, P. Paul, S. Schadmand, R. Varma, Phys. Rev. Lett. 75 (1995) 798. -
[7]
C.P. Montoya, S. Schadmand, R. Varma, P.H. Zhang, R. Butsch,
I. Dioszégi, D.J. Hofman
and P. Paul, Nucl. Instr. and Meth. A334 (1993) 437. -
[8]
S. Schadmand, R. Varma, S.R. Banerjee, B.B. Back,
D.J. Hofman, C.P. Montoya, P. Paul,
J. Phys. G: Nucl. Part. Phys. 21 (1995) 8. -
[9]
S. Schadmand, R. Varma, S.R. Banerjee, B.B. Back,
D.J. Hofman, C.P. Montoya, P. Paul,
Nucl. Phys. A599 (1996) 89c. -
[10]
F. W. N. de Boer, R. van Dantzig, J. van Klinken,
K. Bethge, H. Bokemeyer, A. Buda,
K. A. Müller and K. Stiebing, J. Phys. G: Nucl. Part. Phys. 23 (1997) L85, Letter to the Editor. - [11] J.F. Gunion, H.E. Haber, G. Kane, S. Dawson, The Higgs Hunter’s Guide, Addison-Wesley, Redwood City, California, 1990, see also references therein.
- [12] Particle Data Group, C. Caso et al., Eur. Phys. Jour. C3 (1-4) (1998) 273.
-
[13]
E.M. Riordan, M.W. Krasny, K. Lang, P. de Barbaro.
A. Bodek, S. Dasu, N. Varelas, X. Wang, R. Arnold, D. Benton, P. Bosted,
L. Clogher, A. Lung, S. Rock, Z. Szalata, B.W. Filippone,
R.C. Walker, J.D. Bjorken, M. Crisler, A. Para, J. Lambert, J. Button-Shafer, B. Debebe,
M. Frodyma, R.S. Hicks, G.A. Peterson, R. Gearhart, Phys. Rev. Lett. 59 (1987) 755. - [14] M. Davier, H. N. Ngoc, Phys. Lett. B229 (1989) 150
- [15] A. Bross, M. Crisler, S. Pordes, J. Volk, S. Errede, J. Wrbanek, Phys. Rev. Lett. 67 (1991) 2942.
- [16] M. El-Nadi and O.E. Badawy, Phys. Rev. Lett. 61 (1988) 1271.
- [17] F.W.N. de Boer and R. van Dantzig, Phys. Rev. Lett. 61 (1988) 1274, see also Phys. Rev. Lett. 62 (1989) 2638 (comment of D.H. Perkins) and Phys. Rev. Lett. 62 (1988) 2639 (reply to comment).
- [18] O. Fröhlich, Untersuchung der -Paaremission aus hochenergetischen Kernübergängen auf die Signatur leichter neutralen Teilchen und die Einfluß der Kernorientierung, Ph. D. Thesis, University of Frankfurt, (IKF-D596) (1995).
-
[19]
F.W. N. de Boer, O. Fröhlich, K.E. Stiebing, K. Bethge,
H. Bokemeyer, A. Bałanda, A. Buda,
R. van Dantzig, Th. W. Elze, H. Folger, J. van Klinken, K.A.Müller, K. Stelzer, P. Thee and
M. Waldschmidt, Phys. Lett. B388 (1996) 235. -
[20]
F.W.N. de Boer, K. Bethge, H. Bokemeyer, R. van Dantzig,
J. van Klinken. K.A.Müller,
K.E. Stiebing, Nucl. Phys. B (Proc. Suppl.) 72 (1999) 189. - [21] F.W.N. de Boer, K. Bethge, H. Bokemeyer, R. van Dantzig, J. van Klinken. V. Mironov, K.A.Müller, K.E. Stiebing, J. Phys. G: Nucl. Part. Phys. 277 (2001) L29.
- [22] Application Software Group, CERN-CN Division, GEANT Users Manual, CERN Geneva, CERN Program Library, Long Writeup W50130 (1993).
- [23] G. Goldring, Proc. Phys. Soc. A66 (1953) 341.
- [24] M.E. Rose, G.E. Uhlenbeck, Phys. Rev. 48 (1935) 211.
- [25] M.E. Rose, Phys. Rev. 76 (1949) 678, see also Phys. Rev. 78 (1950) 184 (Erratum).
- [26] G. Soff, Z. Phys. A303 (1981) 189.
- [27] C. Hofmann, Elektron-Positron-Winkelkorrelation bei der Paarkonversion, University of Frankfurt, published as GSI report GSI-89-31 (1989).
- [28] C. Hofmann, J. Reinhardt, W. Greiner, P. Schlüter, G. Soff, Phys. Rev. C42 (1990) 2632.
-
[29]
C. Hofmann, Elektron-Positron-Winkelkorrelation bei der
Paarkonversion ausgerichteter Kerne in Schwerionenstößen, Vol 37 of
Reihe Physik, Verlag Harri Deutsch, Frankfurt/Main, 1995,
see also Ph.D. Thesis, unpublished, University of Frankfurt, 1994. - [30] R.J. Lombard, C.F. Perdrisat and J. H. Brunner, Nucl. Phys. A110 (1968) 41.
- [31] A. Borsellino, Phys. Rev. 89 (1953) 1023.
- [32] H. Olsen, Phys. Rev. 131 (1963) 406.
- [33] E.L. Hart, G. Cocconi, V.T. Cocconi, J.M. Sellen, Phys. Rev. 115 (1959) 678.
- [34] J. H. Hubbell, H. A. Gimm, I. Øverbø, J. Phys. Chem. Ref. Data, 9 (1980) 1023.
- [35] Yung-Su Tsai, Rev. Mod. Phys. 46 (1974) 815, see also Rev. Mod. Phys. 49 (1977) 421 (erratum).
- [36] W.J. Meiring, J. van Klinken and V. A. Wichers, Phys. Rev. A44 (1991) 2960.
-
[37]
G. Lambrinidis, K. E. Stiebing, K. A. Müller, O. Fröhlich,
G. Rüschmann, K. Bethge,
University of Frankfurt, Institut für Kernphysik, Annual Report 1992 (IKF-D 54), p.74 (1993). - [38] R. Armbruster, Annales de Physique 3 (1958) 89.
- [39] S. Devons, M.G.N. Hine, Proc. Roy. Soc. Lond. A199 (1949) 56.
- [40] S. Devons and G. Goldring, Proc. Phys. Soc. A67 (1954) 413.
- [41] F. Ajzenberger-Selove, Nucl. Phys. A413 (1984) 1.
- [42] T. Huus and R. B. Day, Phys. Rev. 91 (1953) 599.
- [43] L. Pages, E. Bertel, H. Joffre, L. Sklavenitis, Atomic Data 4 (1972) 1.
- [44] J. F. Janni, Atomic Data and Nuclear Tables 27 (1982) 147.
- [45] F.W.N de Boer, K. Bethge, H. Bokemeyer, M. Csatlös, Z. Gaczi, J. Gulyás, M. Hunyadi, A. Krasznahorkay, Z. Máté, H. Fraiquin, K.A. Müller, K.E. Stiebing and J. van Klinken, ATOMKI Annual Report 2002, p. 10-11; KVI Annual Report 2002, p. 22.