Surprises in the RHIC Data111For additional information see http://www.star.bnl.gov, http://www.phenix.bnl.gov, http://www.phobos.bnl.gov, and http://www.rhic.bnl.gov/brahms.
Abstract
The data from RHIC have produced many unanticipated results. I will describe a few of the surprises that occur in the soft spectra while my colleagues at this conference will summarize the hard spectra. One particularly important discovery is that properties of the initial state have an impact on the final state in relativistic heavy ion collisions. Another important discovery is that the collision zone is opaque to the passage of hadrons and perhaps even partons. And finally, the data tell us very precisely where the colliding systems hadronize on the phase diagram for nuclear matter.
1 Introduction
The Relativistic Heavy Ion Collider (RHIC) is located at Brookhaven National Laboratory on Long Island, New York. The collider is 3.83 km in circumference and it accelerates a variety of heavy ion beams; from Au to protons. The top energy is 100 GeV/amu per beam for Au ions and 250 GeV per beam for protons. The top collision energies are sNN = 200 GeV and spp = 500 GeV.
In this paper, I will summarize the results recorded in the soft spectra (pT 1 GeV) that were observed during the sNN = 130 and sNN = 200 GeV Au-Au runs at RHIC. There are many unanticipated results in these data and I will focus on those things that I have found to be surprising relative to our expectations when we started the construction of the accelerator.
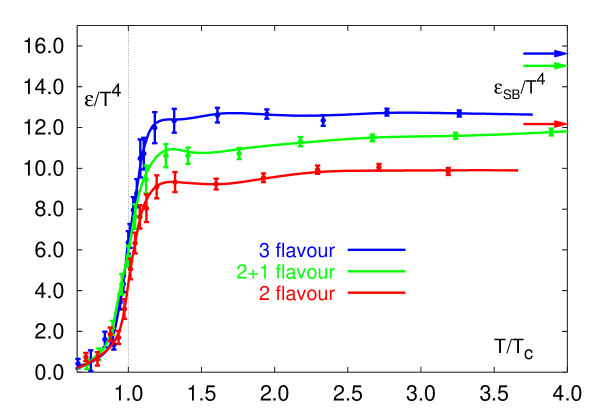
The motivation for building RHIC was to study nuclear matter under extreme conditions; at high temperature and at high density. Under these conditions, we expect quark and gluon degrees of freedom to become important and the underlying dynamics should change as the nuclear system makes the transition from cold matter to extremely hot and dense matter. In fact, it was predicted that nuclear matter will undergo a phase transition into a Quark Gluon Plasma (QGP) at a critical temperature near the rest mass of the pion and at about 10 times the density of normal nuclear matter. This scenario has been explored with lattice gauge calculations[1] and the calculations predict that there will be a large jump in the energy density for two and three flavor systems at a critical temperature, Tc, of about 160 MeV, see Figure 1. This prediction is remarkably stable with respect to changes in the underlying lattice technology and over time. The state of the art for lattice calculations is such that we do not know if the phase transition is first order, second order, or whether or not there is a tri-critical point on the phase diagram.
2 Surprises in the Soft Spectra at RHIC
The first surprise to be seen in the RHIC data is that the mean multiplicity of particles per event is large but not exceptionally large. The PHOBOS collaboration made the first determination[2],[3] of the maximum multiplicity in central collisions of Au ions at sNN = 130 GeV and they found a mean multiplicity of 4200 470 in the top 3% most central collisions. They have also measured the mean multiplicity at sNN = 56 GeV and at sNN = 200 GeV and, in general, the values do not suggest a large jump in the multiplicity of particles relative to the other energy points. Instead, the multiplicities change smoothly as a function of s and they are in fairly good agreement with the predictions of the HIJING model[4]. This is a bit of a surprise because HIJING was created to represent the jets and mini-jets that are formed in heavy ion collisions due to the interaction of the partons in the system. HIJING was not designed to be a complete model of relativistic heavy ion collisions. Models with more ambitious designs and which include a detailed description of the final state, such as RQMD and UrQMD[5], are not very successful at describing the multiplicity of particles and their rapidity distributions at RHIC.
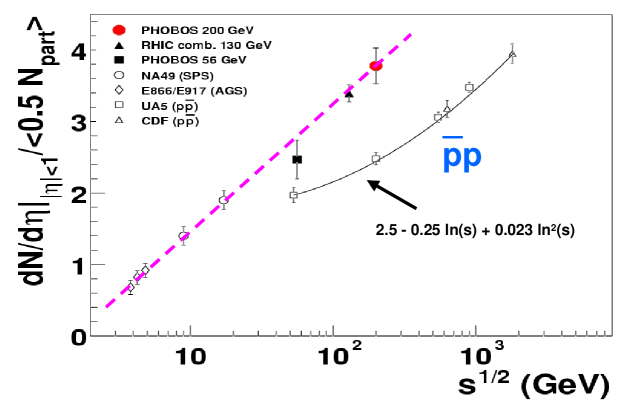
A better description of particle multiplicities was first given by Kharzeev and Nardi[6] and by Kharzeev and Levin[7]. Their theme, however, is that the particle multiplicities are determined by the properties of the incoming state and not by the dynamics of the final state. They and their collaborators have proposed that the gluon spectrum in the incoming state is modified by the Lorentz contraction of the nucleus and the running of the coupling constant so that the interaction becomes coherent at RHIC energies and the gluon interaction cross-section saturates (i.e. = 1.0). This gives rise to a s dependent gluon spectrum that evolves slowly and it gets harder as s increases. The increase can be predicted and translated into particle yield as a function of the number of participating nucleons[6] or the center of mass energy of the collisions[7]. See Figure 2.
Another observation due to the initial state saturation model of Kharzeev and Nardi is that the production of particles increases more rapidly than participant scaling. They claim that RHIC multiplicity data suggest an admixture of soft and hard collisions and that about 15% of the collisions are hard binary collisions. The trend in the data is consistent with their initial state saturation model and inconsistent with most final state saturation models. The same trend can be seen in the measurements of the total transverse energy in Au-Au collisions; ET increases more rapidly than the number of participating nucleons and requires a 20% admixture of hard binary collisions to explain the data. This ratio is consistent, within errors, with the ratio derived from the multiplicity data.
The total transverse energy per rapidity interval can be used to estimate the thermalized energy density in the collision zone via Bjorken’s formula:
| (1) |
is the time required to thermalize the system and we take it to be 1 fm/c, although it is probably smaller. R is the radius of the Au nucleus, and dET/dy is taken from measurements. Using the measurements by the PHENIX collaboration[8] it is easy to show that energy density is at least 4.6 GeV/fm3 at RHIC which is 30 times higher than normal nuclear matter densities and 1.5 to 2 times higher than achieved at any other accelerator.
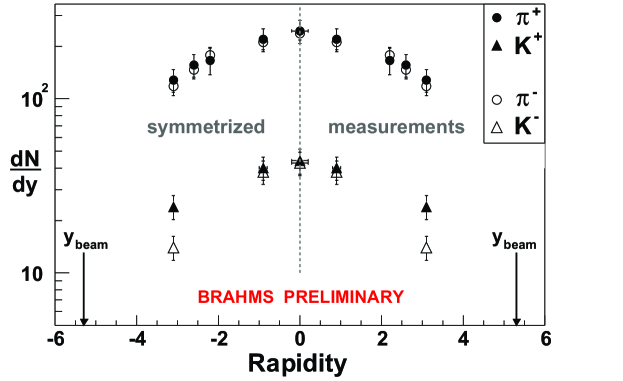
Bjorken hypothesized that the collision zone is boost invariant in order to derive equation 1. However, this turns out not to be true. Boost invariance is approximately valid to within 2 units of rapidity, as can be seen in Fig. 3, but then boost invariance is incomplete at higher rapidities. The Brahms collaboration[9] has measured many species of identified particles over a wide range of rapidities and it appears that boost invariance holding out to 2 units is a fairly universal feature and it is independent of particle ID. The observation of incomplete boost invariance is a surprise relative to our early hypotheses but in retrospect it was not unexpected. The early hypotheses were deliberately simplistic and heavy ion reactions are rich and complex with a large diversity of features.
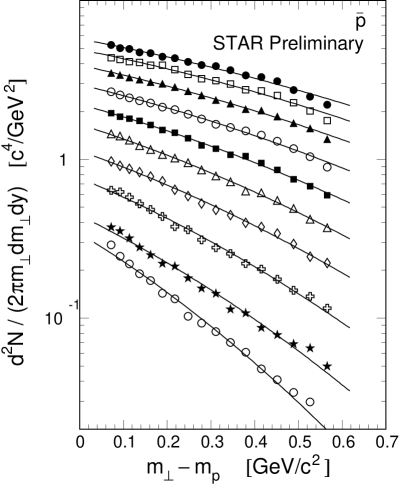
The complexity of heavy ion reactions is shown clearly by the spectrum of particles that are observed at RHIC. Fig. 4 shows an anti-proton spectrum which was observed by the STAR collaboration[10]. The spectrum is not the Maxwell Boltzman distribution you would expect for massless particles because the mass of the particles alter the kinematics of the radial expansion of the fireball that is created in a collision. In the limited range of mT-m0 shown in the figure, the best fit to the spectrum is a Gaussian. Knowing the effective shape of the spectrum is important because we can’t measure the yield of particles everywhere and we need to extrapolate the yields into the unmeasured corners of parameter space in order to estimate the total cross-section.
A huge number or spectra have been recorded at RHIC. What can we do with them? One interesting exercise is to compare the ratio of particles to anti-particles. The STAR collaboration has measured[11] the p̄/p ratio at sNN = 20 GeV, 130 GeV, and 200 GeV. The ratios are 0.11, 0.71, and 0.80 respectively or, in other words, the ratio approaches unity as s increases. And since the anti-particle to particle ratio in the early universe was 1.0, RHIC collisions are in some way similar to and approaching the conditions in the early universe.
One explanation for the high yield of anti-particles in Au-Au collisions is that they were produced by pair production. It is easy to show that the anti-particle to particle ratio of 0.8 quoted above suggests that 80% of the protons were produced by pair production and 20% were carried in by the beam. It also means that the mid-rapidity region is not baryon free. This is an important observation because many of the early models of heavy ion collisions disagreed on the net-baryon number at mid-rapidity and these observations helped weed out the unsatisfactory models.
Another interesting exercise is to compare the ratio of produced particles to the predictions of a thermally and chemically equilibrated fireball model. This has been done by many authors[12], but one previously published piece of work was recently updated by D. Magestro[13] at QM2002 to include the most recent 200 GeV data from RHIC. See Fig. 5. He showed that the data are consistent with a baryon chemical potential of 29 6 MeV and a temperature for chemical freezeout of 177 7 MeV. Chemical freeze-out marks the end of inelastic collisions in a fireball. These numbers are modestly different than the values derived from the 130 GeV data at RHIC where 40 MeV and T 175 MeV and they are substantially different than the values at the SPS where 270 MeV and T 165 MeV. The trend is for the chemical potential to decrease as a function of s while Tch increases to an asymptotic value of about 175 MeV. This trend was recognized in the low energy data by Cleymans and Redlich[14] and it continues to be true at RHIC energies. And for whatever it might mean, the asymptotic temperature for chemical freezeout is remarkably close to the phase transition energy predicted[1],[15] by lattice QCD with 2 flavors.
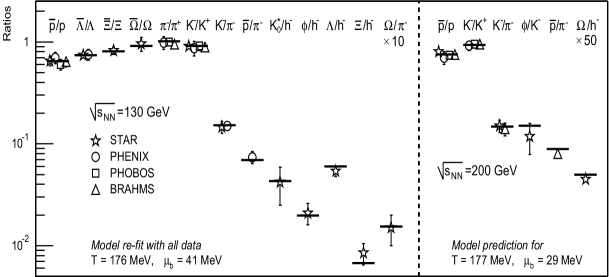
These results tell us very precisely where we are on the phase diagram for nuclear matter at the time of hadronization. Since we know where we are, the challenge to the theorists is to predict what else might be on the phase diagram such as the location of a tri-critical point or another feature that is not directly accessible by experiment.
There is another important temperature parameter that we can measure and it is the temperature that marks the end of elastic collisions, Tkinetic. It is lower than the temperature for chemical freeze-out, and below this temperature the particle momenta are frozen and thereafter the composition and the kinetic energy of the final state is well defined. Tkinetic can be estimated from the inverse slopes of the transverse momentum spectra shown in Fig. 4 because, in general, all particles are undergoing transverse radial expansion with the same expansion velocity distribution and because the mass of the particles affect the shape of the spectra due to the different kinetic energies involved in their propagation. The more massive particles have a larger inverse slope which is equivalent to saying that they have a higher effective temperature. The data have been analyzed to show that there is a universal freeze-out temperature for all particles at RHIC and it is approximately 100 MeV[16]. The radially expanding shock wave travels at an average velocity of 55% to 60% of the speed of light and the leading edge travels even faster (assuming a linear velocity profile). This suggests that there is explosive transverse expansion of hadronic matter after a RHIC collision and this rapid expansion generates very high pressure gradients inside the collision zone.
One consequence of the large pressure gradients is that the emission pattern of final state particles in the transverse plane is not isotropic. It comes about because the initial state has a well defined anisotropy in coordinate space due to the almond shape of the overlap zone when two spherical heavy ions collide with non-zero impact parameter. The anistropy in coordinate space can carry over to the momentum distribution of the final state particles if the constituents interact early in the collision history. These interactions build the pressure gradients that drive the flow of particles in the final state. (Or perhaps the converse is more obvious: if there are no interactions amongst the initial state constituents then the emerging pattern of final state particles will be azimuthially isotropic. So interactions early in the collision history are required if the final state particle distributions are observed to be anisotropic.) See Fig. 6.
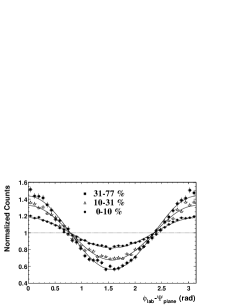
Figures 6 and 7 illustrate the anisotropy of particles in the transverse plane. This is sometimes called “elliptic flow”. The magnitude of the anisotropy, as measured by the 2nd Fourier coefficient v2, is large. It is biggest in peripheral collisions[18] (i.e. large impact parameter) and it decreases as the impact parameter decreases. The data are in very good agreement with the predictions of several hydrodynamical models[19],[20] and this is worth noting because the models assume thermodynamic equilibrium at early times followed by hydrodynamic expansion; so thermodynamic equilibrium is not inconsistent with the data we see at RHIC.
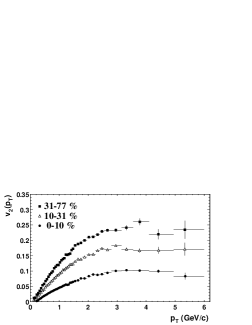
A surprising feature of the RHIC data is that the magnitude of the flow signal does not decrease at high pT although we expect it to decrease as more and more energetic particles pop out of the collision zone. We observe that the magnitude of the elliptic flow is constant to the highest pT which we can measure (12 GeV)[21] and this suggests that there are unusual energy loss mechanisms that cause even the most energetic particles to interact at early times in the collision history.
The large amount of elliptic flow suggests that the collision zone is not transparent to the passage of hadrons and partons. There is additional evidence for this lack of transparency, or opacity, and it comes from the analysis of Hanbury-Brown-Twiss correlations.
HBT is a method for observing pairs of particles and the correlations in the spectra can reveal the size of the source that is emitting the particles. The quickest explanation of the technique is to say that pions undergo Bose condensation at the point of creation and the resulting correlations in phase space cause the pions to be correlated in coordinate space before and after thermal freeze-out. It will turn out that the Fourier transform of the momentum correlation is related to the radius of the source. The usual coordinate system for HBT analysis is Rlong, Rout, and Rside. It is a pair by pair and event by event coordinate system. See Fig. 8. Rlong is the radius of the source in the direction of the Z axis (usually chosen to lie along the beam direction). In our example, Rlong goes into the page. Rout is the radius of the source in the direction of the summed momentum of the pair, KT. Rsideis the radius of the source in the direction transverse to both the Z axis and KT. Rsideis the parameter most easily related to the geometry of the collision zone. It is relativistically invariant and it represents the geometric radius of the system in the transverse plane (neglecting flow effects). Rout is more complex and it involves the geometric radius of the system as well as the relative velocity and time of emission of the two particles because the particles will be further separated in space at the detector if the velocities and times aren’t identical when they are produced.
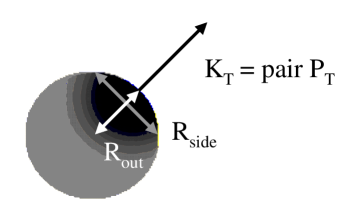
Figure 9 shows a summary of the data for several experiments at the AGS, the SPS, and at RHIC. In general, Rlong, Rout, and Rside are very similar at all energies however a careful study will reveal that Rlong evolves slowly as a function of sNN and there are no unusual changes in Rside and Rout at RHIC energies. These later two radii are essentially the same at all energies.
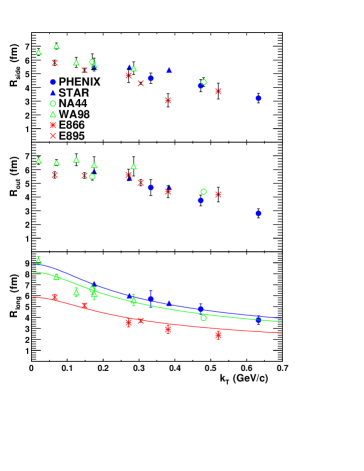
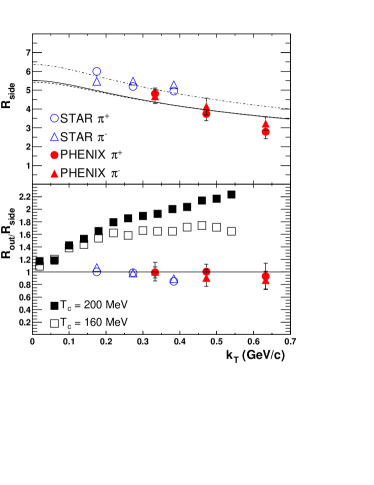
The conventional wisdom (before RHIC) was that the entire collision zone would emit particles and Rside would measure the geometric radius of the collision zone. In this scenario, Rout is always greater than Rside because R R where is the duration of particle emission. We expected the ratio of Rout/Rside to be greater than one, and perhaps much larger than one, due to the long delay in forming particles as the system loses entropy after an energetic collision.
This has not turned out to be the case at RHIC. Rout/Rside is 1.0 and the ratio is constant, or falling, as a function of kT[22],[23]. See Fig. 10. This was a surprise and it has been named “the HBT puzzle”. A possible explanation for this observation is that the collision zone is opaque and the full depth of the collision zone can’t emit particles that reach the detectors. Instead, only a restricted zone near the surface actually emits particles in the direction normal to the surface and this allows Rout to be very thin, indeed. This interpretation is suggested by the darker shading and by the length of the arrows in Fig. 8.
The diagram in Fig. 8 is more than a sketch. It is a calculation of the where the pions are emitted according to the Blast Wave Model[24]. The Blast Wave is a hydro inspired model that attempts to describe the particle spectra at RHIC including the shape and mass dependence of the spectra, it describes radial and elliptic flow, and it describes HBT. It is not a fundamental theory, it is an effective theory, but it was discovered that the model needs a parameter to define the size of the transparent sector of the collision zone and this parameter must be less than the full radius of the source in order to properly describe all of the available data.
3 Summary
Nuclear matter at RHIC is very surprising. It is hot, its fast, its opaque and yet its properties still remain consistent with thermodynamic equilibrium. Inelastic collisions freeze-out at a temperature of 175 MeV. Elastic collisions freeze-out at a temperature of 100 MeV. In addition, the radially expanding shock front that is produced by heavy ion collisions is traveling at more than 55% of the speed of light. There are large amounts of anisotropic transverse flow in the collision zone. This suggests that the system is undergoing hydrodynamic expansion due to very high pressure gradients developed early in the collision history. Finally, the collision zone is not fully transparent and this disrupts HBT correlations and, as you will see in other talks in these proceedings, the lack of transparency implied by these results extends to high pT phenomena as well.
References
- [1] F. Karsch, Lect. Notes Phys. 583, 209 (2002) and hep-lat/0106019.
- [2] B.B. Back et al., Phys. Rev. Lett., 85, 3100 (2000).
- [3] B.B. Back et al., Phys. Rev. Lett., 88, 22303 (2002).
- [4] X.N. Wang and M. Gyulassy, Phys. Rev. Lett., 86, 3496 (2001).
- [5] S.A. Bass et al., Prog. Part. Nucl. Phys. 41, 255 (1998).
- [6] D. Kharzeev and M. Nardi, Phys. Lett. B507, 121 (2001).
- [7] D. Kharzeev and E. Levin, Phys. Lett. B523, 79 (2001).
- [8] K. Adcox et al., Phys. Rev. Lett., 87, 052301-1 (2001).
- [9] D. Ouerdane, Quark Matter 02, Nucl. Phys. A715, (2003).
- [10] O. Baranakova and F.Q. Wang, Nucl. Phys. A715, 458c (2003).
- [11] D. Cebra, Poster presented at Quark Matter 02, Nantes (2002).
- [12] P. Braun-Munzinger et al., Phys. Lett. B518, 41 (2001).
- [13] D. Magestro, Poster presented at Quark Matter 02, Nantes (2002).
- [14] J. Cleymans and K. Redlich, Phys. Rev. Lett., 81, 5284 (1998).
- [15] F. Karsch, Nucl. Phys. A698, 199 (2002).
- [16] M. Kaneta, Poster presented at Quark Matter 02, Nantes (2002).
- [17] C. Adler et al., Phys. Rev. Lett., 90, 032301 (2003).
- [18] K.H. Ackerman et al., Phys. Rev. Lett., 86, 402 (2001).
- [19] D. Teaney et al., Nucl. Phys. A698, 479c (2002).
- [20] P. Huovinen et al., Nucl. Phys. A698, 475c (2002).
- [21] K. Filimonov et al., Nucl. Phys. A715, 737c (2003).
- [22] C. Adler et al., Phys. Rev. Lett, 87, 082301-1 (2001).
- [23] K. Adcox et al., Phys. Rev. Lett., 88, 192302 (2002).
- [24] M. Lisa and F. Retiere, to be published.