Measurement of \nuc222Rn dissolved in water
at the Sudbury Neutrino Observatory
Abstract
The technique used at the Sudbury Neutrino Observatory (SNO) to measure the concentration of \nuc222Rn in water is described. Water from the SNO detector is passed through a vacuum degasser (in the light water system) or a membrane contact degasser (in the heavy water system) where dissolved gases, including radon, are liberated. The degasser is connected to a vacuum system which collects the radon on a cold trap and removes most other gases, such as water vapor and N2. After roughly 0.5 tonnes of H2O or 6 tonnes of D2O have been sampled, the accumulated radon is transferred to a Lucas cell. The cell is mounted on a photomultiplier tube which detects the -particles from the decay of \nuc222Rn and its progeny. The overall degassing and concentration efficiency is about 38% and the single- counting efficiency is approximately 75%. The sensitivity of the radon assay system for D2O is equivalent to 3 g U/g water. The radon concentration in both the H2O and D2O is sufficiently low that the rate of background events from U-chain elements is a small fraction of the interaction rate of solar neutrinos by the neutral current reaction.
keywords:
radioactivity assay \sepsolar neutrino \sepSNO \sepradon \PACS29.50.-n \sep26.65.+t, , , , , , , , , , , , ††thanks: Deceased. , , , , , , , ,∗, \corauthCorresponding author. Present address: Department of Physics and Astronomy, Indiana University South Bend, South Bend, Indiana 46634, USA. , , , , , , , , , , , , , , , and
1 Introduction
The Sudbury Neutrino Observatory (SNO) is a heavy water Cherenkov detector which was built to understand why all previous solar neutrino experiments [1, 2, 3, 4, 5, 6] have observed fewer neutrinos than are predicted by generally accepted solar models [7, 8].
The SNO detector is described in detail elsewhere [9]. Briefly, SNO consists of an inner neutrino target of 1000 tonnes of ultra-pure D2O contained in a 12 m diameter spherical, transparent, acrylic vessel. An array of 9438 photomultiplier tubes, mounted on an 18 m diameter stainless steel geodesic support structure, detect the Cherenkov light from electrons produced by neutrino interactions in the D2O. The volume between the acrylic vessel and the tube support structure contains approximately 1700 tonnes of ultra-pure H2O which shields the D2O volume from high-energy rays produced by radioactivity in the outer regions of the detector.
Outside the photomultipliers lie an additional 5700 tonnes of H2O shielding. The two water shielding regions are separated by a nearly impermeable water seal which serves to keep the water in the outer shielding area, which has higher radon levels, isolated from the water between the photomultipliers and the acrylic vessel, where the radon level is lower. The external water shielding region is viewed by 91 outward-looking photomultiplier tubes which help to reject background from muons traversing the detector. The detector is situated in the INCO, Ltd. Creighton mine, in Sudbury, Ontario, Canada. At a depth of 6800 feet, only about 70 muons interact in the detector per day.
SNO detects solar neutrinos through three distinguishable interactions with the D2O target:
| (CC), | ||||
| (NC), | ||||
| (ES), |
where denotes any of the active neutrino species . The CC reaction is only sensitive to the flux of electron neutrinos, whereas the NC reaction is equally sensitive to all active neutrino flavors. Three techniques have been developed to observe the neutrons from the NC reaction in SNO. In the first phase of the experiment, the inner vessel was filled with pure D2O. The neutrons were captured by deuterium nuclei creating 6.25-MeV rays which interacted to make relativistic electrons whose Cherenkov light was detected. In the second phase, NaCl was added to the D2O. Most neutrons then capture on 35Cl, an exothermic reaction that yields photons whose energies sum to 8.6 MeV. In the third phase, the salt will be removed and neutrons will be detected with low-background 3He-filled counters that will be installed in the D2O.
The first publication [10] of SNO results indicated that the flux of electron neutrinos with energy 6.75 MeV inferred from the CC reaction is not as large as the total rate inferred from the ES reaction as measured by SNO, or with greater accuracy, by Super-Kamiokande [5]. Since the ES reaction is mostly sensitive to the flux of electron neutrinos, but has a small contribution from the flux of other neutrino flavors, this implies that the flux of active neutrinos from the Sun is greater than the observed flux of electron neutrinos alone. As only electron neutrinos are produced in the Sun, this observation is evidence that electron neutrinos have transformed into some combination of and neutrinos by the time they reach the detector.
A much higher precision measurement of this phenomenon was obtained by a comparison at energies 5 MeV of the CC and NC rates in the SNO detector [11] and their temporal variations [12]. To make this comparison required that the radioactive backgrounds in the detector were well understood, since decays of progeny of 238U (“U-chain”) and progeny of 232Th (“Th-chain”) can mimic the neutrino interactions. The isotopes of most concern for the CC/NC comparison are \nuc214Bi in the U-chain and \nuc208Tl in the Th-chain because their decays can produce rays with energies greater than 2.2 MeV. These high-energy rays can photodisintegrate the deuteron, producing a free neutron, and thus mimic the NC disintegration of the deuteron.
Two techniques, which are discussed elsewhere [13, 14], have been developed to measure the aqueous concentration of 226Ra from the U-chain and 224Ra from the Th-chain. These give a good measurement of the concentration of radium ions in the water. Knowledge of the 226Ra concentration is, however, not sufficient to determine the U-chain radioactive background because 222Rn, the decay product of 226Ra, is a noble gas with a 3.8-d half-life. Small leaks of air and traces of radium in detector materials can introduce 222Rn, and lead to significant disequilibria between 226Ra and 214Bi. To properly understand the radioactive background, it is thus imperative to measure directly the 222Rn concentration in the water as only isotopes with short half-lives separate \nuc222Rn from the undesired 214Bi.
The underground air at the SNO laboratory contains 100 Bq/m3 of \nuc222Rn (3 pCi/l or 50 Rn atoms/cm3), which, if the radon were at its equilibrium concentration with the D2O, would yield a dissolved \nuc222Rn level almost times higher than tolerable. Considerable precautions were thus taken in the design and construction of SNO to limit the leakage of \nuc222Rn into the detector. As examples of such measures, all components of the water systems were selected for low radon diffusion and emanation, the entire D2O system was leak checked with a He mass spectrometer, and one of the final elements of both the H2O and D2O water purification systems is a degasser that has a radon removal efficiency of 90%. Further, the polypropylene pipes in the water system have thick walls and are made with specially selected low-radioactivity material [15], all detachable joints are sealed with butyl rubber O-rings [16] which have low radon permeability and emanation, the detector cavity is lined with a membrane with low Rn permeability, and there is a “cover gas”, a continuously flowing stream of N2 from the boiloff of liquid nitrogen, into the vapor space directly above the D2O and H2O.
2 Maximum allowable radon concentration
The standard model calculation of the 8B neutrino flux from the Sun [7], together with the cross section for the NC reaction [17], predicts that 10 to 15 neutrons will be produced by solar neutrinos per day in the 1000 tonnes of D2O in the SNO detector. Based on this prediction, SNO set the design goal to have no more than one neutron per day produced in the D2O by U-chain contamination. As described in [14], this implies that the maximum allowable contamination of the D2O is g U/g D2O, assuming secular equilibrium between 238U and 214Bi. This can be translated into a maximum concentration for 222Rn in the D2O of about 0.2 atoms/liter or 0.4 mBq/m3. The maximum allowable radon concentrations in the H2O between the acrylic vessel and the photomultipliers and in the outer bulk shielding water are given in Table 1. At these levels, the background contributed by H2O to the NC signal is no more than that from the D2O.
| Region | Atoms Rn/liter | mBq Rn/m3 | g U/g water |
|---|---|---|---|
| D2O | |||
| H2O (I) | |||
| H2O (O) |
To reduce the systematic error in the NC determination that arises from the uncertainty in the radon level to less than a few percent, it is necessary to lower the radon content of the water below the maximum allowable level. Such levels can only be measured with accuracy if the ultimate sensitivity of the assay method is an order of magnitude below the design goal. As shown below, these requirements were met, thus allowing the critical neutral current measurement to be made with precision.
3 Assay of the H2O
3.1 Overview of the assay technique
The assay method operates by pumping water from the detector to a degasser which extracts the radon. The radon is collected, concentrated, and then transferred to a miniature ZnS-coated scintillation counter (a Lucas cell [18]) for measurement. The extraction of radon is performed differently in the H2O and D2O systems; we describe the extraction from H2O here and from D2O in Sec. 4. The radon collection and counting are the same in both systems and are discussed in Sec. 5 and Sec. 6, respectively.
3.2 Water flow
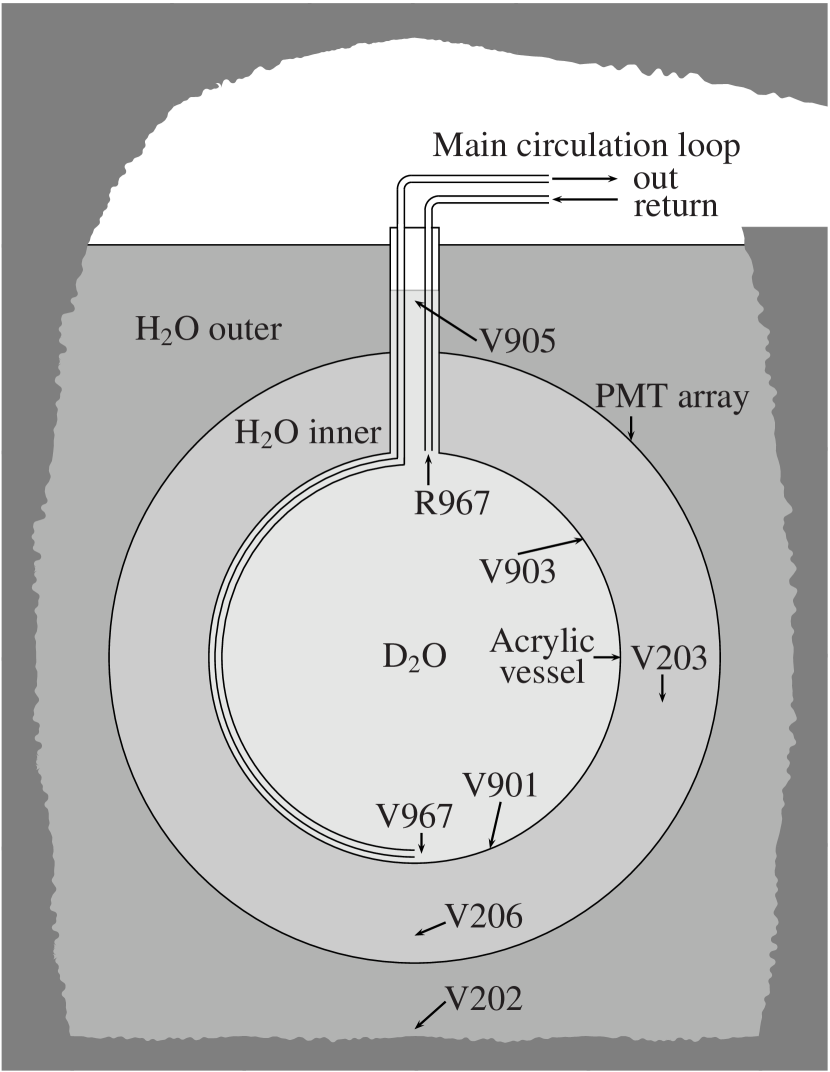
H2O can be drawn from six locations in the detector. Two sample points are at the bottom of the cavity, three at the equator of the acrylic vessel, and one at the bottom of the photomultiplier array. The most commonly sampled H2O and D2O positions are shown in Fig. 1. The distance from the sample points to the degasser is about 70 m and the piping is polypropylene with 60 mm outer diameter and 5.5 mm wall thickness. Polypropylene was chosen for its low radioactivity, low leaching of impurities in the presence of ultra-pure water, and low radon permeability. The water sample is taken by a diaphragm pump [19] whose wetted portions are made from polypropylene, except for the diaphragm which is Teflon. A typical assay samples water for 30 minutes at a flow rate of 19 liters/minute. At the maximum allowable contamination of the H2O between the acrylic vessel and the photomultipliers ( g U/g H2O), this water would contain 1480 222Rn atoms. The water goes through a vacuum-degassing chamber and is returned to the main H2O circulation system by another diaphragm pump.
The volume of water is measured with either a rotameter flowmeter or a stroke counter attached to the diaphragm pump. The volume per stroke is 0.34 liters, and is independent of flow rate over the range of flows normally used. Both of these were calibrated by flowing water from the pump to a container on a scale. One of the larger sources of systematic uncertainty is the difficulty of accurately measuring the water flow rate from the pulsating diaphragm pump. The estimated uncertainty is 14% in the flowmeter readings and 10% in the stroke-counted readings.
3.3 The light water monitor degasser
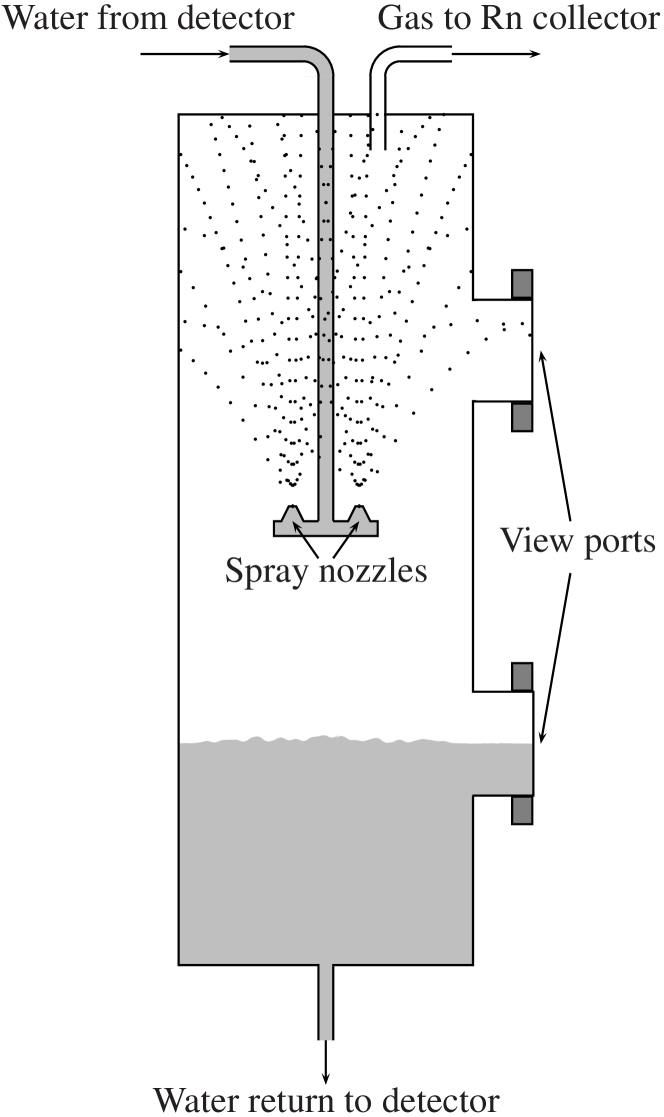
The monitor degasser (MDG) [20, 21, 22] is shown in Fig. 2. It is a custom-designed stainless steel vertical cylinder 1.15 m high and 0.4 m in diameter [23]. The usual pressure difference between the feed water line and the degassing chamber is 45 PSI. The water enters at the top of the degasser at a temperature of 13C and passes through three stainless-steel full-cone spray nozzles [24]. The nozzles spray upwards and produce water droplets with a diameter of 1 mm. As the drops fall, or run down the walls of the degasser chamber, the dissolved gases leave the water and are drawn off to the radon collector described in Sec. 5. The spray and the water level are visible through two acrylic view ports mounted on flanges welded to the side of the vessel. The water level in the bottom of the degasser is maintained at a height of 0.3 m.
The degassing efficiency of the MDG was measured by bringing a small volume of water into equilibrium with radon in the air of the underground laboratory, injecting this radon-enriched water into the input of the MDG, and then extracting, concentrating, and counting the radon. The number of detected radon atoms was compared to the number expected based upon the radon solubility, the known radon activity in the air (measured by introducing a different sample of the same air into an evacuated Lucas cell and counting its activity), and the known efficiencies of collection and concentration. With H2O at 13C and a flow rate of 19 liters/minute the degassing efficiency was measured to be [25].
3.4 Assay system background
Although the materials in the assay system were selected for their low diffusion and emanation rates for radon [26], some radon can still enter the water being assayed through leaks, by diffusion through pipes, O-rings, etc., by emanation from contaminants in assay system components, and by emanation from surface dust, embedded dirt, etc.
The background of the degasser was measured by filling the MDG with water and flowing this water in “closed loop mode” (which sends the output water of the degasser back to its input) until it was completely degassed. Then several assays of the degassed water were conducted, each of 3-hour duration, at a flow rate of 20 liters/minute. In these experiments atoms of radon entered the system per hour of assay by the combination of leakage, diffusion, and emanation. For a typical 30-min assay this represents a background of 1.1% of the number of atoms that would be extracted and collected if the water were at the maximum allowable level. These measurements, however, were only of the MDG and the subsequent radon collection apparatus and did not include the assay system piping that leads to the detector. Furthermore, the background can change as a function of time. For instance, we find that vibrations may loosen the nuts on valves and flanges, for which we must compensate by periodic tightening. Thus, the background for any given assay may be higher than measured in these closed loop assays, where great care was taken to ensure that the system was tightly sealed. To take account of these additional sources of background, some of which may vary in time, we add onto the previously stated statistical error of atoms/hr an additional systematic error, which we estimate to be atoms/hr. The total assay system background is thus atoms/hr.
4 Assay of the D2O
The basic principles of the assay system for D2O are very similar to those for H2O, namely, degassing followed by radon collection, concentration, and counting. The D2O system, however, must be an order of magnitude more sensitive than the H2O system (see Table 1), be able to function in 0.2% NaCl-D2O brine, and, since the D2O is so valuable, have minimal loss of D2O vapor. For these reasons a polypropylene hydrophobic-membrane contact degasser was chosen, rather than a metal vacuum degasser. The system design and calibration is described in more detail in [27].
4.1 Water flow
The D2O can be assayed from seven locations in the detector as well as at points within the water purification system itself. The most commonly sampled points are labeled in Fig. 1. There are five assay positions within the D2O on the acrylic vessel wall: at the bottom of the vessel (V901), 1/3 of the way up (not shown), 3/4 of the way up (V903), at the bottom of the neck (not shown), and 0.3 m below the surface of the water in the neck (V905). In addition, the water from the main purification circulation loop can be sampled either at the bottom of the neck (R967) or at the bottom of the vessel (V967). The pipes within the vessel are made from the same acrylic as the vessel itself; outside the vessel the pipes are polypropylene, as in the H2O system. For the dedicated assay lines, a diaphragm pump identical to that used in the H2O system draws water from the vessel to the D2O degasser.
A typical assay samples water for 5 hours at 21 liters/min. At the maximum allowable level this water contains about 1260 \nuc222Rn atoms, which, taking into account the degassing efficiency and transfer efficiency, results in 480 atoms in the Lucas cell at the end of an assay. Since the single- counting efficiency is 74% and 3 prompt alphas are emitted per radon decay (see Sec. 6.1.1), this gives about 180 events in the first day of counting. This should be compared with the typical Lucas cell background rate of about 10 counts/d, and the background from the assay system, which contributes about 20 counts in the first day of counting. Defining the sensitivity as when the signal equals approximately three times the uncertainty of the background [28], the sensitivity of the entire D2O assay system in the current configuration is about one-tenth of the maximum allowable level, or about g U/g D2O.
There is no flow meter in the D2O radon assay system. Rather, the flow rate is set by adjusting the pump stroke rate to a fixed value. Since the D2O system uses the same type of diaphragm pump as the H2O system, we use its calibration, whose uncertainty is 10%. There may, however, be small differences in any two pumps believed to be identical, and thus we add in quadrature an assumed 5% uncertainty, giving a total flow rate uncertainty in stroke-counted experiments of 11%. Some assays were conducted before the installation of the stroke counter; for these we estimate a 17% uncertainty in the flow rate.
4.2 The heavy water monitor degasser
The MDG in the D2O system is a membrane contact degasser [29]. It consists of bundles of hollow, porous, hydrophobic polypropylene fibers woven around a hollow polypropylene water distribution tube, all of which is contained in a polypropylene housing. The distribution tube is plugged at the center, and a baffle in the containment cartridge forces the water to flow to the outside of the cartridge and pass over the tightly packed fibers. As the water flows over the fibers, the dissolved gases pass through the fiber walls to their hollow center from which a vacuum pump draws the gases into a radon collection system similar to that in the H2O system. The water, on the other side of the baffle, goes back to the central water tube, exits the degasser, and is returned to the main D2O purification system.
The degassing efficiency of the D2O MDG for radon has not been measured directly, but we can infer its efficiency from other experiments. By measuring the radon concentration of the water that enters and exits the D2O process degasser, its efficiency was found to be at a flow rate of 195 liters/min. The process degasser contains two parallel sets of three membrane degassers in series where each degasser is of identical construction to the one in the MDG, so the inferred efficiency of a single degasser cell for radon is at 97.5 liters/min. This flow rate is much higher than the rate through the MDG which is customarily 21 liters/min. To extrapolate to lower flow rate, we can use an approximate membrane degasser model [30] which predicts that the efficiency varies with flow rate as where depends on degasser module geometry but is independent of gas species. The value of can be found for our degasser by applying this equation to measurements of the oxygen degassing efficiency of the process degasser at different flow rates. A probe [31] with ppb sensitivity in high resistivity liquids such as ultra-pure D2O was used, and the measured oxygen degassing efficiency of one cell of the process degasser was at 21 liters/min and at 97.5 liters/min. From these measurements we infer , and, using the measured radon efficiency at 97.5 liters/min, the predicted degassing efficiency of the MDG for radon is 62% at 21 liters/min. Since several assumptions are involved in this model which may not be completely satisfied, such as independence of the degassing efficiency on the gas concentration, we assign a liberal systematic uncertainty to this estimate. The upper limit is set by noting that the efficiency for radon can be no more than that for oxygen at the same flow rate, i.e., it must be less than 84%. A firm lower bound for the radon degassing efficiency at 21 liters/min is at 45% as that was the measured efficiency at 97.5 liters/min. We consider these extreme bounds to be effective two sigma uncertainties. Our estimate for the radon degassing efficiency of the D2O MDG is thus .
4.3 Assay system background
The emanation and leak background of the MDG and radon collector were measured under static conditions [27] as follows: The MDG and collector were sealed and their helium leak rate was measured to be less than cm3/s. Then the system was evacuated and isolated for as long as 11 days, at the end of which the gas in each evacuated component was individually collected and counted. The most significant background was Rn atoms/hr and came from the trap used to remove water vapor from the gas stream (see Fig. 3). The only other appreciable background was from the degasser portion of the system which contributed \nuc222Rn atoms/hr. Adding these two components gives a total assay system background of \nuc222Rn atoms/hr, which, for a typical assay time of 5 hours, gives a background of \nuc222Rn atoms on the collection trap at the end of the assay. This is much less than the 780 atoms that would be collected on the trap from the water if it were at the maximum allowable level.
The concerns regarding possible changes in background with time that were expressed for the H2O system also pertain here. To account for such time-dependent changes in the background, we add, as for the H2O system, a systematic uncertainty of atoms/hr, which makes the total assay system background atoms/hr.
5 The radon collector
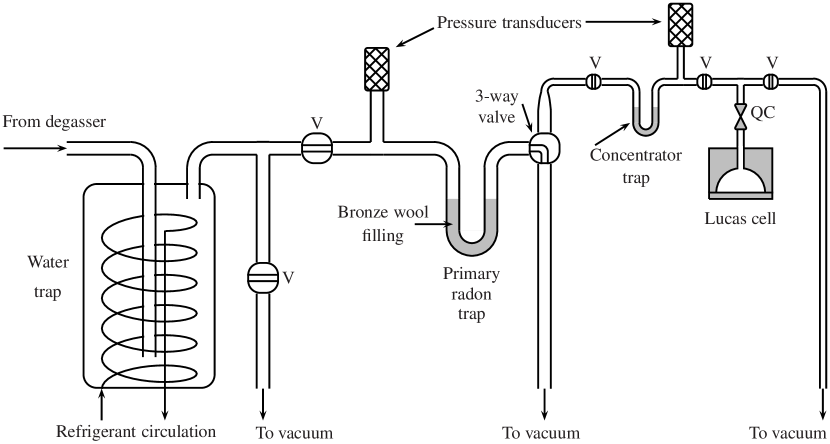
We describe here how the radon that is extracted from the water by the monitor degasser is collected, separated from other gases, and concentrated. The equipment used for this purpose is nearly the same in both the H2O and D2O systems and is illustrated in Fig. 3. It is based on apparatus developed to measure radon emanation for materials selection during the SNO design phase [26].
In overview, the gases extracted from the water are first drawn by a vacuum pump through a cold trap which removes water vapor. The gas stream then flows through a liquid nitrogen cooled trap filled with bronze wool which stops radon, but allows N2 and O2 to pass through. At the end of the sampling period the captured radon is transferred to a concentrator trap and then to a specially-developed low-background Lucas cell. These various components and their use in an assay will now be described.
5.1 Collector components and use
The gas stream first enters a water vapor trap [32]. In the H2O system, where the vapor load is about 10 cm3/min, the trap is an acrylic cylinder with a volume of 42 liters inside of which is a refrigeration coil. The coil is held at -60C during an extraction. The D2O system has a similar device but it is smaller as the vapor load is less by about a factor of 10.
After passing through the water trap, the dry gas enters the primary radon trap which consists of a 10 mm diameter stainless steel tube stuffed with cleaned bronze wool and bent into a ‘U’ shape. This tube, whose volume is 50 cm3, is immersed in liquid nitrogen during the extraction. N2, O2, and Ar in the gas stream go through this trap, but radon, CO2 and any residual water vapor adhere to the cold bronze wool. When a sufficient sampling time has elapsed, the valve at the inlet to the radon collector is closed. Evacuation of the trap is continued for a few minutes to remove traces of nitrogen and oxygen. Next, the valve to the vacuum pump is closed and the valve between the primary trap and the (previously evacuated) concentrator trap is opened. The concentrator trap is a coiled tube of 3 mm stainless steel tubing with 300 mm length that is also stuffed with bronze wool. The primary trap is heated with a heat gun and the concentrator trap is chilled with liquid nitrogen so the gas is cryopumped to the concentrator trap.
The cryopumping continues for about 15 min during which time a Lucas cell is attached to the system at an adjacent quick-connect port and evacuated. The concentrator trap is then isolated and heated and a valve between the Lucas cell and the concentrator trap is opened. Since the volume of the Lucas cell is larger than that of the concentrator trap and connecting tubing, most of the radon transfers to the Lucas cell by volume sharing. The pressure in the cell at the time of filling is read with a transducer and is typically 0.1 atm for H2O assays or 0.5 atm for D2O assays. This gas is mainly CO2 which is not well separated from radon as they have similar boiling temperatures. Even at 0.5 atm, however, the -particle range is nearly 6 cm, considerably greater than the 1.9 cm radius of the Lucas cell. Finally, the cell is disconnected and taken to a counting facility on the surface.
Except for the water trap, all components of the radon collector are off-the-shelf stainless steel parts connected with compression fittings. Considerable care was taken in the section from the concentrator to the Lucas cell to minimize the volume by using small diameter tubing, filling all unused volumes with inert material, and selecting low dead-volume valves.
The efficiency of the primary trap for stopping radon was measured under static conditions by concentrating a large amount of radon from the air into a Lucas cell, counting the radon in the cell, injecting the radon from that cell into the input of the primary trap, and extracting the radon back into the same cell. After accounting for radon decay, radon absorption into the acrylic of the Lucas cell, and the transfer efficiency from the concentrator trap to the Lucas cell, the trapping efficiency was found to be .
The efficiency of transfer from the concentrator trap to the Lucas cell was measured in the H2O system by filling the concentrator trap with air at atmospheric pressure. An evacuated Lucas cell was then attached and the change in pressure gave an efficiency of . For the D2O system this technique yielded an efficiency of .
An alternate efficiency measurement was made for the D2O system using radon. A Lucas cell containing a measured amount of radon was attached to the usual Lucas cell port and connected to the concentrator trap. The concentrator trap was chilled with liquid nitrogen and the radon from the cell was drawn by a vacuum pump to the concentrator trap. After pumping all radon from the cell, the trap was heated and the radon was re-injected into the same Lucas cell by the usual volume-sharing technique. After accounting for radon decay, the transfer efficiency from the concentrator trap to the Lucas cell was measured to be . This more precise value is used to infer the radon concentration in the D2O.
5.2 Radon collector background
The background of the radon collector water trap is included in the total assay system background and was considered above in Sec. 3.4 and Sec. 4.3. The background of the other components of the radon collector in the D2O system was measured [27] by helium leak testing to cm3/sec, evacuation of the entire collector, and then closing all valves so as to isolate the separate parts. After a seal time of a few days, the individual regions were each extracted independently into Lucas cells. Weighting each section of the collector by the time it is used in the processing of the assay gives a total background that is several times less than the assay system background. We therefore consider the background of the collector (exclusive of the water trap) to be negligible.
6 Data acquisition system
The Lucas cell from the assay is placed on the end of a 50-mm diameter 10- or 12-stage photomultiplier tube and counted for 8 to 10 days. The tube output is amplified, digitized, and stored in 256 channels of a 4096-channel analyzer. Every 3 hours the data stored in the analyzer are transferred to a computer and a “log” file is updated with the cumulative counting time and the cumulative number of events within a chosen region of interest. Another file is also written every three hours which contains the full cumulative energy spectrum. If desired, these spectra can be reanalyzed with the region of interest redefined and a new “log” file generated. The \nuc222Rn decay counting system contains 11 counting stations, with one or two Lucas cells assigned to each station. Since the system is in a laboratory on the surface, there is a delay of two or more hours between the end of an assay and the start of counting.
6.1 Lucas cells
The Lucas cells developed for SNO are acrylic cylinders with a hollow interior machined into a 19-mm radius hemisphere whose surface is painted with activated ZnS. One end of the cylinder has a low-volume quick-connector [33] through which radon gas is admitted and the other end is sealed with a flat sheet of acrylic. When particles from the decay of 222Rn or one of its -emitting decay products strike the ZnS coating on the acrylic surface, light is emitted. The flat acrylic end of the cell is placed atop a photomultipler tube which detects this scintillation light. The cell diameter is 5 cm and the interior gas volume is 15.5 cm3. These low background devices are described in detail in [26].
New cells are leak checked with a He mass spectrometer and the cells in use are periodically checked by evacuating them underground, keeping them for several hours in this high radon environment, and bringing them to the surface for counting. A cell filled with underground air contains about 900 Rn atoms, compared to 480 from D2O at the maximum allowable level.
One cause of leakage is improper removal of the Lucas cell from the assay system at its quick-connector at the end of an extraction. This problem appears to have occurred once in the assays of the D2O. Leakage can also occur because of inadequate lubrication of, or dirt on, the connector O-rings. This problem was greatly reduced by instituting a regular program of disassembly, cleaning, and regreasing. This is essential because even small leaks can introduce a number of radon atoms comparable with the 150 atoms that are presently collected in a typical D2O assay.
6.1.1 Lucas cell efficiency
The section of the U chain that begins with \nuc222Rn is \nuc222Rn \nuc218Po \nuc214Pb \nuc214Bi \nuc214Po \nuc210Pb, which has a 22-year half life. Shortly after the decay of a \nuc222Rn atom two additional particles are emitted, from \nuc218Po and \nuc214Po. The effective efficiency of the Lucas cell for \nuc222Rn decay is thus three times its efficiency for single- detection, provided counting begins a few hours or more after the cell is filled.
The efficiency of the SNO Lucas cells was measured by injecting air containing a known amount of radon into two cells at a commercial radon calibration company [34]. The company measured the radon concentration of the air put into the cells to be Bq/m3, equivalent to about 12 000 Rn atoms in each cell. The two cells were counted at SNO about one day after the radon injection. After accounting for decay between the time of injection and the start of counting, the cells were found to have single- detection efficiencies of 75% and 74% with a 0.6% statistical uncertainty and a 3.4% systematic uncertainty.
Soon after the calibration of these two cells, nine Lucas cells were taken underground, where the typical radon concentration is 100 Bq/m3, evacuated, and filled with ambient air. All cells were found to have similar efficiency but with a statistics dominated 12% uncertainty in each measurement. Assuming all cells have the same efficiency, the standard deviation of efficiency from the combination of these measurements is 7%. Combining this with the known difference in efficiency from cell to cell due to their volume difference, which is 3%, we conclude that the single- detection efficiency of cells that were not directly calibrated is . The 26% loss of -particles is mainly due to the cell geometrical efficiency.
6.1.2 Lucas cell background
When a Lucas cell is new, its background from cosmic radiation and radioactivity in the ZnS is less than 3 counts per day, but the background gradually builds up with use. This increase in background is mainly due to the 5.3-MeV from 138-d \nuc210Po which comes from the gradual accumulation of 22-year \nuc210Pb. With each use of a cell its \nuc210Pb content builds up and the following \nuc210Po decays produce an ever increasing cell background. Each Rn decays increase the cell background rate by roughly one count per day. After a cell has been used extensively, it will eventually have such a high background rate that it must be retired and replaced with a new one.
The background of each Lucas cell is periodically measured by evacuating it and counting in the standard manner. The background of the cells currently in use in D2O assays is about 10 counts/d and in the range of (10–20) counts/d in H2O assays. These are known with a 10% statistical uncertainty.
6.2 Electronics
Spurious signals in the photomultiplier dynode chain can be a source of noise unrelated to alpha decay within a Lucas cell. The region of interest for decays is set to exclude such events, which mostly occur at low energy. Nevertheless, there is some leakage into the region of interest. By counting without a Lucas cell on the photomultiplier, this noise rate was measured to be less than 0.5 counts/d. The lower limit of the region of interest will cut out some true events. Measurements with a Lucas cell spiked with \nuc226Ra (which we call a “hot” cell) show that the fraction of events lost depends on the electronics in the counting station and is in the range of (0–5)%. This loss is accounted for in the counting efficiency uncertainty.
Cross-talk from adjacent counting stations is also a potential source of noise. This effect was measured by putting a “hot” cell on one station and measuring the number of counts that appeared in all other stations. Even with counts on the “hot” station, the average number of counts on other stations did not exceed 0.5 counts. Cross-talk is thus a negligible contributor to the systematic uncertainty.
The long term photomultiplier gain drift was measured by comparing “hot” cell counting rates over a 3-year period. During this time the rate in the station used most often for D2O assays varied by and the rate in the stations used for H2O assays varied by no more than .
7 Data processing
In this section we derive the relationship between the cumulative number of detected counts and the concentration of radon in the water that enters the degasser. We assume that is constant.
If we flow water at a constant rate of liters/min for a time interval of duration and extract with a degassing efficiency , then the number of radon atoms from the water that are present on the first trap in the collection system (the primary radon trap) at the end of extraction is
| (1) |
where is the radon trapping efficiency and is the \nuc222Rn decay constant. The term in parentheses is due to the decay of radon during the extraction time; for short assay times this term is approximately . To obtain the total number of radon atoms present on the trap we must add to this the background of the radon assay system. Defining as the rate of radon production by emanation, diffusion, and ingress in the degasser and the front section of the collection system, the number of radon atoms from these backgrounds on the trap at the end of extraction is
| (2) |
These atoms are transferred to the Lucas cell with efficiency . As discussed in Sec. 5, the radon background of the section of the collection system used during this transfer is negligible. If the time delay between the end of extraction and the start of counting is , the number of radon atoms present in the Lucas cell at the start of counting (SOC) is
| (3) |
The counting data consist of the superposition of two components:
-
•
the decay of \nuc222Rn. Since the initial number of atoms is and the number exponentially decreases in time, the count rate of this component varies with time according to , where is the effective \nuc222Rn counting efficiency.
-
•
a constant background rate . These events are mainly the decay of 22-year \nuc210Pb which has accumulated in the cell from previous assays. The value of is assumed known from previous counting of this cell for background.
We add these two components to get the total count rate as a function of time
| (4) |
and integrate for a time interval of duration . The total number of observed counts in this time is then
| (5) |
Combining Eq. (1), (2), (3), and (5), the concentration of radon in the water is given by
where we have abbreviated .
Typical values of the parameters in this equation are , liters/min, , , (there are 3 prompt particles emitted after each radon decay, each of which is counted with 74% efficiency), hours in the D2O system and 30 min in the H2O system, hours, from D2O and 740 from H2O, d, counts/d in the H2O system and 10 counts/d in the D2O system, and Rn atoms/d in the H2O system and 430 Rn atoms/d in the D2O system. To convert from radon atoms/liter to g U/g water, multiply the right side of Eq. (7) by the factor where is the water density in g/cm3, 1.0 for H2O and 1.1 for D2O. This assumes equilibrium in the U decay chain.
To check that there is reasonable agreement between the results of this procedure and the data, the total count rate predicted from Eq. (4) is calculated and visually compared to the differential spectrum of number of counts versus counting time. This comparison is shown in Fig. 4 for an extraction from D2O whose activity is slightly higher than average.

8 Overall systematic uncertainties in the assays
Most of the various terms that enter the systematic uncertainty have been given in the previous text and are summarized in Table 2. This table also includes the contribution of the collector, degasser, and cell backgrounds, which will now be considered.
| Source | Inner H2O | D2O |
|---|---|---|
| Flow rate | ||
| Flow rate (stroke counted) | ||
| Degassing efficiency | ||
| Assay system background | ||
| Trapping efficiency | ||
| Transport efficiency to Lucas cell | ||
| Cell counting efficiency | ||
| Cell background rate | ||
| Electronic noise | ||
| Photomultiplier stability | ||
| Combined quadratically | ||
| Combined (stroke counted) |
The systematic uncertainty from backgrounds depends upon the magnitude of the observed radon signal, which has decreased as SNO data was acquired. On average, during the pure D2O phase of the experiment, the radon levels in the H2O and D2O were about 1/4 of the maximum allowable values. For the inner H2O we thus collected roughly 100 atoms from the water. The background due to the H2O MDG and the radon collector for a 30-min assay would result in about atoms in the Lucas cell. Thus, the uncertainty in the system background contributes a systematic error of 3%. The 210Pb background in the Lucas cells is about counts/d. Since in the first four days of counting we expect 110 counts from the water sample, the uncertainty due to cell background is 8/110, or 7%.
For the D2O, at 1/4 of the maximum allowable level, about 120 Rn atoms enter the Lucas cell from the water. The background from the assay system in a 5-hour assay (the usual assay time) is atoms of radon in the cell. Thus, the systematic error due to uncertainty in the assay system background is estimated as . The 210Pb background in the Lucas cell contributes about counts/d background. For the first four days of counting we expect 135 counts from the radon in the D2O and thus the systematic error due to uncertainty in cell background is 3/135, or 2%.
9 Assay results


Weekly measurements are usually made from the three valves in H2O shown in Fig. 1, from the H2O process degasser, and from one or more of the valves in the D2O. The results of water assays from 29 September 1999 through 15 May 2002 are shown in Figures 5 and 6. Most of the scatter in this data is not statistical fluctuation, but is due to real changes of the radon level in the detector. For example, there was a high radon level in both the H2O and D2O during the early period of neutrino-data taking. This was because the initially high radon content of the water used to fill the detector was still decaying. After that time there are several intervals during which spikes of radon were unintentionally introduced. These are clearly apparent in the H2O plots and were caused by the failure of the H2O process degasser’s vacuum pump, which resulted in laboratory air being injected into the H2O. An improved interlock system has prevented similar faults during subsequent pump failures. In the first month of neutrino data-taking, the radon levels in the D2O were still elevated until the nitrogen “cover gas” protection system was improved to compensate for leaks in the seal of the D2O vapor space. After that time, there were two unintentional introductions of radon into the D2O, but their amplitude was not sufficient to appreciably interrupt neutrino data-taking.
As is evident by examination of the assay plots, the average radon levels in both the H2O and D2O are well below the maximum allowable level. The interpretation of these assay results in terms of the net U-chain contamination and the way in which this contamination influences the neutrino detection rates reported in [10, 11, 12] will be presented elsewhere.
10 Summary and Conclusions
The method that SNO has developed to determine the radon content of the water in the detector by direct assay has been described. This method is relatively simple to execute, is reliable, and has been shown to be capable of detecting a few tens of atoms of radon per tonne of water, equivalent, assuming equilibrium in the U-chain, to a concentration of a few times g U/g water. This sensitivity is adequate to show that the \nuc214Bi contribution to the neutral current background of the SNO detector is substantially below the maximum allowable level, and thus it has been possible for SNO to determine the total flux of \nuc8B solar neutrinos by measurement of the neutral current interaction rate.
Should the need arise, the sensitivity of this technique could be improved by an order of magnitude by reducing the background of the D2O water trap, by constructing new Lucas cells, and by doubling the assay time.
Acknowledgements
We thank R. Rodriguez-Jimenez for his aid in calibration and assays. We thank G. Carnes, K. Dinelle, S. Fostner, B. McPhail, T. Spreitzer, and L. Wrightson for their contributions to this work during co-operative student placements with the SNO experiment. We appreciate helpful discussions with A. Sengupta and J. Munoz regarding membrane degasser efficiency. We are grateful to R. Lange for valuable discussions and thank the SNO operations staff for their great care in carrying out the assays described here. We are grateful to the INCO, Ltd. mining company and their staff at the Creighton mine without whose help this work could not have been conducted and we greatly thank Atomic Energy of Canada, Ltd. (AECL) for the loan of the heavy water in cooperation with Ontario Power Generation. This research was supported in Canada by the Natural Sciences and Engineering Research Council, the National Research Council, Industry Canada, the Northern Ontario Heritage Fund Corporation, and the Province of Ontario; in the USA by the Department of Energy; and in the United Kingdom by the Science and Engineering Research Council and the Particle Physics and Astronomy Research Council. Further support was provided by INCO, AECL, Agra-Monenco, Canatom, the Canadian Microelectronics Corporation, AT&T Microelectronics, Northern Telecom, and British Nuclear Fuels, Ltd.
References
- [1] B. T. Cleveland et al., Astrophys. J. 496 (1998) 505.
- [2] K. S. Hirata et al., Phys. Rev. Lett. 65 (1990) 1297; K. S. Hirata et al., Phys. Rev. D 44 (1991) 2241; Y. Fukuda et al., Phys. Rev. Lett. 77 (1996) 1683.
- [3] J. N. Abdurashitov et al., arXiv:astro-ph/9907113, Phys. Rev. C 60 (1999) 055801.
- [4] W. Hampel et al., Phys. Lett. B 447 (1999) 127.
- [5] S. Fukuda et al., Phys. Rev. Lett. 86 (2001) 5651.
- [6] W. Altmann et al., Phys. Lett. B 490 (2000) 16.
- [7] J. N. Bahcall, M. H. Pinsonneault, and S. Basu, arXiv:astro-ph/0010346, Astrophys. J. 555 (2001) 990.
- [8] A. S. Brun, S. Turck-Chièze, and J. P. Zahn, arXiv:astro-ph/9906382, Astrophys. J. 525 (1999) 1032.
- [9] J. Boger et al., arXiv:nucl-ex/9910016, Nucl. Inst. and Meth. in Phys. Res. A 449 (2000) 172.
- [10] Q. R. Ahmad et al., arXiv:nucl-ex/0106015, Phys. Rev. Lett. 87 (2001) 071301.
- [11] Q. R. Ahmad et al., arXiv:nucl-ex/0204008, Phys. Rev. Lett. 89 (2002) 011301.
- [12] Q. R. Ahmad et al., arXiv:nucl-ex/0204009, Phys. Rev. Lett. 89 (2002) 011302.
- [13] T. C. Andersen et al., arXiv:nucl-ex/0208015, Nucl. Instr. and Meth. in Phys. Res. A. 501 (2003) 386.
- [14] T. C. Andersen et al., arXiv:nucl-ex/0208010, Nucl. Instr. and Meth. in Phys. Res. A. 501 (2003) 399.
- [15] Specially produced by Fabco Plastics, Maple, Ontario, Canada, from type SV-258 resin manufactured by Himont Inc.
- [16] Specially produced by Precision Polymer Engineering, Blackburn, England.
- [17] S. Nakamura, T. Sato, V. Gudkov, and K. Kubodera, arXiv:nucl-th/0009012, Phys. Rev. C 63 (2001) 034617.
- [18] H. F. Lucas, Rev. Sci. Instr. 28 (1957) 680.
- [19] The assay systems use 1-inch air-operated double-diaphragm pumps made by Osmonics Inc., Minnetonka, Minnesota, USA, that are extensively modified for vacuum service.
- [20] M. Q. Liu, 222Rn emanation into vacuum, M. Sc. thesis, Queen’s University, Canada (1991), unpublished.
- [21] X. Zhu, Study of vacuum degassing for the SNO water system, M. Sc. thesis, Queen’s University, Canada (1992), unpublished.
- [22] S. Noël, High flow rate water degasser for the SNO project, M. Sc. thesis, Queen’s University, Canada (1994), unpublished.
- [23] Constructed by the All-Weld Company Limited, Scarborough, Ontario, Canada using non-thoriated welding rod.
- [24] Whirljet nozzles made by Spraying Systems, Wheaton, Illinois, USA.
- [25] L. K. Wrightson, Radon degassing efficiency in the H2O process degasser,, SNO internal report (2001) SNO-STR-2001-009.
- [26] M. Q. Liu, H. W. Lee, and A. B. McDonald, Nucl. Inst. and Meth. in Phys. Res. A 329 (1993) 291.
- [27] D. Grant, Process and monitor degasser systems for the SNO heavy water system, M. Sc. Thesis, Carleton University, Canada, (1998), unpublished.
- [28] L. A. Currie, Anal. Chem. 40 (1968) 586.
- [29] Liqui-Cel membrane contactor made by Celgard Inc., Charlotte, North Carolina, USA.
- [30] A. Sengupta, P. A. Peterson, B. D. Miller, J. Schneider, and C. W. Fulk, Jr., Separation and Purification Technology 14 (1998) 189.
- [31] Model 7931-Series dissolved oxygen probe made by Honeywell Inc., Minneapolis, Minnesota, USA.
- [32] “Duradry” or “Titan” trap made by FTS Systems, Stone Ridge, New York, USA.
- [33] Swagelok Quick-Connect Co, Hudson, Ohio, USA.
- [34] Pylon Electronics Inc., Ottawa, Ontario, Canada.