Possible background reductions in double beta decay experiments
Abstract
The background induced by radioactive impurities of and in the source of the double beta experiment NEMO-3 has been investigated. New methods of data analysis which decrease the background from the above mentioned contamination are identified. The techniques can also be applied to other double beta decay experiments capable of measuring independently the energies of the two electrons.
PACS: 23.40.-s, 14.80.Mz
keywords:
Double beta decay, neutrino, Molybdenum-100., , , ††thanks: Corresponding author, Institute of Theoretical and Experimental Physics, B. Cheremushkinskaya 25, 117259 Moscow, Russia, e-mail: barabash@vxitep.itep.ru, tel.: 007 (095) 129-94-68, fax: 007 (095) 883-96-01, , , , , , , , , , , , , , , , , , , , , , , , , , , , , , , , , , ,
NEMO Collaboration
1 Introduction
Neutrinoless double beta decay () is a problem of great interest in particle physics (see [1, 2]). Currently, there are many experiments searching for this subject, and new ones are planned for the future (e.g. [3, 4]). One of the most promising of the experiments is NEMO-3. It will study double beta decay of different nuclei with the primary objective to look for the decay of . The detector is sensitive to decays with a half life on the order of years [5, 6].
The greatest concern in double beta experiments is the background which can mimic the double beta decay process. The backgrounds can be classified by their origin. There are external and internal backgrounds.
The external background accounts for such things as cosmic rays, rays and neutrons coming from the walls of the laboratory and parts of the detector. To decrease this background, one places the detector deep underground, applies passive and/or active shielding and incorporates radiopure materials. The data from the NEMO-2 detector and Monte-Carlo (MC) calculations predict that the external background in the NEMO-3 detector for five years of operation will be equivalent to zero [6, 7].
The internal background is caused by the properties of the source material. An unavoidable background originates from two neutrino double beta decay () of the source (). This kind of internal background cannot be completely separated from the decay mode due to the finite energy resolution of the detector. Another source of internal background is the radioactive impurities in the sample. The energy of the decay of such nuclei as and is greater than the energy of the transition of (3.03 MeV). Therefore they produce especially troublesome backgrounds. The background from and clearly depends on the purity of the sample. However, producing source materials with high purity is a sophisticated and expensive procedure. Often the desired level of purity cannot be reached. This is why it is useful to elaborate on methods of data analysis which suppress the backgrounds of the radioactive impurities.
Farther along in this paper the particular mechanisms by which and can produce events similar to decay are discussed. The characteristics of each type of background are described and a new analysis, which can suppress them, is presented.
2 The NEMO-3 detector.
The detector (Fig. 1) is cylindrical in design and it is divided into 20 equal sectors. A thin (40-60 mg/cm2) cylindrical source foil is constructed from either a metal film or powder, bound by an organic glue to mylar strips. The source hangs between two concentric cylindrical tracking volumes consisting of open octagonal drift cells operating in Geiger mode. These cells run vertically and are staged in a 4, 2, and 3 row pattern to optimise track reconstruction. The design of the 6,180 drift cells calls for 50 m anode and cathode wires.
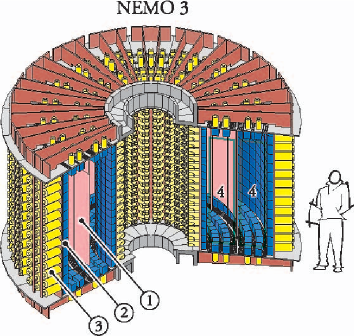
The tracking volumes are surrounded by a calorimeter made of 1,940 large blocks of plastic scintillator coupled to very low radioactivity 3” and 5” Hammamatsu photomultiplier tubes (PMTs). At 1 MeV, the energy resolution, which depends on the scintillator shape and the associated PMT, ranges from 11% to 14.5% (FWHM), with a time resolution of 250 ps.
A solenoid producing a magnetic field ( G) surrounds the detector to reject ( pairs. External shielding of 20 cm of low activity iron reduces gamma-ray fluxes and thermal neutrons. A supplementary shield (water tanks, wood and polyethylene plates) suppress the contribution of fast neutrons to the external background. At the depth of the experimental hall (4,800 m of water equivalent) in the Modane Underground Laboratory, the signal from cosmic rays is negligible. Vigorous flushing of the air in the hall reduces the radon levels to 10-20 Bq/m3. The presence of 214Bi decays in the detector from this level of radon contamination is below that introduced by the PMTs.
An electron in the detector is defined by a track linking the source foil and a fired scintillator. A two-electron event (2e-event) is defined by two tracks which have a common vertex in the foil, and each track is associated with a fired scintillator. The neutrinoless double beta decay gives rise to two electrons which produce a 2e-event in the detector with a line spectrum, because two electrons emitted carry all the energy of the decay. However, due to energy loss and the finite energy resolution of the calorimeter, the summed electron spectrum of events has some width. The MC calculations predict that the spectrum of decays of in NEMO-3 will be as shown in Fig. 2.
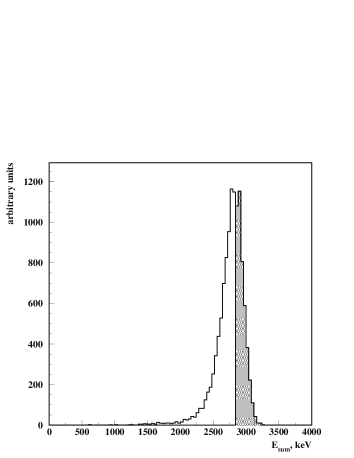
To suppress the background from decay only the 2e-events with energies within the window 2,840-3,240 keV are selected for further analysis. Hereafter, this window is referred to as the high-energy region (HER).
A characteristic feature of the NEMO-3 detector is that it can not only measure the whole energy unleashed in the decay, but also the energy of each electron and the angle between them. A spectrum of the individual electron energy in a 2e-event depends on its source in the foil. This phenomenon and its effective analysis are studied in the rest of the paper.
3 The primary sources of the internal backgrounds
The internal background estimations reported here, were made with MC calculations. The calculations were done with the help of the GEANT 3.21 package.
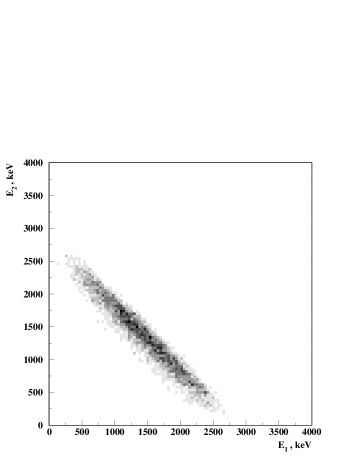
The way by which the energy of 2e-event is distributed between the electrons can be well represented in a two-dimensional histogram (i.e. Fig. 3). Along the axis of these histogram are the energies of electron 1 (E1) and 2 (E2). Thus, each 2e-event looks like a point.

The 2e-events from decay of in the HER are shown in Fig. 3. Notice that for the majority of the events, the energy is divided almost equally between the two electrons.
In the study of the background from the radioactive impurities in the source, it is important to understand the exact mechanism by which the decay of or can be detected as a 2e-event in the HER. After scrutinising the results of the MC calculations, three basic mechanisms were identified.
The first is decay accompanied by an electron from the electron conversion (EC) mechanism. In this case, two electrons with sufficient energy are emitted from a common point.
The second process is Möller scattering of the decay electron in the material of the foil. The two electrons can be detected as a 2e-event even if the decay is followed by a transition of the daughter nucleus from an excited state to the ground state (g.s.) via a -ray emission. This occurs because the -ray can escape the detector, given that the detection efficiency of the scintillator is rather low (30-50).
The third possibility is that the second electron is produced via Compton scattering of the -ray, which follows the decay. Again, as in the previous case, this process can be interpreted as a 2e-event if the scattered -ray is not detected.
3.1 The background from .
The decay of produces 2e-events via all of the above mentioned mechanisms. These are the three dominate modes of the decay which yield almost all the background from in the HER. The specific transitions are shown in Fig. 4. The results of the background MC simulations are presented in Table 1.
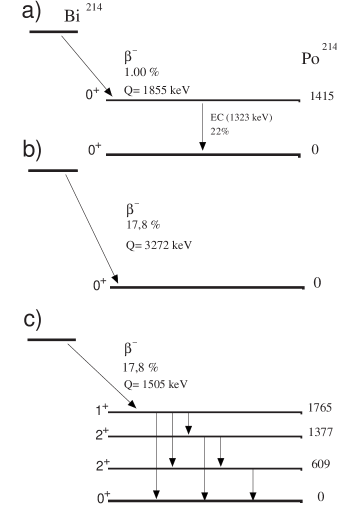
The characteristic features of the background, produced by each of these processes, are as follows. In the first process (Fig. 4 a), a conversion electron with fixed energy (1,323 keV) is emitted. One can see the conversion line in the histogram of the corresponding 2e-events in Fig. 5. Though the probability of this process is very low (0.22) it contributes about half of the background from in the HER (see Table 1).

In the second process (Fig. 4 b), the second electron is produced by Möller scattering. Thus, there is a small momentum transfer and a small scattering angle. This can be observed in the 2e-events (Fig. 6). One of the electrons in the pair has significantly higher energy than the other.

Finally, in the third process (Fig. 4 c), the energies of the -electron and the -ray are almost equal ( MeV). Therefore the total energy of the two electrons is approximately 3 MeV only if the second (Compton) electron acquires nearly all the energy of the -ray. Thus, the corresponding 2e-events registered in the HER have two electrons with practically the same energies (Fig. 7).

| Decay mode (See Fig. 4) | Branching | Number of 2e-events∗ | Percentage of |
| ratio | background | ||
| (1,855 keV) plus EC(1,323 keV) | 0.0022 | 47 % | |
| (3,272 keV) | 0.178 | 26 % | |
| (1,505 keV) plus | 0.178 | 22 % | |
| Sum | 96 % | ||
| All decay modes | 1.00 | 100 % | |
| ∗Normalised to 14,450,000 decays. | |||
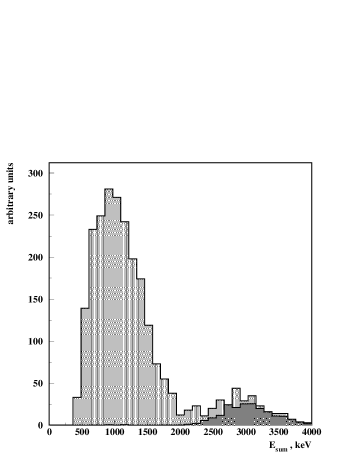
A histogram of not only the three dominate decay modes but all the background 2e-events from is given in Fig. 8 for the HER.

3.2 The background from .
The background of 2e-events in the HER from comes mainly from the electron conversion mechanism. The decay of always occurs through the excited state of a nucleus with an energy of 2,615 keV. This high energy and rather large probability of EC () account for its large contribution to the background in the HER. In Fig. 9 one can see 2e-events from and the contribution from the decay process plus . In the HER it contributes up to of all 2e-events. As in the case with the background from , a conversion line can be clearly seen in the histogram of the 2e-events (Fig. 10, 11).


4 Results
The MC results can be used to improve the signal-to-noise ratio (S/N). To do this, one should introduce new cuts, which take into account the difference in the energy distributions among the electrons in the background 2e-events and in the 2e-events from .
Currently, there are many modes of decay discussed in the literature [8, 9]. Consider the two most favoured hypotheses: the existence of a non-zero Majorana mass for the neutrino and the admixture of the right hand current in the electro-weak interaction. These two hypotheses lead to different electron energy spectra, and thus they should be treated separately.
4.1 decay: Majorana neutrino mass
The 2e-events from decay, in the case of a non-zero Majorana neutrino mass, are shown in Fig. 12. Their distribution is similar to the one from decay (Fig. 3). The 2e-events are symmetric from the point of view of electrons energy. Thus, one cannot distinguish and decays based upon the energy of each electron in the pair.
The situation is different for the backgrounds from and . Since the major component of the background is caused by the EC process, it can be suppressed if one excludes the region where the conversion line peaks (Fig. 11). In Fig. 11 an example of the corresponding cut is given in the form of rectangular areas to be excluded. Table 2 presents the reduction factors for various sizes of the excluded region for .
It is evident that one can get rid of a significant fraction of the background. The reduction of the background is less effective, because the conversion line peaks in the region where the decay is expected (Fig. 8,12) and it also contributes less than half of the total background. The results for are presented in Table 3.
| High energy | Low energy | reduction | reduction | S/N∗ |
| electron (keV) | electron (keV) | factor | factor | |
| no cut | no cut | 1.00 | 1.00 | 1.00 |
| 2,320-2,590 | 400-960 | 0.37 | 0.90 | 2.43 |
| 2,280-2,590 | 400-1,010 | 0.33 | 0.89 | 2.67 |
| 2,230-2,590 | 430-900 | 0.26 | 0.85 | 3.31 |
| ∗Here S/N is the ratio between the and the columns. | ||||
| High energy | Low energy | EC reduction | reduction | reduction | S/N∗ |
| electron (keV) | electron (keV) | factor | factor | factor | |
| no cut | no cut | 1.00 | 1.00 | 1.00 | 1.00 |
| 1,320-1,720 | 1,170-1,310 | 0.45 | 0.56 | 0.90 | 1.60 |
| 1,320-1,770 | 1,130-1,310 | 0.35 | 0.46 | 0.85 | 1.86 |
| 1,320-1,770 | 1,090-1,320 | 0.25 | 0.42 | 0.81 | 1.94 |
| ∗Here S/N is the ratio between the and the columns. | |||||
4.2 decay: right hand current
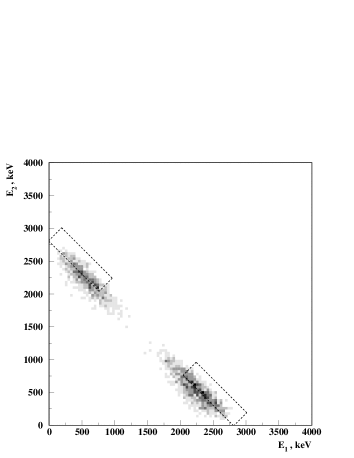
The distribution of 2e-events from decay in the case of right hand current admixture in the electro-weak Lagrangian is shown in Fig. 13. It clearly differs from the case of the Majorana neutrino mass (Fig. 12). Such a distribution allows one to suppress efficiently the backgrounds from decay and , but makes it difficult to suppress the background. The suggested cut is to reject events, which do not lie in the rectangular areas (Fig. 13). Table 4 presents these results.
| Background | Decays | 2e-events | 2e-events in cut region: | Reduction |
| simulated | in the HER | for 2,800 to 3,200 | factor | |
| for 1,280 to 2,820 | ||||
| 50,000 | 2330 | 2281 | 0.98 | |
| 295,000,000 | 63 | 43 | 0.68 | |
| 14,450,000 | 48 | 17 | 0.35 | |
| 2,170,000 | 105 | 96 | 0.91 |
5 Conclusion
In general one needs to gather as much information about the event as possible to be able to suppress the backgrounds efficiently. In double beta decay experiments the measurement of the energies of each electron allows one to introduce additional cuts, which improve the S/N ratio. The final values of the cuts should be tuned based on the properties of the detector and the background levels.
It was shown that the dominate part of the internal background comes from the EC process associated with the radioactive impurities (, ) which can be efficiently suppressed.
The sensitivity of the NEMO-3 detector to the right hand current admixture can be improved by reducing the background from and decay.
The NEMO-3 detector can study any double beta isotope that can be produced in foil form, therefore similar analysis can be made on other isotopes and radioactive contamination.
Though all the estimates were made for the NEMO-3 detector, qualitatively, the results are valid for experiments where the energy of each electron is measured. For example, this method can be applied to the data analysis in existing (ELEGANT-V [10], ITEP TPC [11]) and future (MOON [12], DCBA [13]) experiments.
References
- [1] H.V. Klapdor-Kleingrothuas, H. Pas and A. Yu. Smirnov, Phys. Rev. D 63 (2001) 073005.
- [2] S.M. Bilenky, S.Pascoli and S.T. Petcov, Phys. Rev. D 64 (2001) 053010.
- [3] H. Ejiri, Nucl. Phys. B (Proc. Suppl.) 91 (2001) 255.
- [4] E. Fiorini, Nucl. Phys. B (Proc. Suppl.) 91 (2001) 262.
- [5] NEMO-3 Proposal, LAL preprint 94-29 (1994).
- [6] Ch. Marquet, Nucl. Phys. B (Proc. Suppl.) 87 (2000) 298.
- [7] Ch. Marquet et al. Nucl. Instr. Meth. A 457 (2001) 487.
- [8] H.V. Klapdor-Kleingrothaus and A. Staut, Non-Accelerator Particle Physics, Institute of Physics, Bristol, 1995.
- [9] A. Faessler and F. Shimkovic, J. Phys. G24 (1998) 2139.
- [10] H. Ejiri et al., Nucl. Phys. A611 (1998) 85.
- [11] V.A. Artemiev et al., Phys. At. Nucl. 63 (2000) 1238.
- [12] H. Ejiri et al., Phys. Rev. Lett. 85 (2000) 2917.
- [13] N. Ishihara et al., Nucl. Instr. Meth. A443 (2000) 101.