On the Alpha Activity of Natural Tungsten Isotopes
F.A. Danevicha, A.Sh. Georgadzea, V.V. Kobycheva,111Current address: INFN, Laboratori Nazionali del Gran Sasso, 67010 Assergi (AQ), Italy, S.S. Nagornya, A.S. Nikolaikoa, O.A. Ponkratenkoa, V.I. Tretyaka, S.Yu. Zdesenkoa, Yu.G. Zdesenkoa,222Corresponding author. E-mail address: zdesenko@kinr.kiev.ua
aInstitute for Nuclear Research, MSP 03680 Kiev, Ukraine
P.G. Bizzetib, T.F. Fazzinib, P.R. Maurenzigb
bDipartimento di Fisica, Universit di Firenze and INFN, I-50019 Firenze, Italy
Abstract
The indication for the decay of 180W with a half-life =1(stat)(syst)1 yr has been observed for the first time with the help of the super-low background 116CdWO4 crystal scintillators. In conservative approach the lower limit on half-life of 180W has been established as W) 0.7 yr at 90% C.L. Besides, new bounds were set for decay of 182W, 183W, 184W and 186W at the level of 1020 yr.
PACS number(s): 23.60.+e; 29.40.Mc
Keywords: alpha decay, 180W, 182W, 183W, 184W, 186W, CdWO4 crystal scintillator.
1 INTRODUCTION
Alpha decay is allowed energetically for the five naturally occurring isotopes of tungsten [1], but it was never observed up to now. The activity of tungsten with particle energy of about 3 MeV and half-life 2.21 yr (where is the relative abundance of isotope) was declared in an early experiment with nuclear emulsion technique [2]. Because value for all natural tungsten nuclides, except 180W, is less than 2 MeV, the result of ref. [2] could be attributed to decay of 180W ( [3]) with = 2.61 yr. However, this observation was ruled out in the work [4], where the cadmium tungstate (CdWO4) crystal scintillator (mass of 20.9 g) was used as a source and detector of decay events simultaneously. After 193 h of measurements the limit 1.01 yr was established [4]. A similar restriction ( 9.01014 yr) was also obtained in experiment (66.7 h of exposition) with ionization counter (1200 cm2 in area) and thin (83 g/cm2) sample of W (with total mass of 79 mg) enriched in 180W to 6.95% [5].
These bounds were improved only recently in the measurements with two scintillators: CdWO4 (mass of 452 g, running time of 433 h), and 116CdWO4 enriched in 116Cd to 83% (91.5 g, 951 h) [6]. The limits on the half-lives for decay of different W isotopes were set in the range of 1017–1 yr (see Table).
| Isotope, | , MeV | Calculated | , yr | Experimental | , yr |
| abundance | [1] | based on [7] | based on [8] | present work | [6] |
| [3] | |||||
| 180W | 2.516(5) | 1 | 1 | 1 | |
| 0.12(1)% | .7 | 41 | |||
| 182W | 1.774(3) | 1 | 1 | 7 | 3 |
| 26.50(16)% | |||||
| 183W | 1.682(3) | – | 1 | 81 | 91 |
| 14.31(4)% | |||||
| 184W | 1.659(3) | 1 | 1 | 81 | 01 |
| 30.64(2)% | |||||
| 186W | 1.123(7) | 1 | 1 | 7 | 51 |
| 28.43(19)% |
In this paper the new results of Kiev-Firenze experiment (2975 h of exposition) on decay of natural tungsten isotopes are described (the preliminary analysis of the 975 h data was presented in [9]). They were obtained with the help of the super-low background spectrometer [10] based on enriched 116CdWO4 crystal scintillators. The sensitivity of this apparatus to measure activity was enhanced substantially in comparison with our previous work [6] mainly due to the developed technique of pulse-shape analysis of the data, which allows us to distinguish events caused by particles from those by rays ( particles).
2 EXPERIMENT AND DATA ANALYSIS
2.1 Experimental set-up
The set-up, used in our study, was originally devoted to the search for the neutrinoless double beta decay of 116Cd [10]. The 2 decay experiment is carried out by the INR (Kiev)333From 1998 by the Kiev-Firenze collaboration [10]. in the Solotvina Underground Laboratory (allocated in a salt mine 430 m underground [11]) and results were published elsewhere [10, 12]. The high purity 116CdWO4 crystal scintillators, enriched in 116Cd to 83%, were developed and grown for the search [12]. Their light output is 30–35% of NaI(Tl). The fluorescence peak emission is at 480 nm with principal decay time of 14 s [13]. The CdWO4 refractive index equals 2.3. The density of crystal is 7.9 g/cm3, and material is non-hygroscopic and chemically inert. In the apparatus (see for details [10]) four 116CdWO4 crystals (total mass 330 g) are exploited. They are viewed by a low background 5 EMI phototube (PMT) with RbCs photocathode through light-guide 1055 cm, which is glued of two parts: quartz (25 cm) and plastic scintillator (Bicron BC-412, 30 cm). The enriched 116CdWO4 crystals are surrounded by an active shield made of 15 natural CdWO4 crystals of large volume with total mass of 20.6 kg. These are viewed by a PMT through an active plastic light-guide 1749 cm. The whole CdWO4 array is situated within an additional active shield made of plastic scintillator 404095 cm, thus, together with both active light-guides, a complete 4 active shield of the main (116CdWO4) detector is provided.
The outer passive shield consists of high purity copper ( – cm), lead ( – cm) and polyethylene (16 cm). Two plastic scintillators (1201303 cm) are installed above the passive shield and are used as cosmic muon veto counters. The set-up is carefully isolated against environment radon penetration. All materials for the installation were previously tested and selected for low radioactive impurities in order to reduce their contributions to background.
An event-by-event data acquisition system records the amplitude, arrival time, additional tags (the coincidence between different detectors) and pulse shape (in 2048 channels with 50 ns channel’s width) of the 116CdWO4 detector in the energy range of MeV.
The energy scale and resolution of the spectrometer were determined with the sources 22Na, 40K, 60Co, 137Cs, 207Bi, 226Ra, 232Th and 241Am. The energy dependence of the resolution in the energy interval keV is expressed as follows: FWHM where energy and FWHMγ are in keV. For instance, energy resolutions of 33.7%, 13.5%, 11.5% and 8.0% were measured for lines with the energies of 60, 662, 1064 and 2615 keV, respectively. The routine calibration was carried out with a 207Bi (weekly) and 232Th (monthly) sources. The dead time of the spectrometer and data acquisition was permanently controlled with the help of a light emitting diode optically connected to the main PMT (typical value was about 14%).
Due to active and passive shields, and as a result of the time-amplitude [10] and pulse-shape analysis of the data [13], the background rate of 116CdWO4 detectors in the energy region – MeV (02 decay energy of 116Cd is 2.8 MeV) was reduced to 0.04 counts/yrkgkeV. It is the lowest background which has ever been reached with crystal scintillators.
2.2 Response of the 116CdWO4 detector to particles
It is well known that relative ratio of the CdWO4 scintillation light output for and particles with the same energies (so-called ratio444The detector energy scale is measured with sources, thus the notation “ ratio” could be more adequate. However, because rays interact with matter by means of the energy transfer to electrons, in present paper we are using traditional notation “ ratio”.) depends on the energy of the absorbed particles [6]. Because we are looking for the decay of W isotopes, such a dependence must be precisely measured in the energy range of 1–3 MeV (see Table). Unfortunately, among nuclides from U/Th families there are no emitters with such energies (the lowest available energy is 4.0 MeV from 232Th). To overcome this problem, a special method of calibration was developed, in which a collimated beam of particles from 241Am source was passed through a thin absorber with known thickness, thus the energy of particles after absorber can be calculated precisely. Furthermore, it was measured with the help of a surface-barrier semiconductor detector. The dimensions of the collimator are 0.75 2 mm, and thickness of a single mylar film absorber is 0.65 mg/cm By using this technique and different sets of absorbers, particles with energies of 0.46, 2.07, 3.04, 3.88, 4.58, and 5.25 MeV were obtained, which allows us to calibrate our detector in the energy range of interest.
It is also known that the light output of crystal scintillators may depend on the direction of irradiation relative to the crystal axes [14]. To study this effect for CdWO4, 116CdWO4 and CaWO4 crystals, they were irradiated by particles in three directions perpendicular to the (010), (001) and (100) crystal planes555In the 116CdWO4 crystal (010) plane is perpendicular to the cylinder axis, so for the (010) direction source was placed on the top of crystal (in the center of the flat circle surface). For the (001) and (100) directions crystal was irradiated in the middle of cylindrical surface., and three experimental dependences of the ratio (corresponding to three mentioned directions) as a function of particle energy were derived from measurements. However, in a real crystal the amplitude of a light signal depends also on the point, from which scintillation light is emitted (so-called nonuniformity of light collection). The latter can distort the anticipated effect of crystal’s orientation, and hence, should be properly taken into account. With this aim, the light propagation in the CaWO4 scintillator, for which the effect of crystal orientation was not observed, was simulated with the help of the GEANT3.21 package [15] for the light emitting points on the top and side surfaces of the crystals (with dimensions 202011 and 403423 mm), as well as for those uniformly distributed inside the crystal. It was found that results of simulations are in a good agreement with experiment. Then, the same simulations were performed for the 116CdWO4 crystal ( mm), and results of each calibration measurement with this crystal were corrected by using simulated distributions of the light collection for particles emitted from the corresponding point. So, values of the ratio for the direction 1 was multiplied by a factor of 0.85, while for the direction 2 and 3 – by a factor of 1.08. As an example, such corrected dependences of the ratio versus the energy and direction of particles are shown in Fig. 1 for enriched 116CdWO4 crystal ( mm).

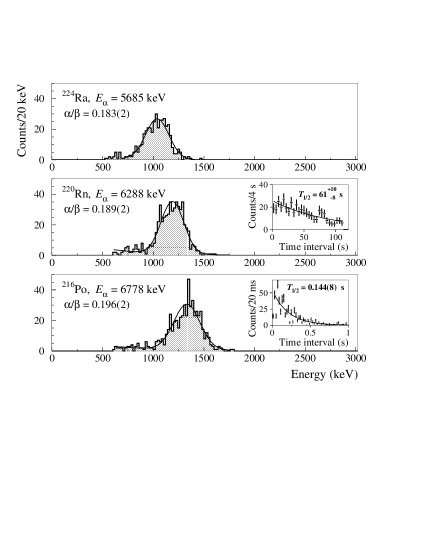
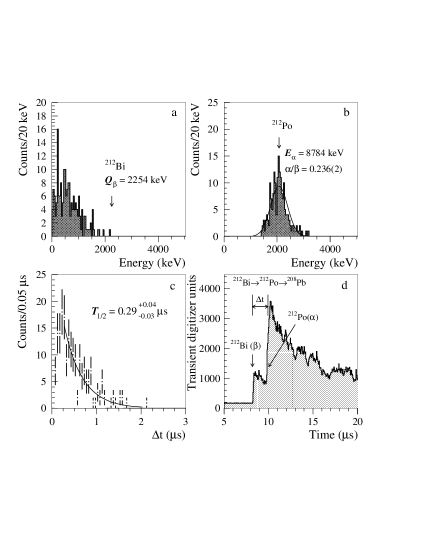
In addition to the measurements with the external source, the peaks from the intrinsic trace contamination of the 116CdWO4 crystals by nuclides from Th chain were also used for determination of the ratio. These peaks were selected from the background by using the time-amplitude analysis [10, 16]. For instance, the following sequence of decays from the 232Th family was searched for and observed: 224Ra ( = MeV, = d) 220Rn ( = MeV, = s) 216Po ( = MeV, = s) 212Pb. The obtained peaks ( nature of events was confirmed by a pulse-shape analysis described below), as well as the distributions of the time intervals between events are in a good agreement with those expected for particles of 224Ra, 220Rn and 216Po (see Fig. 2). On this basis the activity of 228Th in 116CdWO4 crystals was determined as 39(2) Bq/kg666The same technique was applied to the sequence of decays from the 235U and 238U families. Activity of 5.5(14) Bq/kg for 227Ac (235U family) and limit 5 Bq/kg for 226Ra (238U family) in the 116CdWO4 crystals were set.. Moreover, the peak of 212Po (the daughter of the 212Bi) was reconstructed with the help of the front edge analysis of the scintillation signals. The energy and time distributions of the sequence of decay of 212Bi and decay of 212Po, selected from the background, are presented in Fig. 3 (a, b and c), while typical example of such an event is shown in Fig. 3d.
The values of the / ratio, derived with the internal peaks, and their fit are depicted in Fig. 1. Fit yields for the energy range MeV: , where is in MeV.777The growth of the / ratio with particles energy has been earlier observed for cadmium tungstate [6] and other scintillators [14, 16, 17]. Because in measurements with internal sources the effect of crystal’s orientation is averaged, such an extrapolation of the fit into the energy region 2.0 – 5.5 MeV is reasonable and it was also proved by the behaviour of the / ratios measured with external sources (see Fig. 1). At the same time, in the energy interval of MeV we find that / ratio is decreased with the energy. It was also confirmed by the measurement with the thin ( mm) CdWO4 crystal scintillator (see insert in Fig. 1). Similar behaviour (fall with energy in the keV energy region) of relative scintillation efficiency for Ca and F recoil nuclei in CaF2(Eu) scintillator was reported in [18]. Thus, for MeV energy range we obtain: where is in MeV.
The calibration data were also used to determine the energy resolution of the detector for particles: FWHMα(keV), where is the energy of particles in scale expressed in keV.
2.3 Pulse-shape analysis
The pulse-shape analysis of CdWO4 scintillation signals was developed on the basis of the optimal digital filter [19], and clear discrimination between rays (electrons888Because rays interact with matter by means of the energy transfer to electron, it was assumed and experimentally proved with particles from the decay of internal 113Cd that pulse shapes for electrons and ’s are the same.) and particles was achieved [13]. The pulse shape of cadmium tungstate scintillators can be described as: , where are amplitudes and are decay constants for different light emission components, is the integration constant of electronics (s). To provide an analytic description of the or signals, the pulse shape resulting from the average of a large number of individual events has been fitted with the sum of three (for particles) or two (for -s ) exponents, giving the reference pulse shapes and (see for details ref. [13]). For the enriched crystals (used in the experiment) the following values were obtained: =80.9, =12.7 s, =13.4, =3.3 s, =5.7, =0.96 s for 5 MeV particles and =94.2, =13.6 s, =5.6, =2.1 s for 1 MeV quanta.
In the data processing the digital filter was applied to each experimental signal with aim to obtain the numerical characteristic of its shape defined as (shape indicator): , where the sum is over time channels starting from the origin of signal and up to 50 s, is the digitized amplitude (at the time ) of a given signal. The weight function is defined as:
.
The distributions measured with different and sources (see some examples in Fig. 4) are well described by Gaussian functions, whose standard deviations and depend on energy: ) =–0.30.711 for particles, and 10314 for quanta, where and are in keV. As it is seen from Fig. 4, electrons ( rays) and particles are clearly distinguished for the energies above 0.6 MeV ( 3 MeV), while pulse shape discrimination ability of CdWO4 scintillator is worsening at lower energies. Nevertheless, it is also visible from Fig. 4a that even 2 MeV particles ( 0.3 MeV) can be separated from background with reasonable accuracy. For instance, with requirement that 87% of particles must be registered we will get about 13% of events as background (see Fig. 4a).

The dependence of the pulse shape on energy and direction of particles measured with the enriched 116CdWO4 crystal scintillator (19 mm) is presented in Fig. 5. In the energy range of MeV the average dependence of the shape indicator on the energy can be approximated by the function: 51, where is in keV.

For quanta the energy dependence of the shape indicator was measured with sources in the energy range of MeV: 7141, where is in keV.
Besides, a digital filter for the pulses of the plastic scintillator light guide was developed and clear separation was obtained for the pure events in the plastic and cadmium tungstate scintillators. It allows us to discriminate plastic pulses in more complicated cases, when they are overlapped with the signals of 116CdWO4 crystals. The use of this filter leads to some loss of the registration efficiency for the events in the 116CdWO4 detector (of the order of 5%), which, however, can be correctly taken into account on the basis of calibration measurements.
3 RESULTS AND DISCUSSION
3.1 Background interpretation
The background spectra of () and events measured by four 116CdWO4 crystals (330 g, exposition 2975 h) are depicted in Fig. 6.
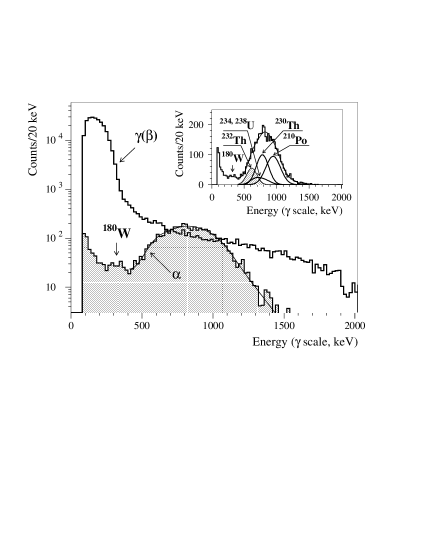
The spectrum shown in Fig. 6 was built by selecting the following interval of values: , which contains 98% of events. In the low energy region the background of the 116CdWO4 detector is caused mainly by the fourth-forbidden decay of 113Cd ( yr [20], Q keV [21]) which is present in the enriched crystal with abundance of . The distribution above keV is described by a trace contamination of the enriched and shield crystals by 40K, 137Cs, 113mCd, two neutrino double beta decay of 116Cd with yr [10], and external rays.
The energy spectrum of particles (Fig. 6) was obtained by selection of events with the following values of shape indicator: . Under such restrictions the efficiency of the pulse-shape analysis () depends on the energy of particles. For example, for peak of 180W this efficiency equals 49.5%, while additional use of the filter for the plastic pulses discrimination decreases this value down to 47%.
Taking into account the fact that secular equilibrium in crystal scintillators is usually broken, the distribution of the events is well reproduced by the model (see insert in Fig. 6), which includes decays from 232Th and 238U families. For illustration, the results of the pulse-shape analysis of the data (for energy above 350 keV) are presented in Fig. 7 as three-dimensional distribution of the background events versus energy and shape indicator. In this plot one can see clearly separated population of the events, which belong to U/Th families. The total activity associated with the peak in the energy region keV is 1.40(10) mBq/kg. However, because of a poor energy resolution for particles and uncertainty of the / ratio, we give only limits on the activity of nuclides from uranium and thorium families in the 116CdWO4 scintillators received from the fit of the spectrum in the range keV: 232Th 0.15 mBq/kg, 238U (234U) 0.6 mBq/kg, 230Th 0.5 mBq/kg, 210Pb 0.4 mBq/kg.

The low energy part of the spectrum (below 200 keV) can be explained by the PMT noise, residual background, or events in the 116CdWO4 scintillators with small admixture of the plastic light guide pulses (which were not discriminated by the pulse-shape analysis), decays of Th and U daughter nuclides located inside defects or inclusions of the crystals (in that case alpha particles can lose a part of their energy without scintillation light emission), etc.
Lastly, a small peak is visible in the spectrum of Fig. 6 at the energy around 300 keV. Since the 2.46 MeV peak of 180W is expected at keV (with FWHM = keV), and because the position of peak of 232Th (with the lowest energy of 4.0 MeV among all emitters from U/Th families) must be at 600 keV, it is unlikely that this small peak can be attributed to origin other than decay of 180W. However, because a platinum crucible was used for the growth of our crystals, we analyze the possible imitation of the effect by activity of 190Pt (abundance of 190Pt is 0.014% [3], .51 yr, = 3164(15) keV [21] or keV in scale). Calculation shows that the detected peak can be caused by platinum pollution (homogeneously spread in the volume of the 116CdWO4 scintillators) at the level of ppm. To estimate the actual platinum contamination in cadmium tungstate crystals, the results of previous low background measurements performed by the Milano-Kiev collaboration with the CdWO4 crystal999This crystal was produced in the same apparatus as enriched ones. of 58 g [22] were considered. This experiment has been carried out in the Gran Sasso Underground Laboratory, and CdWO4 crystal was used as a low temperature (25 mK) bolometer. Energy resolution (FWHM) of the detector was equal to 5 keV at 2.6 MeV. No events were registered in the energy region of keV during 340 h, which allows us to set bound on the 190Pt activity. In accordance with [23, 24] it yields 1.3 counts as limit for number of events, which can be excluded with 68% C.L., hence one can set a bound for platinum concentration in cadmium tungstate crystal as 1.2 ppm. Besides, two samples of CdWO4 crystal with dimensions 1.51.51 cm were searched (with the help of the electron microscope) for inclusions, whose elemental composition is different from that of CdWO4. With this aim flat surface (2 cm2) of each sample was scanned, and if such an inclusion was observed, the electron beam was concentrated on it and the emitted X rays were analyzed with a crystal spectrometer (energy resolution is better than 0.1 eV) tuned on a characteristic platinum X rays. For any observed inclusions (with diameters in the range 2–30 m) no emission of platinum X rays was found. It results in conclusion that limit (95% C.L.) on platinum concentration in CdWO4 crystal is lower than 0.1 ppm (or 0.03 ppm) for Pt inclusions with diameters less than 5 m (or 3 m). Similar analysis performed with the small sample (3 cm in diameter) of the enriched 116CdWO4 crystal gives even more stringent restrictions101010Due to larger scanned area and better spatial resolution of the electron microscope used in this case.: 0.07 ppm (or 0.02 ppm).
Therefore, one can conclude that all bounds obtained for homogeneous Pt contaminations in the CdWO4 crystals are well below the level of 3 ppm, at which peak of 180W could be imitated. Moreover, it is also known that in crystals, which were grown in platinum crucible, Pt is not distributed homogeneously, but it is present in form of precipitates with size around 20 m [25], hence a broad energy distribution instead of an peak would be observed. The latter was proved by our Monte Carlo simulation of the 190Pt decays in CdWO4 crystal with the help of the GEANT and event generator DECAY4 [26]. It gives that effect of 180W activity could be imitated by 190Pt alpha decays only in the case of platinum particles of m size, with Pt average concentration in the crystals at the level of ppm, which is much larger than our experimental limits.
Nevertheless, because it is impossible to exclude (at least in principle) some other explanations of the 300 keV peak in the background spectrum, we can treat our experimental result only as the first indication for the possible decay of 180W. Obviously, final confirmation of its existence would be obtained with the help of CdWO4 crystals enriched/depleted in 180W. However, it is clear that preparation and performance of such a measurement would require a strong additional efforts and perhaps a long time.
3.2 Alpha activity of 180W and other tungsten isotopes
Assuming that observed peak at the energy around 300 keV is really caused by decay of 180W, let us estimate its half-life. With this aim the experimental spectrum in the energy region of interest was fitted by a Gaussian distribution (FWHM = keV), which represents the effect, and by the background model. The latter was built up as a sum of the peak of 232Th and exponential function. Position and area of the searched peak, the thorium peak area, and constants of the exponent were taken as free parameters of the fit procedure, which was performed in the energy region (14020) (51030) keV. The best fit (/n.d.f. = 0.52) achieved in the interval keV (see Fig. 8) gives the area of the searched peak 6426 counts and its position at 32615 keV. Therefore, measured energy of 180W alpha particles is keV, which is in a reasonable agreement with the theoretical value =2460 keV. Taking into account number of 180W nuclei in the crystals (71) and the total efficiency (47%), we get the corresponding half-life value: W) = 1(stat)(syst) yr. The systematic error is related mainly with an uncertainty of the background model.
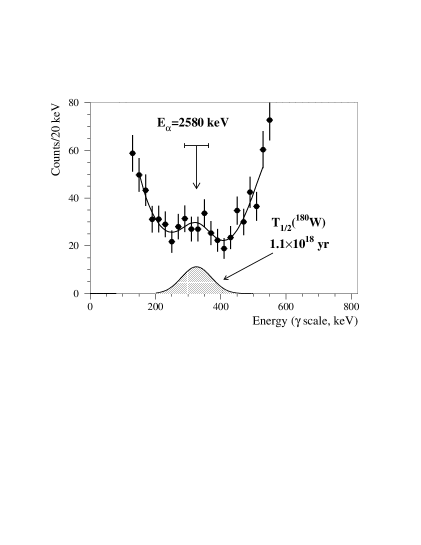
In more conservative approach we use results of our fit in order to set the upper limit on half-life of 180W: lim W) 0.7 yr at 90% C.L.111111Similar bound 1 yr at 90% C.L. can be extracted from the mentioned measurements (340 h) with the CdWO4 crystal of 58 g used as a low temperature bolometer [22], where no events were observed within the energy interval 251630 keV.
In addition, since there are no structural features in the experimental spectrum, which could indicate an activity of other tungsten isotopes, half-life bounds for these processes were estimated. The numbers of candidate nuclei in the detector with mass of 330 g are: 182W – 51023, 183W – 31, 184W – 81, 186W – 561. The position of peak in the equivalent scale, the expected peak width and the efficiency of the pulse-shape analysis are: 182W (5 keV; FWHM keV; = 35%), 183W (6 keV; FWHM keV; ), 184W (204 keV; FWHM keV; ), 186W (734 keV; FWHM keV; ). Fitting the experimental spectrum by sum of expected peak and background model (exponential function plus peaks of 180W and 232Th) we get the following half-life limits (at 90% C.L.):
W71 yr, W81 yr,
W81 yr, W71 yr.
The obtained experimental results for activity of naturally occurring tungsten isotopes are summarized in Table.
3.3 Comparison with theory
To our knowledge, there is only one theoretical work, based on the microscopical approach, in which the half-life for decay of 180W was calculated [27]. It takes into account the systematic behaviour of the reduced widths of even-even nuclei with numbers of neutrons and protons , and penetration factors obtained from realistic cluster wave functions. The derived result is: = 51 yr and uncertainty of this value is estimated as less than a factor of 3 [27]. For other tungsten isotopes theoretical predictions are absent.
We have calculated the half-lives of all W isotopes for decay, first, with the help of the cluster model [7], which was very successful in describing the decays of even-even nuclei. For example, it reproduces the values mainly within a factor of 2 for a wide range of nuclides (from Te to Hs) and for from s to yr. Because decays of natural W isotopes (except 183W) occur without changes in nuclear spin and parity, we have chosen a set of 17 nuclides (from Nd to Cm) with yr [28], whose decays also proceed without changes in nuclear spin and parity. While comparing a theory with an experiment, it is practical to use the value of the deviation , where . For the chosen set of nuclides the cluster model [7] gives a quite reasonable average value of 9. Then, half-lives for W isotopes were calculated with the help of the cluster model [7] and obtained results are listed in Table (given uncertainties are related only with uncertainties of ). In particular, W) 8.31 yr, that is very close to the value of 51 yr derived in [27].
Semiempirical relationships are often more effective in the prediction of than microscopically based calculations. We found in the literature [8, 29, 30, 31, 32, 33, 34, 35, 36, 37] 18 semiempirical formulae which can be used for our purpose. All of them were also tested with the same set of 17 nuclides with yr. The best result (average deviation of the calculated values from experiment ) was found for the relationship of [8] based on phenomenological fission theory of decay and valid not only for even-even but also for odd-even, even-odd and odd-odd nuclei. The values of obtained in such approach for W isotopes are given in Table, where uncertainties are caused, as in the previous case, by uncertainties of . For the 183W decay it was also taken into account that change in parity will additionally suppress the decay rate as compared with that of [8]. For 180W our result .01 yr is also close to that of [27].
Thus, we can conclude that half-life value ( = 1.11 yr) for possible decay of 180W (indication for which is observed in present work) is in a good agreement with the theoretical predictions: 751 yr (microscopic approach [27]), and calculated here on the basis of semiempirical formula [8] and cluster model [7] as 01 yr and 31 yr, correspondingly.
4 CONCLUSIONS
In the present work the pulse shape and ratio of the CdWO4 crystal scintillators have been studied for three directions of the collimated beam of particles relatively to the main crystal axes in the energy range of MeV. The dependences of ratio and pulse shape on the direction of irradiation have been found and measured.
By using the super-low background 116CdWO4 crystal scintillators, the indication for the decay of natural tungsten isotope 180W was observed for the first time. The measured half-life = 1(stat)(syst) yr is close to the theoretical predictions, and it would be the most rare decay ever observed in nature. More conservatively our result can be treated as the lower limit on half-life of 180W: lim (180W) 0.7 yr at 90% C.L. Besides, new bounds have been set for decay of 182W, 183W, 184W and 186W at the level of )1 yr. All these limits are higher than those obtained in previous work [6] and are the most stringent bounds on for any decaying nuclides.
To confirm existence of activity of 180W, we are preparing measurements with other tungsten containing crystal scintillators: CdWO4 (whose scintillation characteristics are better than those of currently used crystals), CaWO4, and ZnWO4. Observation of the decay of 180W could be also checked with these crystals as bolometers [22, 38] and, apparently, sensitivity of such experiments would be enhanced by using crystals enriched/depleted in 180W.
5 Acknowledgments
The authors would like to thank Dr. Filippo Olmi for the electron microscope measurements of the platinum contaminations in the CdWO4 crystal and Dr. Mykola Petrenko for the similar measurements performed with the enriched 116CdWO4 crystal.
References
- [1] G. Audi, A.H. Wapstra, Nucl. Phys. A 595 (1995) 409.
- [2] W. Porschen, W. Riezler, Z. Naturforsch. 8a (1953) 502; 11a (1956) 143.
- [3] K.J.R. Rosman, P.D.P. Taylor, Pure and Appl. Chem. 70 (1998) 217.
- [4] G.B. Beard, W.H. Kelly, Nucl. Phys. 16 (1960) 591.
- [5] R.D. Macfarlane, T.P. Kohman, Phys. Rev. 121 (1961) 1758.
- [6] A.Sh. Georgadze et al., JETP Lett. 61 (1995) 882.
- [7] B. Buck, A.C. Merchant, S.M. Perez, J. Phys. G 17 (1991) 1223.
- [8] D.N. Poenaru, M. Ivascu, J. Physique 44 (1983) 791.
- [9] P.G. Bizzeti et al., Proc. 51 Meeting on Nucl. Spectroscopy and Nucl. Structure, Sarov, Russia, Sept. 3–8, 2001, Bull. Russ. Acad. Sci., Ser. Phys. 66 (2002) 630 (in Russian).
- [10] F.A. Danevich et al., Phys. Rev. C 62 (2000) 045501; P.G. Bizzeti et al., Nucl. Phys. B (Proc. Suppl.) 110 (2002) 389.
- [11] Yu.G. Zdesenko et al., Proc. 2nd Int. Symp. Underground Physics, Baksan Valley, USSR, August 17–19, 1987. – Moscow, Nauka, 1988, p. 291.
- [12] F.A. Danevich et al., Phys. Lett. B 344 (1995) 72.
- [13] T. Fazzini et al., Nucl. Instr. Meth. A 410 (1998) 213.
- [14] J.B. Birks, Theory and Practice of Scintillation Counting, Pergamon, New York, 1967.
- [15] GEANT, CERN Program Library Long Write-up W5013, CERN, 1994.
- [16] F.A. Danevich et al., Nucl. Phys. A 694 (2001) 375.
- [17] J.C. Barton, J.A. Edgington, Nucl. Instr. Meth. A 443 (2000) 277.
- [18] D.R. Tovey et al., Phys. Lett. B 433 (1998) 150.
- [19] E. Gatti, F. De Martini, Nuclear Electronics 2, IAEA, Vienna, 1962, p. 265.
- [20] F.A. Danevich et al., Phys. At. Nucl. 59 (1996) 1.
- [21] Table of isotopes, ed. by R.B. Firestone et al., 8th ed., John Wiley & Sons, New York, 1996.
- [22] A. Alessandrello et al., Nucl. Instr. Meth. A 344 (1994) 243; Nucl. Phys. B (Proc. Supll.) 35 (1994) 394.
- [23] D.E. Groom et al., Eur. Phys. J. C 15 (2000) 1.
- [24] G.J. Feldman, R.D. Cousins, Phys. Rev. D 57 (1998) 3873.
- [25] B.C. Grabmaier, IEEE Trans. Nucl. Sci. NS-31, No. 1 (1984) 372.
- [26] O.A. Ponkratenko et al., Phys. At. Nucl. 63 (2000) 1282.
- [27] B. Al-Bataina, J. Janecke, Phys. Rev. C 37 (1988) 1667.
- [28] National Nuclear Data Center, BNL, USA; www.nndc.bnl.gov/nndc/nudat.
- [29] D.N. Poenaru et al., At. Data Nucl. Data Tables 34 (1986) 423.
- [30] P.O. Froman, Mat. Fys. Sk. Dan. Vid. Selsk. 1 (1957) 3.
- [31] A.H. Wapstra et al., in Nuclear Spectroscopy Tables, 1959.
- [32] R. Taagepera, M. Nurmia, Ann. Acad. Sci. Fenn. Ser. A 78 (1961).
- [33] V.E. Viola, jr., G.T. Seaborg, J. Inorg. Nucl. Chem. 28 (1966) 741.
- [34] K.A. Keller, H. Munzel, Z. Phys. 255 (1972) 419.
- [35] P. Hornshoj et al., Nucl. Phys. A 230 (1974) 365.
- [36] B.A. Brown, Phys. Rev. C 46 (1992) 811.
- [37] P. Moller et al., At. Data Nucl. Data Tables 66 (1997) 131.
- [38] M. Sisti et al., Nucl. Instr. Meth. A 444 (2000) 312.