The significance of the fragmentation region in ultrarelativistic heavy ion collisions
Abstract
We present measurements of the pseudorapidity distribution of primary charged particles produced in collisions at three energies, , 130, and 200 GeV, for a range of collision centralities. The centrality dependence is shown to be non-trivial: the distribution narrows for more central collisions and excess particles are produced at high pseudorapidity in peripheral collisions. For a given centrality, however, the distributions are found to scale with energy according to the “limiting fragmentation” hypothesis. The universal fragmentation region described by this scaling grows in pseudorapidity with increasing collision energy, extending well away from the beam rapidity and covering more than half of the pseudorapidity range over which particles are produced. This approach to a universal limiting curve appears to be a dominant feature of the pseudorapidity distribution and therefore of the total particle production in these collisions.
The strong interaction, described by Quantum Chromodynamics (QCD), may be studied under conditions of high parton density and high energy density, using ultrarelativistic heavy ion collisions. The high density regime of QCD is sensitive to nonlinear dynamics and nonperturbative effects, including parton saturation, the onset of color deconfinement and chiral symmetry restoration. More specifically, the pseudorapidity density of charged particles , where , is related to the entropy density at freezeout. It has been demonstrated that the growth with energy of at mid-rapidity is modest compared to the original expectations [1, 2], and provides a strong constraint on the initial state parton density and further particle production during the subsequent evolution of the system. This Letter focuses on particle production away from mid-rapidity, which constrains the collision dynamics more completely.
We have measured the pseudorapidity distribution of charged particles, , over a broad range of for collisions at a variety of collision centralities (impact parameters). These measurements were made for three energies, , 130, and 200 GeV, covering a span of an order of magnitude in the same detector, allowing for a reliable systematic study of particle production with energy in these collisions. The data were taken using the PHOBOS apparatus [3, 4] during the year 2000 and year 2001 runs of the Relativistic Heavy Ion Collider at Brookhaven National Laboratory. The apparatus used in this analysis comprises a set of silicon detectors with nearly complete coverage for , which are used for detecting the charged particles, and plastic scintillator counters, covering , used for triggering. Event selection cuts were made on the plastic scintillators or silicon detectors and also on timing information from the forward hadronic calorimeters, which measure the energy deposited by spectator neutrons.
The pseudorapidity densities were corrected for particles which were absorbed or produced in dead material (primarily the beryllium beampipe or the magnet steel) and for feed-down products from weak decays of neutral strange particles. More details of the analysis procedures leading to the charged particle pseudorapidity density can be found in Ref. [5]. Two improvements in the handling of common mode noise in the silicon detectors have been implemented for this analysis, leading to small changes in the results and to a slight reduction in the systematic errors. First, the event-by-event common-mode noise in the ring detectors () was found to grow with pad size, and the correction scheme was modified to include this effect. This refinement was already in place in Ref. [2]. Second, for very high occupancies, the common mode noise correction in the octagon detector () becomes slightly inaccurate. A comparison of the data from the octagon detector with those from the more highly segmented vertex detector was used to determine a correction factor for this effect as a function of , centrality, and beam energy. This correction was only required near mid-rapidity () for the central data and it was less than 4% everywhere even in the 0–6% centrality bin of the 200 GeV data. For the 6–15% bin of the 200 GeV data and the 0–6% bin of the 130 GeV data, this correction was less than 1% everywhere. For the more peripheral high energy bins and for the 19.6 GeV data, no correction was required.
The centrality of the collision is characterized by the average number of nucleon participants . For the 130 and 200 GeV data sets, this was estimated from the data using two sets of 16 paddle counters covering forward and backward of the interaction point. The truncated mean of the signals in each set of detectors is proportional to the total charged multiplicity in this region of pseudorapidity. In order to extract for a given fraction of the cross-section, we rely on the fact that the multiplicity in the paddles increases monotonically with centrality, but we do not assume that the number of participants is proportional to the multiplicity. The monotonic relationship between the truncated paddle mean and was verified using the neutral spectator energy measured in the forward hadronic calorimeters. For peripheral events, the dominant uncertainty in is given by the trigger efficiency uncertainty. Using several methods, based on the HIJING model [6], we have estimated our minimum-bias trigger efficiency for events with a vertex near the nominal interaction point to be %. The final systematic errors on , ranging from 3–6%, are tabulated in Ref. [7] where this method was outlined in more detail.
At the lowest RHIC energy, 19.6 GeV, the much lower beam rapidity () precludes using the same method of analyzing the trigger counters (). Instead, we construct a different quantity, “EOCT”, which is approximately proportional to the multiplicity: the path-length corrected sum of the energy deposited in the octagon (silicon) detector(). In the first step, both HIJING simulations and simple Glauber model [8, 9] Monte Carlo simulations are used to estimate the fraction of the total cross-section () in the triggered sample, as well as to estimate the systematic error. For consistency with the higher energy results, the low tail is assumed to be distributed as in HIJING, leading to %. Once is determined, cuts are made in EOCT in a similar way as with the paddle signal to extract for a chosen fraction of the total cross-section [7]. As with the paddle signal, we only assume that EOCT is monotonic with , not that it is proportional to it. The values and the estimated systematic uncertainty for various centrality bins in the 19.6 GeV data are given in Table I.
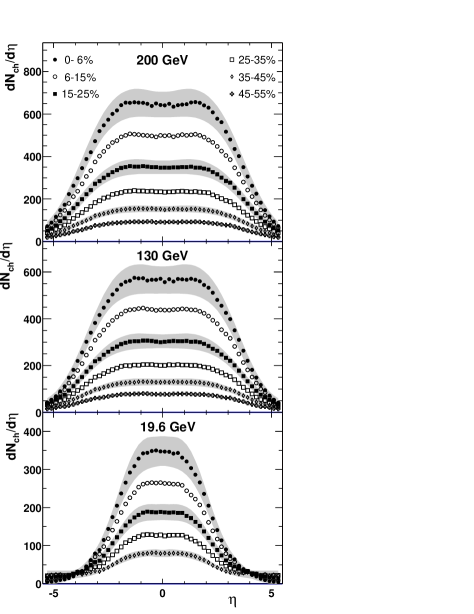
Figure 1 shows the charged particle pseudorapidity distributions () measured at 200, 130, and 19.6 GeV for different centrality bins for . The statistical errors are comparable to the size of the data points. The 90% confidence-level systematic errors are shown as a gray band for selected, but typical, centrality bins.
Due to the large coverage in , is measured over almost the full range, except for a small missing fraction at very high . Using data at lower energy (see Figure 2), this fraction is estimated to be less than 2% for the 130 and 200 GeV central (0–6%) results. Table II lists the integrated charged multiplicity for three energies in different ranges of . The fiducial range is quoted for easier comparison to data from the BRAHMS experiment [10, 11]. After correcting for the slight differences in centrality binning, the BRAHMS data for 130 and 200 GeV are each % below the results quoted here, consistent within the quoted errors of both experiments. The remaining columns show the result in the fiducial range of PHOBOS, and the total inferred .
To separate the trivial kinematic broadening of the distribution from the more interesting dynamics, the data for collisions at different energies can be viewed in the rest frame of one of the colliding nuclei. Such an approach led to the ansatz of “limiting fragmentation” [12], which successfully predicted the energy dependence of particle production away from mid-rapidity in hadron collisions, including [13]. This ansatz states that, at high enough collision energy, both and the mix of particle species (and therefore also ) reach a limiting value and become independent of energy in a region around , where and rapidity .
Figure 2a shows the scaled, shifted pseudorapidity distributions for central collisions which span a factor of ten in collision energy (). The distributions are scaled by to remove the effect of the different number of nucleons participating in collisions with different centralities. The results are folded about mid-rapidity (positive and negative bins are averaged). The distributions are observed to be independent of collision energy over a substantial range. This is consistent with and extends a similar observation made by BRAHMS [11] over a more restricted range. Both the 19.6 and 130 GeV data reach 85–90% of their maximum value before deviating significantly (more than 5%) from the common limiting curve. These data demonstrate that limiting fragmentation applies well in the system and that the “fragmentation region” is rather broad, covering more than half of the available range of over which particles are produced. In particular, the fragmentation region grows significantly between 19.6 GeV and 130 GeV, extending more than two units away from the beam rapidity. A similar effect was observed in collisions, over a range of from 53 to 900 GeV [13]. In both cases, particle production appears to approach a fixed limiting curve which extends far from the original beam rapidity, indicating that this universal curve is an important feature of the overall interaction and not simply a nuclear breakup effect. This result is in sharp contrast to the boost-invariance scenario [14] which predicts a fixed fragmentation region and a broad central rapidity plateau that grows in extent with increasing energy.
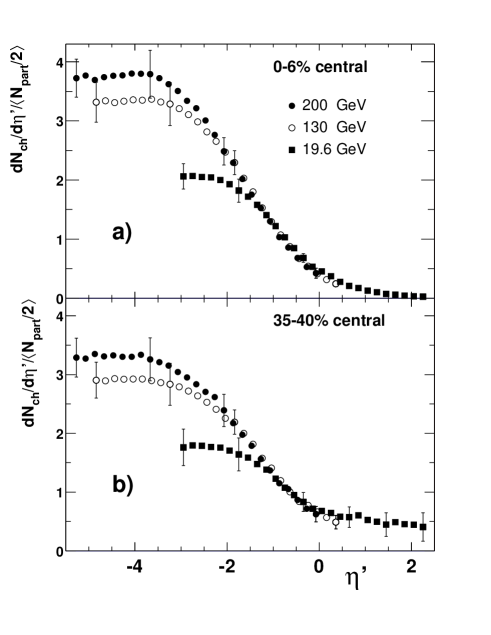
Figure 2b shows the scaled pseudorapidity distributions for a set of non-central collisions, which also exhibit limiting fragmentation over a broad range of . These results also show that the extent of the fragmentation region is nearly independent of centrality.
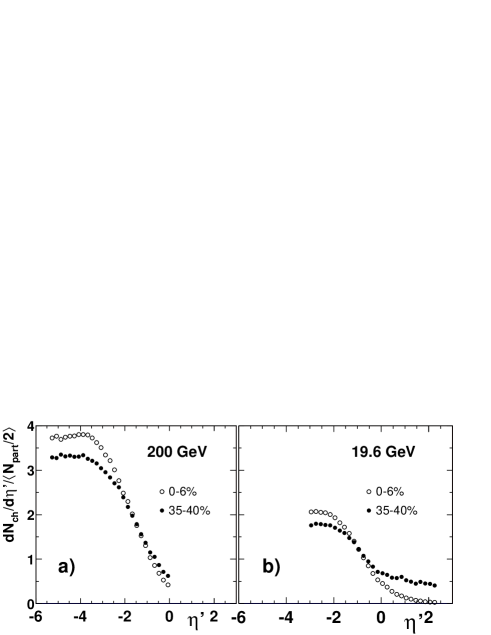
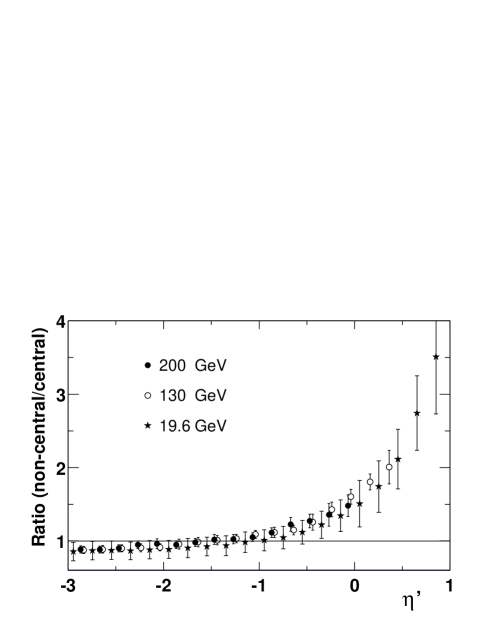
Figure 3 shows the centrality dependence of the distribution at the two extreme energies: 19.6 and 200 GeV. These data demonstrate that the result in the fragmentation region changes significantly with centrality. Figure 4 shows the ratio of non-central to central data with (90% C.L.) systematic errors included. The error in the ratio involves a partial cancellation of the systematic errors in the individual measurements. For , the scaled pseudorapidity density actually grows in the peripheral data with respect to the more central data. This effect has already been observed for collisions at 130 GeV [5] and for collisions at 17 GeV [15], and is confirmed here for at 19.6 and 200 GeV. This contradicts the suggestion, put forward in references [10, 11], that the limiting curve for particle production in the fragmentation region is independent of centrality as well as of energy. It should be noted that the hypothesis of limiting fragmentation does not imply that the limiting curve is independent of centrality, just that is energy-independent for a fixed centrality, once at sufficiently high energy.
The strong centrality dependence seen in Figure 3 has two features: an excess of particles at high in peripheral events and a narrowing of the overall pseudorapidity distribution, perhaps caused by a shift of particles from high toward mid-rapidity for more central collisions. The excess of particles at high can be most easily seen in Figure 1, where, for the 19.6 GeV data, the absolute yield of charged particles actually grows for non-central collisions. It should be noted that the very peripheral limit of a collision is not an collision, but rather an collision with two large excited nuclear remnants, one of which is at . The increased particle production near due to the nuclear remnants has been studied in collisions [16] and for lower energy collisions [15]. The narrowing of the overall distribution may be due to dynamical effects, such as baryon stopping [17], or kinematic effects, such as a shift in (for fixed ) due to the particle mix ( ratio) changing with centrality. This narrowing of the distribution can be characterized as an increase at mid-rapidity [7, 18] with an approximately compensating reduction at high .
In summary, we have performed a comprehensive examination of the pseudorapidity distributions of charged particles produced in collisions at RHIC energies from to 200 GeV, including an estimate of the full charged particle multiplicity at three energies. For central collisions at the highest energy, we find that a total of more than 5000 charged particles are produced. These results span eleven units of pseudorapidity, a factor of ten in energy, and a factor of five in — all measured in a single detector. The data show a number of interesting features. First, limiting fragmentation (energy independence of ) is valid over a large range of . Second, the scaled shape is not independent of centrality at high . The distribution is broader in peripheral collisions than in central collisions. Third, as in collisions, the fragmentation region in collisions grows in pseudorapidity extent with beam energy, becoming a dominant feature of the pseudorapidity distributions at high energy.
Acknowledgements: We would like to thank the management of BNL and the C-A department for providing the variety of collision energies at RHIC which made this work possible. This work was partially supported by US DoE grants DE-AC02-98CH10886, DE-FG02-93ER40802, DE-FC02-94ER40818, DE-FG02-94ER40865, DE-FG02-99ER41099, W-31-109-ENG-38, and NSF grants 9603486, 9722606 and 0072204. The Polish groups were partially supported by KBN grant 2-P03B-10323. The NCU group was partially supported by NSC of Taiwan under contract NSC 89-2112-M-008-024.
REFERENCES
- [1] B. B. Back et al., Phys. Rev. Lett. 85, 3100 (2000).
- [2] B. B. Back et al., Phys. Rev. Lett. 88, 22302 (2002).
- [3] R. Nouicer et al., Nucl. Instrum. Methods. A461, 143 (2001).
- [4] B. B. Back et al., Nucl. Phys. A698, 416c (2002).
- [5] B. B. Back et al., Phys. Rev. Lett. 87, 102303 (2001).
- [6] M. Gyulassy and X. N. Wang, Phys. Rev. D44, 3501 (1991).
- [7] B. B. Back et al., Phys. Rev. C65, 061901R (2002).
- [8] W. Czyz, L. C. Maximon, Annals Phys. 52, 59 (1969).
- [9] R. J. Glauber, G. Matthiae, Nucl. Phys. B21, 135 (1970).
- [10] I. G. Bearden et al., Phys. Lett. B523, 227 (2001).
- [11] I. G. Bearden et al., Phys. Rev. Lett. 88, 202301 (2002).
- [12] J. Benecke, T. T. Chou, C-N. Yang, E. Yen, Phys. Rev. 188, 2159 (1969).
- [13] G. J. Alner et al., Z. Phys. C33, 1 (1986).
- [14] J. D. Bjorken, Phys. Rev. D27, 140 (1983).
- [15] P. Deines-Jones et al., Phys. Rev. C62, 014903 (2000). (1983) 2580.
- [16] J. E. Elias et al., Phys. Rev. Lett. 41, 285 (1978).
- [17] W. Busza and A. S. Goldhaber, Phys. Lett. B139, 235 (1984).
- [18] B. B. Back et al., Phys. Rev. C65, 031901R (2002).
| Centrality | Centrality | ||
| 0–3%: | 20–25%: | ||
| 3–6%: | 25–30%: | ||
| 6–10%: | 30–35%: | ||
| 10–15%: | 35–40%: | ||
| 15–20%: | |||
| 0–6%: | 15–25%: | ||
| 6–15%: | 25–35%: |
| 19.6 GeV | |||
|---|---|---|---|
| 130 GeV | |||
| 200 GeV |