Calculation of the Ultracold Neutron Upscattering Loss Probability in Fluid Walled Storage Bottles using Experimental Measurements of the Liquid Thermomechanical Properties of Fomblin
Abstract
Presently, the most accurate value of the free neutron beta-decay lifetime result from measurements using fluid-coated ultacold neutron (UCN) storage bottles. The purpose of this work is to investigate the temperature dependent UCN loss rate from these storage systems.
To verify that the surface properites of Fomblin films are the same as the bulk properties, we present experimental measurements of the properties of a liquid “Fomblin” surface obtained by the quasielastic scattering of laser light. The properties include the surface tension and viscosity as functions of temperature. The results are compared to measurements of the bulk fluid properties.
We then calculate the upscattering rate of UCN from thermally excited surface capillary waves on the liquid surface and compare the results to experimental measurements of the UCN lifetime in Fomblin fluid-walled UCN storage bottles, and show that the excess storage loss rate for UCN energies near the Fomblin potential can be explained. The rapid temperature dependence of the Fomblin storage lifetime is explained by our analysis.
pacs:
14.20.Dh,61.12.-q,03.75-bI Introduction
The concept of a fluid-walled ultracold neutron (UCN) storage bottle is due to C. Bates bates who developed and demonstrated the technique at the Risley reactor in the U.K. The basic idea is that a hydrogen-free fluorinated oil (Fomblin) wets glass and metal surfaces, and thereby produces a clean, chemically perfect, microscopically flat and reproducible UCN reflecting surface. Fomblin is quite viscous at room temperature; when it is sprayed onto surfaces, it drains away leaving a thin stable film. The fluid readily seals gaps and holes associated with UCN entrance and exit valves, provided that the mechanical parts fit rather closely. Fomblin also has a very low vapor pressure. Some of the most accurate determinations of the neutron decay lifetime have been obtained with Fomblin-walled storage cells. mampe ; arzu
There is some uncertainty in the chemical formula of Fomblin Y Vac 18/8 (manufactured by Ausimont/Montedison Group), the material most widely used in UCN storage experiments. The mean molecular weight is 2650, and the stoichiometry is roughly , with density at 20∘ C of 1.89 g/cc, with a mean effective UCN potential of neV. The UCN loss coefficient (ucnbook , Eq. (2.66)) is given by the ratio of the imaginary to real part of the effective UCN potential,
where is the total loss cross section for neutrons with wavenumber , and is the coherent scattering length. has contributions from nuclear absorption and bulk process, e.g. upscattering which occurs for temperature . For the range of formulae for Fomblin given in fomform , the possible values of due to nuclear absorption lie in the range
| (1) |
The uncertainty in the Fomblin molecular formula given in fomform is a result of the coherent scattering lengths of C, F, and O being quite similar (6.65, 5.60, 5.81 fm, respectively) so the effective UCN potential is relatively insensitive to the relative numbers of each atomic species. On the other hand, the nuclear absorption cross sections of C, F, and O are quite different (3.5, 9.6.5, 0.19 mb, respectively, for thermal (2200 m/s) neutrons). Thus, the stoichiometry of Fomblin could be better determined by simultaneously considering extrapolated to , which is quite sensitive to the atomic fraction of F because it has a comparatively larger absorption cross section, and which cannot be used to effectively determine the relative amounts of F and O.
For experiments operated near room temperature (290 K - 320 K), it is found that
| (2) |
and the temperature dependence of is much faster than being proportional to or as might be expected due to atomic and molecular fluctuations in the wall (see, e.g., ucnbook , Sec. 2.4.6) , and if fact seems to follow the viscosity temperature dependence rather closely. Some attempts were made to explain the observed temperature dependence of . For example, if there is a cross section for slow neutrons due to upscattering in the fluid, this cross section can be used to modify to include this loss mechanism and in this regard, the transmission of 60 Å neutrons through a sample of Fomblin as a function of sample temperature was measured ruddies . These measurements are discussed in mampe where it is stated that the temperature dependence of comes within a factor of 1.5 of explaining the experimentally observed temperature dependence of the loss rate. The loss rate for the lowest temperature 218 K moroz implies which is still an order of magnitude greater than Eq. (1). More recent measurements by by Morozov et al. of the transmission of 9 m/s neutrons through a 4 mm thick sample as a function of temperature are consistent with these results moroz2 .
It is possible that has contributions from different sources. The purpose of our work reported here is to evaluate the upscattering loss of UCN due to thermally excited surface capillary waves. Pokotilovski has investigated the energy broadening of (monochromatic) UCN stored in a fluid walled bottle poko1 ; poko2 ; this is a question closely related to the upscattering loss, but it seems to us that the temperature dependent loss rate is an experimentally better studied phenomenon but is lacking a fundamental explanation. The principal data we will address were obtained by Richardson et al. dave .
II Experimental Determination of the Thermomechanical Properties of Fomblin Y Vac 18/8
Although the properties of this material are available from the manufacturer, we thought it prudent to perform measurements ourselves under conditions similar to those used in an experiment. The sample of Fomblin Y Vac 18/8 (hereafter referred to as Fomblin) was obtained from that used in mampe . These is anecdotal evidence that the viscosity changes for degassed samples in vacuum compared to samples that have been stored a long time in air. We therefore performed our measurements with the Fomblin under vacuum when possible, with the material being introduced into the various apparatuses to be discussed by distillation under high vacuum ( torr).
These measurements were done in Aug. 1991; some details were lost (e.g., specific equipment models employed) but given the modest accuracy of the results, these details are not important.
II.1 Mechanical Viscosity Measurement
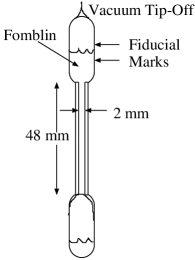
The viscosity was determined by the time it took for a known volume of Fomblin to drain through a Pyrex capillary of known length and diameter, under the influence of gravity. The glass system comprising two relatively large volumes connected by a capillary is shown in Fig. 1. Marks were placed on the large tubes corresponding to a volume cm3. The capillary diameter was mm, with length 4.8 cm.
Fomblin was distilled into the glass measurement apparatus under high vacuum; the glass was sealed off from the vacuum system, and the time to drain the known volume was measured as a function of temperature, with the temperature determined by a water bath. The kinematic viscosity is given by (ll , Eq. (17.10))
| (3) |
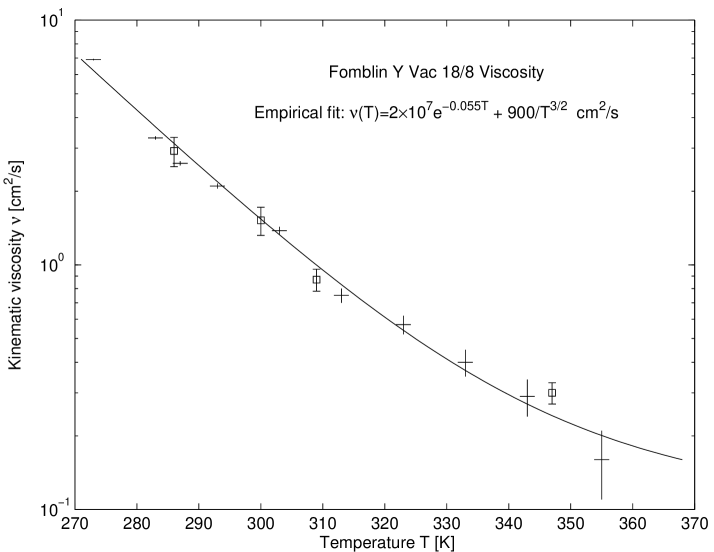
where is the kinematic viscosity, the acceleration of gravity, is the known volume, is the time to drain the known volume, and is the capillary radius. The time to drain the volume varied from about 150 sec at the lowest temperatures, to about 2 sec at the highest temperatures; at the lowest temperatures, the constancy and value of the temperature was the major uncertainty ( K), while at the high temperatures, the timing (to 0.1 sec accuracy) was the principal limitation to the accuracy. In addition, there is a small correction associated with the change in height of the liquid layer as the Fomblin drains, but it is less than 5%. The results are shown in Fig. 2 and are in good agreement with, and follow the trends of, values reported by the manufacturer (1.9, .09, and .02 cm2/s at 293, 393, 493 K respectively). In the range of measurements, the viscosity is adequately described to within experimental error by the following empirical formula:
| (4) |
where is in cm2/s, and is measured in K, with estimated accuracy over the temperature range 280-308 K which will be used later.
II.2 Thermal Expansion
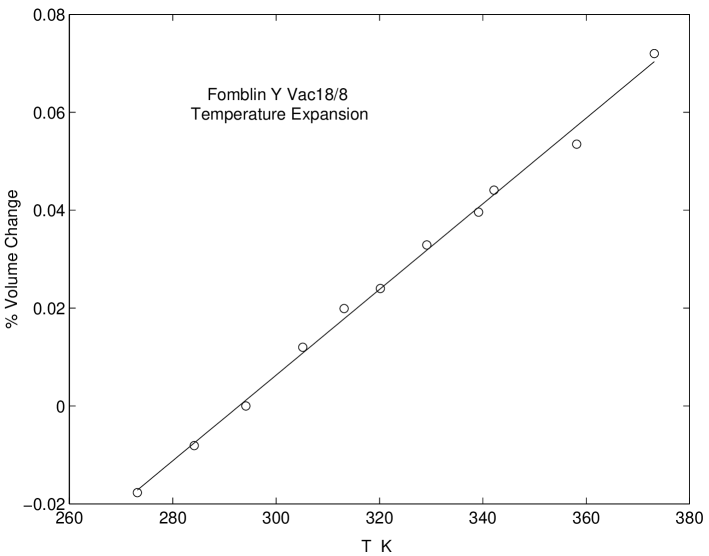
Fomblin was distilled into a Pyrex capillary tube of 2 mm inside diameter, filling the tube to a length of about 5 cm. The tube was sealed off from the vacuum system, and the relative change in length of the sample as a function of temperature was measured. The results are shown in Fig. 3; the principal limits to accuracy were the length measurement ( mm) and temperature control ( K). The thermal expansion of Fomblin is about 100 times larger than Pyrex, so the expansion of the glass is an insignificant correction. The density as a function of temperature is given by
| (5) |
where is measured in K, and the accuracy of this fit is about 5%. The temperature dependence of the density is particularly important because it leads directly to a temperature dependence of the effective UCN potential. This information was not available from the manufacturer.
II.3 Surface Tension
The surface tension was measured using a Cenco student demonstration tensiometer which in essence measures the restoring force against a length of wire pulled up against the liquid surface. Unfortunately, there was no simple way to perform this measurement on a sample under vacuum. The apparatus was calibrated with deionized water. For Fomblin, the surface tension was found to be
| (6) |
and was independent of temperature to within measurement accuracy. The value quoted by the manufacturer is 20 dyne/cm.
II.4 Liquid Properties by Light Scattering
By use of a heterodyne laser scattering technique, the dynamic liquid surface properties of Fomblin could be measured directly without physically contacting the surface in any significant way. The idea is that the surface undergoes a sort of brownian motion due to thermal fluctuations.
The theory describing the two-dimensional thermally excited surface capillary waves has been developed by Bouchiat and Meunier; when presented as a time and two-dimensional surface Fourier transforms, the mean-square height fluctuations are described by bom
| (7) |
where
| (8) |
| (9) |
where, as before, is the surface tension, is the density, and is the viscosity where is the kinematic viscosity.
Directed laser light reflecting from this surface will be scattered by time-varying surface disturbances, with surface wavevector and frequency . By purposely aiming a fraction of the light specularly reflected from the surface in an angle corresponding to diffraction by a disturbance with wavenumber (the “reference beam”) to the detector, the time-dependent scattered component can be measured by beating with the reference beam. The reference beam is produced by placing a weak transmission diffraction grating in the specularly reflected beam (this grating also intercepts the scattered light which is extremely weak). This technique was proposed and developed by Hård et al. hard The specific apparatus that we used is described in ajp , with the exception of the vacuum sample cell. As discussed in ajp , data was aquired with the apparatus on a vibration isolated optical table. In addition, the vacuum sample cell isolated the liquid surface from disturbing air currents which were a problem for free liquid surfaces in air.
The Fomblin sample was contained under vacuum in a cubical cell; the cell was constructed of 5 mm thick float glass plates, and had internal dimension of 4 cm3, glued together with Torr-Seal Epoxy (Varian). A 5 mm diameter Pyrex tube was glued into a hole drilled in the top plate; Fomblin was distilled into the cell (to a depth of 3 mm) through this tube and then sealed off from the vacuum system.
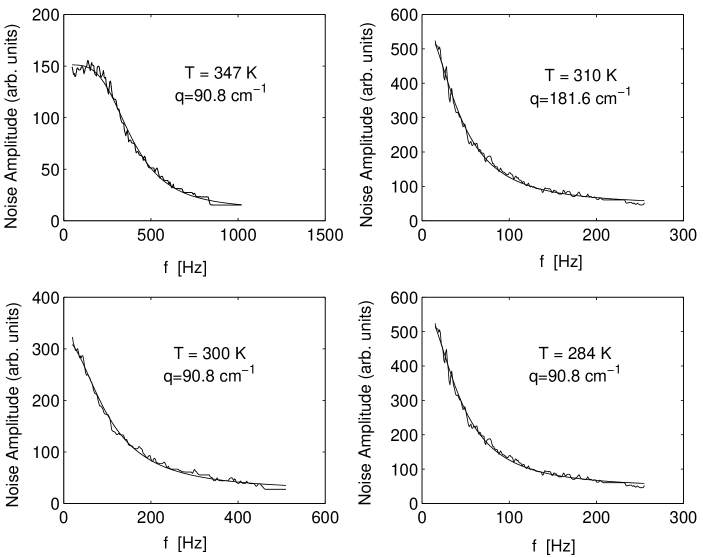
The cube was cooled/heated from the bottom with a Peltier device, and the temperature was controlled with a simple feedback loop. Light was directed onto the liquid surface at an angle of approximately 70∘ from normal through one of the vertical walls of the cell; the scattered and specularly reflected light exited the opposite vertical wall. The laser light was detected with a PIN photodiode, and the heterodyne signal was Fourier analyzed with a Hewlett-Packard audio frequency spectrum analyzer. Results as a function of temperature and are shown in Fig. 4. Also shown are four-parameter fits to Eq. (7); these parameters include , , an amplitude factor, and a DC offset. Results of the fits are given in Table I.
The inferred values of and are also given in in Table I. As can be seen, these results agree with previous mechanical measurements; the values of are plotted in Fig. 2, shown as squares.
III Calculation of the Upscattering Loss Rate due to Thermally-Excited Surface Capillary Waves
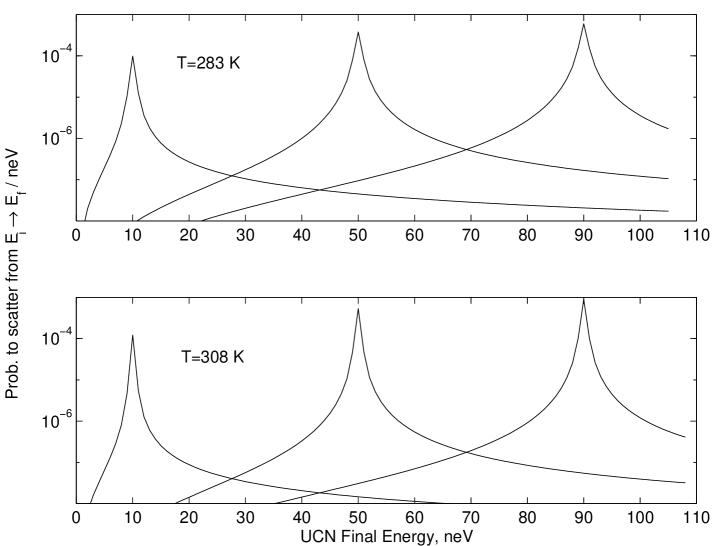
The surface waves described in Sec. II D can inelastically scatter (diffract) a UCN that reflects from the surface. The probability to upscatter a UCN to an energy outside the UCN range can be calculated using Eq. (7) when it is properly normalized. The formalism describing non-specular inelastic scattering was developed by Pokotilovski poko2 and we will use his results with minor modifications.
III.1 Normalization of Eq. (7)
The work of bom was intended to derive the spectrum of the surface fluctuations; the absolute normalization appears to have been of secondary importance. For our case, the overall magnitude is of crucial importance.
First, the static average surface distortion, based on statistical mechanics considerations, is given as
| (10) |
where is the surface area. If we imagine to be a square with dimensions so , the effective spread in and is
| (11) |
and therefore, to cast Eq. (7) per unit , a factor of is required.
Second, the integral of over should give the static result, Eq. (10):
| (12) |
where the integration was performed by noting that the only pole of the integrand is at ; by integrating along the real axis and taking a semicircle around the origin, the integral is times the residue at which is .
III.2 Possible Corrections to Eq. (7)
The coating obtained by spraying Fomblin and allowing the material to drain to a thin, stable film are of order cm thick or greater. The multiplicative correction factor to the capillary wave dispersion relationship, due to finite film thickness, is very roughly proportional to where is the film thickness (ll , Sec. 62, Problem 1). For of interest for UCN scattering, so so we expect no significant effect due to film thickness. However, at higher temperatures where the viscosity is low, the films might drain to layers thin enough so that there is a substantial correction. The net effect will be to reduce the upscatter rate.
We are also considering rather high frequency waves; it might be expected that the Fomblin has some frequency dependence. However, Fomblin appears to be a Newtonian fluid (e.g., light scattering and mechanical measurements had no anomalous behavior) and the Fomblin molecules are not very large on the scale of what is considered a polymer. The molecular collisional frequency of Fomblin molecules, which is on of the factor that determine the viscosity, is much higher than the frequencies of interest for UCN scattering (e.g., Hz compared to more than Hz). For the analysis presented here, we will assume that the low frequency measurements described earlier in this paper are applicable.
III.3 Kinematics
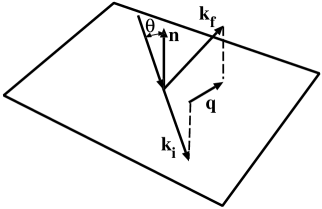
Let us consider an incident neutron with wavevector (we set the azimuthal angle of the incoming wave to zero without loss of generality); referring to Fig. 5,
| (13) |
where the polar angle is defined relative to the surface normal which is taken along , and is the incident UCN energy. The surface wave disturbance can be described by
| (14) |
where is the azimuthal angle relative to the incident neutron momentum.
When a UCN diffracts from the time varying surface, energy and momentum are conserved (we consider first upscattering, e.g., the UCN gains energy).
| (15) |
We can consider a UCN of specified , hence is specified, and choose which determines ; choosing determines and , the polar angles of the outgoing neutron wavevector. The components of the wavevector in the liquid surface plane (denoted by subscript s) change on reflection by
| (16) |
or
| (17) |
For the component of normal to the surface,
| (18) |
where the inequality constrains the values of for allowed scattering. This sets a range on the magnitude of :
| (19) |
In particular, we can define a kinematic factor such that
| (20) |
where is given by Eq. (18).
III.4 Loss Probability per Bounce
The probability of loss per bounce was calculated by Pokotilovski poko2 :
| (21) |
where
| (22) |
with the critical momentum for UCN reflection. This equation results from determining the scattered wavefunction amplitude then calculating the probability current normal to the surface. Pokotilovski was interested in below-barrier upscattering in which case the factor .
In the case where the final UCN energy is higher than the wall potential, some care must be used in calculating the upscatter loss probability. The UCN will be lost from the system if the final neutron energy is greater than the wall potential. This loss has two components: 1. The upscattered reflected wave will be lost from the system, 2. The component of the scattered wave within the wall (film) is not an evanescent wave, but is a propagating wave (e.g., in Eq. (6) of poko2 or Eq. (22) above is imaginary). We must therefore account for this losses for the wave transmitted into the material. Referring to Eqs. (A6.21) and (A6.22) of ucnbook , the amplitudes of the reflected and transmitted upscattered waves are equal. The probability current perpendicular to the liquid surface determines the loss asty , e.g., in Eq. 21 the factor . Thus,
| (23) |
The UCN will be lost from the system if its final energy is greated than the wall potential . We can recast this in terms of allowed wave frequencies: For UCN loss to occur,
| (24) |
where is the incident UCN energy. Thus, there is a minimum for upscattering loss,
| (25) |
The differential probability that a UCN, with , , and specified, is upscattered and lost from the system due to surface waves in a small range around a value is given by
| (26) |
where is a weighting factor giving the probability for a UCN to be incident at angle ,
| (27) |
and .
The total probability for loss is equal to the integral of over and , followed by an integration over , and finally over with ,
| (28) |
where is defined in Eq. (20), and the dependence of on the temperature (due to, e.g., the viscosity and density change of Fomblin) and incident UCN energy and minimum energy to upscatter to greater than are explicitly indicated.
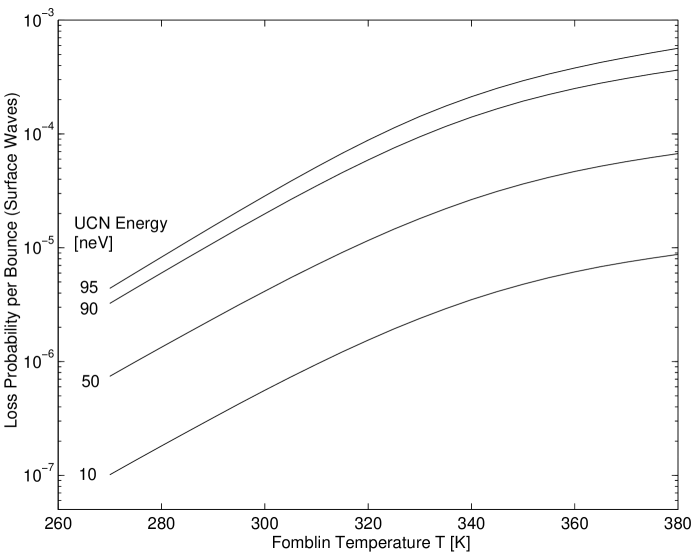
The integration is analytically unwieldy, so it has been performed numerically. The results, taking into account the temperature dependence of the viscosity and density (hence effective UCN potential) of Fomblin are shown in Fig. 6.
The slow curvature with increasing temperature (hence decreasing viscosity) results from the term in Eq. (7), which is proportional to the surface tension, becoming important.
III.5 Reanalysis of Previous Data
It is noted in dave that a simple fit to a value of and to losses through holes and gaps of total area does not explain the observed lifetimes of a fluid-walled bottle for energies within 10 neV of . There is enough flexibility in and to adequately fit the lower values of energy; as seen in Fig. 6, the surface wave upscatter loss probability drops rapidly with energy. However, the temperature variation in as derived from these fits seems non-physical.
In general, a full monte-carlo analysis of the system is required. For example, in a realistic storage system, the weight function Eq. (27) becomes a function of geometry. However, 80% of the UCN loss for Eq. (28) occurs for angles between 20∘ and 60∘, so at the 10-20% level of accuracy, we can neglect modification of the weight function. Furthermore, a full monte-carlo analysis would require knowledge of the liquid surface specularity for UCN reflection which is not known. Another fortunate feature of the Ref. dave measurements is that the cylindrical storage cell height cm leads to a small change in UCN energy as a function of position in the cell (7% effect) that can be modelled, as described below, with 10% accuracy.
For our reanalysis of the Ref. dave experimental data, we use oure experimentally determined values for viscosity (Eq. (4)), density (Eq. (5)), and surface tension (Eq. (6)), and neglect the uncertainties in these values. We fitted the observed lifetime vs. energy data to and was done as in dave , but included all data points and the surface wave upscatter loss described by Eq. (28). However, particularly for close to , we need to take into account the effects of gravity in the storage bottle which was a horizontal cylinder with radius cm and length ). There are two effects that need to be accounted for. First, the upscatter loss function energy dependence is very steep for approching . Second, a UCN that upscatters at the “top” of the storage vessel will gain energy as it falls, and will eventually be lost from the system if the final energy asty . This effect can be modelled by varying in Eq. (28) as a function of height in the bottle.
The total average lifetime for a UCN with initial energy (monochromatic) specified at a horizontal plane that intersects and divides the storage vessel into two halves at the cylinder axis can be readily determined. The rate of loss can be written
| (29) |
where is the neutron beta decay lifetime, is the mean free path,
| (30) |
is magnitude of the UCN velocity at the plane, and is the total loss per bounce averaged over the storage vessel walls. The height-dependent total loss is given by
| (31) |
where is the cylinder polar angle with being the bottom of the storage vessel, and is the material loss term (ucnbook , Eq. (2.70)),
| (32) |
As described in the Introduction, has contributions from both nuclear absorption and upscattering and represents the losses from the UCN evanescent wave within the film during the time of reflection.
The first factor in Eq. (31) expresses the change in wall collision frequency as a function of height and has a 2% effect for . The average of the storage walls is given by
| (33) |
This average was numerically computed and then averaged over with the the energy resolution function given in dave , Eq. (10), to produce total loss curves as a function of temperature ; and are left as fit parameters for a given .
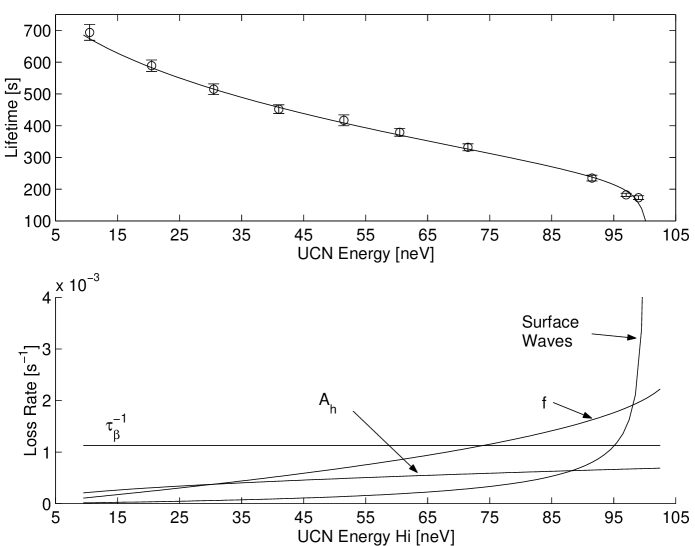
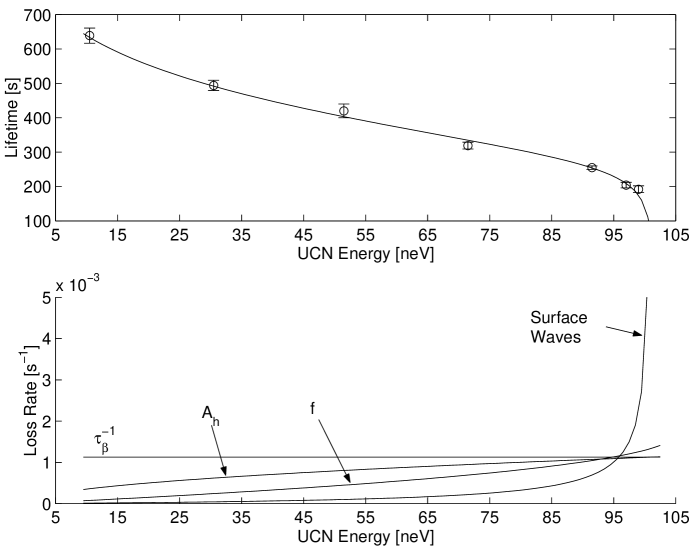
The most extensive data presented in dave is for the temperature K. Including the surface wave upscattering loss and fitting to the two parameters results in an excellent fit, as shown in Fig. 7. The decrease in (see Table II) compared with the fit results presented in dave shows the importance of the surface wave loss for UCN energies near the wall potential. It should be noted that the excess loss is not associated with slow heating of the UCN, as suggested in dave but with a direct upscattering loss. As will be shown in the next section, the heating/cooling effect probably does not alter the functional form shown in Fig. 7.
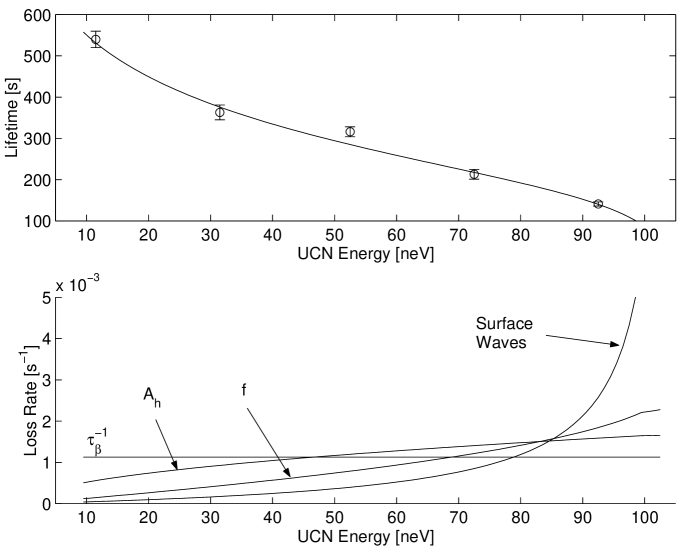
Fits to the 283 K and 308 K data are shown in Figs. 8 and 9, with fit results tabulated in Table II. Again, including the surface wave upscattering loss provides an explanation of the extra loss rate for the higher energy UCN.
It should be noted that the for these fits is extremely sensitive to the energy, e.g., changing the energy for either of the two highest points in Fig. 7 by neV changes by a factor of 0.5 to 2. Therefore, the fact that the spectrum shape can be varying during storage might be evident in the data and analysis, but as can be seen by directly considering Figs. 7-9, the simple analysis presented here is adequate to within statistics, implying an accuracy of 10-20%. Including the uncertainties in the measured Fomblin properties would lead to a modest reduction in .
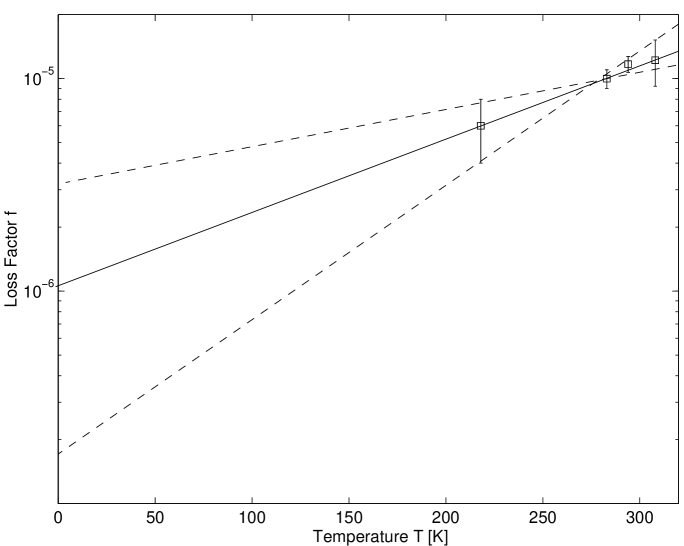
Finally, the values of for the various temperatures shown in Table II indicate a significant temperature dependence. These values, along with the value derived from moroz discussed in the Introduction are plotted in Fig. 10. It can be seen that a crude extrapolation to implies a reasonable range of values for the residual (nuclear absorption) loss.
The observed variation of bottle lifetime as a function of temperature is about 4 s/K mampe ; referring to Fig. 7, the contribution to the loss rate from Eq. (32) is about a factor of two larger than the surface wave loss rate for 70 neV UCN. Interpolating from Fig. 6, the change in is about K for 70 neV with the Fomblin near room temperature, while from Table II varies as K. The variation in with change loss rate(s) can be estimated from Eqs. (27) and (30) (the effect due to the change in the potential from thermal expansion is negligible)
| (34) |
which, for a 20 cm mean free path for 70 neV neutrons, with a storage lifetime of 710 s mampe implies
| (35) |
which is in good agreement with 4 s/K. The surface wave loss amounts to 20% of the net total loss for 70 neV UCN at K. In mampe , it is stated that the observed upscatter loss in the transmission of 60 Å neutrons comes within a factor of 1.5 of explaining the observed loss. Within the approximations here, it would seem that the surface wave scattering can account for most of the excess loss observed in this storage experiment.
III.6 UCN Heating
Heating of UCN occurs when energy is gained as before, but when the final energy is still lower than the wall potential. The calculation is carried out by integrating from near to as defined in relation to Eq. (28). The lower limit is set by the resolution of the measurement apparatus, or, e.g., by the spectral width of the stored nearly monochromatic UCN, taken here as neV, so neV and . The heating probability is thus obtained by modifying Eq. (28) (e.g., the integration over is not performed to get ):
| (36) |
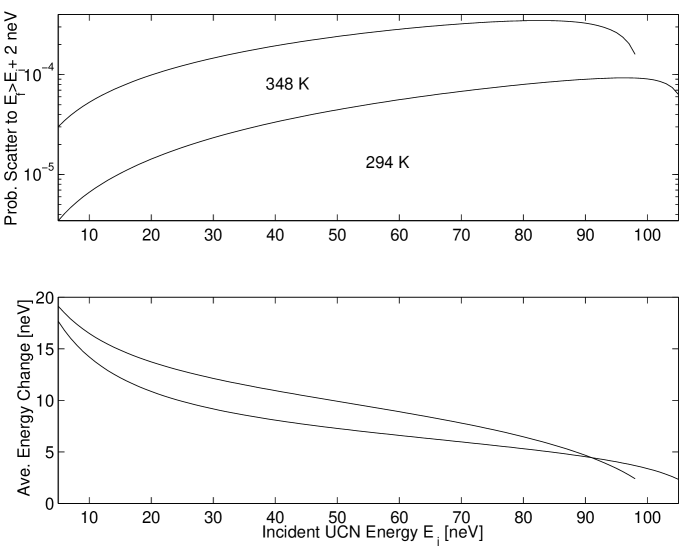
where was defined in relation to Eq. (28) and in this case represents the maximum energy change that a UCN can receive and remain trapped. The average energy change is given by
| (37) |
It is suggested in dave that energy might be transferred to the UCN at a rate of order eV per collision. The numerical results shown in Fig. 11 imply an energy change of around eV per collision, obtained by taking the upscatter probability times the energy change. Of course, very small energy changes (less than the instrumental resolution) are more probable, but many more reflections are needed to move a UCN from the initial energy distribution; the eV/collision provides a reasonable estimate of the heating rate. This result is in agreement with the results of Pokotilovski poko1 ; poko2 and we thus do not further elaborate the heating issue which is more fully discussed by him.
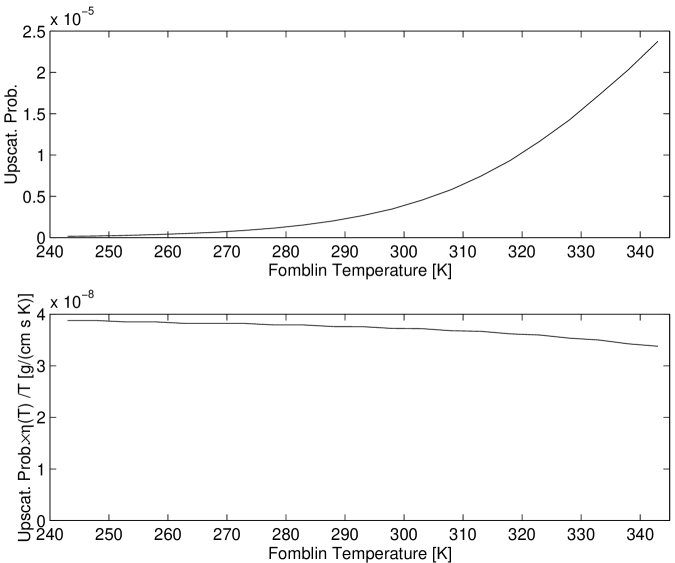
More recent measurements by Bondarenko et al. moroz3 indicate a heating probabilities shown in Table III. In this experiment, UCN in a 0-52 neV energy range were stored in a Fomblin-coated bottle, and upscattering to energies between 52 and 106 neV were detected. To calculate this probability, we assume an initial UCN energies in the 0-52 neV range, and calculate the total probabilities to scatter to the 52-106 neV range, using Eq. (36). The energy-dependent upscatter probabilities are then averaged over the initial spectrum presented in moroz3 , Fig. 5. As presented in Table III, it can be seen that our results are in reasonable agreement with the experimental results, to within the reported factor of 2 to 3 uncertainty associated with neutron transport efficiency in the experimental apparatus. A plot of the upscatter probability as a function of temperature, for the parameters of this experiment, is shown in Fig. 12.
The cooling rate and average energy decrease can be calculated in a similar fashion. In this case, the integration limits of Eq. (36) are 0 and . The probability to upscatter or downscatter is shown in Fig. 13. As discussed by Pokotilovski, the functions are very symmetric about the incident UCN energy, so the effect of a small energy change, either an increase or a decrease, tend to be averaged away.
The measurements by Bondarenko et al. moroz3 also determined the probability for UCN with initial energy around 13 neV, to downscatter to final energy in the range 0-11.5 neV, and found a probability of about per bounce. The temperature of the Fomblin was not specified; however, the measured probability is consistent with the results presented in Fig. 13 where the integrated probability to downscatter from 10 neV initial energy to less than 8.5 neV is in the range for both temperature curves shown in Fig. 13. (The variation in integrated probability with initial energy is fairly slow; the calculated result would not be significantly different for 13 neV initial energy.) The rapid drop in probablity with decreasing maximum final energy that is evident in Fig. 13 is consistent, within statisitics and uncertainties in neutron transport, with the data presented in moroz3 , Fig. 2.
IV Conclusion
As shown in Figs. 7-9, the UCN lifetime for energies near 100 neV (e.g., the high energy data points presented in Ref. dave ) are well-described by upscattering loss due to surface waves. In this analysis, the low-frequency kinematic viscosity and surface tension were used. The excellent agreement between theory and experiment suggest that no modification of the low frequency dispersion curve for the surface waves are required, but we might anticipate that for higher accuracy data, this simple analysis ultimately might not be sufficient.
It was suggested in dave that the excess high energy loss is due to changes in the stored UCN spectral properties; the analysis presented here indicates that direct upscattering to energies higher than the wall potential fully account for the observed loss rate beyond that due to nuclear absorption and upscattering in the film (as parameterized by in Eq. (32)) and losses through holes and gaps. The decrease in for the re-analysis of the Richardson et al. data, with no adjustable parameters, indicates that surface wave upscattering laregely describes the excess loss rate for UCN energy close to the wall potential. As described in Sec. F, and shown Figs. 11 and 12, the heating and cooling probabilities are sufficiently small so that, at the level of accuracy of the data presented in dave , the effects of spectral evolution are not important. However, such effect are likely important for high-accuracy determination of the neutron lifetime from Fomblin coated bottles.
We have shown that the observed temperature dependence of the net loss rate has a significant component due to the surface wave upscattering loss process. In mampe , the measured temperature dependence of the lifetime for 70 neV in a Fomblin coated bottle is given as 4 s/K. This was not fully explained by the temperature dependent cross section (e.g., the temperature dependence of in Eq. (32)). The temperature dependent loss implied by measurements of transmission of 60 Å neutrons through Fomblin was 33% too small mampe ; ruddies . However, from our analysis, the surface wave upscattering accounts for up to 20% of the loss for 70 neV UCN. This accounts for much of the reported discrepancy. This, together with our estimate of the temperature variation of , explains the UCN loss in Fomblin coated bottles to within experimental errors.
Recent Fomblin transmission measurements using 9 m/s neutrons by Morozov et al. moroz2 indicate that /K which is in rough agreement with the result presented in Sec. IIE, based on Fig. 6. Furthermore, the values of implied by the Ref. moroz2 measurements are in agreement with the results of our analyis presented in column five of Table II. Unfortuantely, our value of extrapolated to (Fig. 10) has too much uncertainty to help with the analysis of the Fomblin stoichiometry as discussed in the Introduction.
We hope that the analysis presented here will stimulate high-accuracy experimental measurement of the temperature dependent cross section of Fomblin. It is our expectation that the temperature dependence of together with the surface wave loss rate can fully explain the temperature dependence of the storage lifetime of Fomblin coated bottles.
We thank Albert Steyerl for critically reading the manuscript and providing clarifications on several points. SKL was supported by LANL LDRD-DR 2001526.
References
- (1) J.C. Bates, Nucl. Instr. and Meth. A249, 261 (1986).
- (2) W. Mampe et al, Nucl. Instr. and Meth. A284, 111 (1989); Phys. Rev. Lett. 63, 593 (1989).
- (3) S. Arzumanov et al., Phys. Lett. B 483, 15 (2000).
- (4) Ultracold Neutrons, R. Golub, D. Richardson, S.K. Lamoreaux (Adam-Hilger, Bristol, 1991).
- (5) F. Tervisidis and N. Tsaga, Nucl. Instr. and Meth. A305, 433 (1991).
- (6) R. Ruddies, W. Mampe, D. Dubbers, Institut Laue-Langevin Praktikum “Messung der temperaturahängigen Streuung von UCN an Fomblinöl,” 1988 (unpublished).
- (7) W. Mampe et al., JETP Letters (Eng. Trans.) 57, 82 (1993).
- (8) V.I. Morozov, Private Communication, 2002.
- (9) Yu. N. Pokotilovski, Eur. Phys. Jour. B8, 1 (1999).
- (10) Yu. N. Pokotilovski, Phys. Lett. A255, 173 (1999).
- (11) D.J. Richardson et al., Nucl. Instr. and Meth. A308, 568 (1991).
- (12) L.D. Landau and E.M. Lifshitz, Fluid Mechanics (Pergamon, Oxford, 1987).
- (13) M.A. Bouchiat and J. Meunier, J. de Phys. 32, 561 (1972).
- (14) S. Hård, Y. Hamnerius, and O. Nilsson, Appl. Phys. 47, 2433 (1976).
- (15) W.M. Klipstein, J.S. Radnich, and S.K. Lamoreaux, Amer. Jour. Phys. 64, 768 (1996).
- (16) Albert Steyerl, Private Communication, 2002.
- (17) L.N. Bondarenko et al., Phys. of Atom. Nuclei 65, 11 (2002). (Trans. from Yad. Fiz. 65, 13 (2002))
| T (K) | q (cm-1) | (s) | (cm2/s) | dyne/cm | |
|---|---|---|---|---|---|
| 286 | 90.8 | ||||
| 300 | 90.8 | ||||
| 309 | 181.6 | ||||
| 347 | 90.8 |
| Ref. [9] fit results | With Surface Waves | |||||
|---|---|---|---|---|---|---|
| Temp [K] | (d.o.f.) | (d.o.f.) | ||||
| 283 | 1.9(0.2) | 3.0(0.5) | 5(4) | 0.83(0.10) | 5.6(0.5) | 1.5(5) |
| 294 | 2.45(0.1) | 0.0(0.0) | 8(8) | 1.28(0.10) | 3.5(0.6) | 2.1(8) |
| 308 | 3.9(0.5) | 3.4(1.5) | 9(2) | 1.42(0.3) | 8.3(1.0) | 2.4(3) |
| Temp (K) | Exp. Upscatter Prob. | Calc. Prob. |
|---|---|---|
| 343 | ||
| 308 | ||
| 298 |