Measurements of Charged Current Reactions of on
Abstract
Charged current scattering of on has been studied using a decay-in-flight beam at the Los Alamos Neutron Science Center. A sample of events satisfying criteria for the exclusive reaction was obtained using a large liquid scintillator neutrino detector. The observed flux-averaged cross section cm2 agrees well with reliable theoretical expectations. A measurement was also obtained for the inclusive cross section to all accessible states . This flux-averaged cross section is cm2 which is lower than present theoretical calculations.
1 Introduction
Neutrino-nucleus cross sections are needed for the interpretation of measurements by many low energy neutrino experiments as well as for modeling various astrophysical processes such as supernova explosions. Low-energy neutrino-nucleus cross sections are also of interest because of their role in nuclear structure studies. The cross sections contain contributions from both axial vector and polar vector nuclear currents and thus provide complementary information to that provided by eletromagnetic scattering from the nucleus, which is sensitive only to the nuclear polar vector currents.
Many calculational techniques have been used to determine neutrino-nuclear cross sections. Shell model techniques work best at lower energies where transitions to continuum states are not large. At intermediate energies the Continuum Random Phase Approximation (CRPA) is frequently used, while at still higher energies the Fermi gas model is thought to work well. Experimental measurements are, however, necessary to establish the range of validity of the different calculational techniques.
There are more neutrino cross section measurements for than for any other nucleus. Three experiments, E225[1] at LAMPF, the KARMEN experiment[2] at the ISIS facility of the Rutherford Laboratory and a liquid scintillator neutrino detector (LSND)[3, 4], have measured both the exclusive reaction and inclusive reaction to the other accessible excited states of . In these measurements the flux arises from decay at rest with MeV. As a result of the low neutrino energy, transitions occur almost entirely to a few low lying states of , and over 60 of the total cross section is to the ground state. The cross section for producing the ground state can be predicted with an accuracy of by using model-independent form factors that can be reliably extracted from other measurements[5]. All three experimental measurements of the cross section agree well with the expected value. Calculation of the inclusive cross section to the excited states of is model dependent and is a less certain procedure. The Fermi gas model (FGM) is not reliable in this instance because the low neutrino energy leads to momentum transfers ( MeV/ ), much smaller than the Fermi momentum ( 200 MeV/ ) in carbon. Thus extensive modeling of the nuclear dynamics is necessary [6, 7, 8, 9, 10, 11, 12]. Final LSND results for this reaction[4] agree with a recent shell model calculation [10]. They are somewhat lower than, but consistent with, a recent CRPA calculation [8].
Measurements also exist for two processes closely related to carbon scattering: capture on [13] and scattering on carbon using a beam of from decay-in-flight[14, 15]. For the carbon measurement MeV, MeV/, and the inclusive cross section is dominated by transitions to low multipoles (). In contrast, for the carbon measurement MeV, MeV/, and excitations occur up to 100 MeV. The capture process, which occurs from the state, is intermediate between these two processes with MeV/. Because these three processes occur at different energies and momentum-transfers they constrain different aspects of theoretical calculations. A challenging test of a theoretical procedure is its ability to predict all three processes. We note that the inclusive cross section is strongly energy and momentum transfer dependent. Thus the flux averaged cross section for the reaction is approximately 200 times larger than the lower energy cross section for .
The measurement[14, 15] of the inclusive cross section for several years ago by LSND attracted substantial interest because a CRPA calculation[7] predicted a cross section almost twice as large as that observed. An improved calculation by the same group[8] together with an improved calculation of the neutrino energy spectrum and flux discussed in Section 2 reduced but did not eliminate the discrepancy with the measured cross section. Recent calculations using the shell model[9, 10] are in better agreement with the measured cross section. In this paper we present final LSND results for the inclusive cross section for and for the exclusive reaction .
2 The Neutrino Source
The data reported here were obtained between 1994 and 1998 at the Los Alamos Neutron Science Center (LANSCE) primarily using neutrinos produced at the A6 proton beam stop. As discussed below some neutrinos were also produced at upstream targets A1 and A2. The neutrino source is described in detail elsewhere[16].
In 1994 and 1995 the beam stop consisted of a 30-cm water target followed by a 50-cm decay region, isotope production stringers and a copper beam dump as shown in Fig. 1.
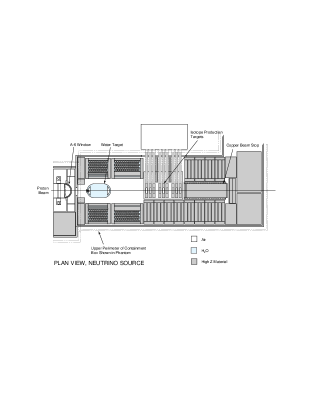
The high-intensity 798 MeV proton beam from the linear accelerator generates a large pion flux from the water target. The flux of and used for the measurements reported here arise from the decay in flight (DIF) of and . For the LANSCE proton beam and beam stop configuration production exceeds production by a factor of approximately 8 and even more for high energy pions. Approximately 3.4% of the and 5% of the decay in flight. Upstream targets contributed 6% to the DIF neutrino flux. For the 1995 run, the water target was removed for 32% of the 7081 C of beam. For this portion of the run the DIF flux was reduced approximately 50%.
After the 1995 run the beam stop was substantially modified for accelerator production of tritium (APT) tests. The replacement of the water target by a close-packed, high-Z target resulted in reduced production largely due to the change in the neutron to proton ratio in the target. The closer packing of materials for the APT stop reduced the fraction of which decay in flight. The resulting DIF flux per incident proton is only one-half of that obtained with the water target. There were no upstream targets for almost all of the data taken with the APT target in 1996-1998.
The LANSCE beam dump has been used as the neutrino source for previous experiments[17, 18, 19]. These experiments primarily used neutrinos from the decay at rest (DAR) of stopped and . A calibration experiment[20] measured the rate of stopped from a low-intensity proton beam incident on an instrumented beam stop. The rate of stopped per incident proton was measured as a function of several variables and used to fine-tune a beam dump simulation program[21]. The simulation program could then be used to calculate the flux for any particular beam dump configuration. The calibration experiment determined the DAR flux to for the proton energies and beam stop configurations used at LANSCE. There are greater uncertainties in the DIF fluxes. Uncertainties in the energy spectra of the which decay in flight lead to uncertainties in both the magnitudes and shapes of the and energy spectra. The shapes of the and energy spectra are particularly important for the measurement of inclusive cross sections, since these cross sections have a strong energy dependence. We have studied in detail the procedure of Ref. [21] for calculating the DIF flux and slightly revised it to incorporate more recent production results[22] and to remove some slight distortions arising from use of finite bins in the pion production angle[23]. The primary effect is to reduce the flux above 200 MeV.
The largest uncertainties in the DIF flux arise from systematic effects in the calibration experiment (5%), uncertainties in the production cross sections used in the simulation (10%) and other systematic effects in the simulation (7%). For the 1994-1995 data the upstream targets introduced a small additional uncertainty in the flux. For 1996-1998 data the geometry of the beam stop configuration was more complicated than that used in 1994-1995. The uncertainty in the DIF flux for neutrinos above muon production threshold is estimated to produce an uncertainty in the measured cross section of 15%. This uncertainty provides the largest source of systematic error for the cross sections presented here.
The LANSCE proton beam typically had a current of 800 A at the beam stop during the 1994-1995 running period and 1000 A for 1996-1998. For 1994 and 1995 the energy was approximately 770 MeV at the beam stop due to energy loss in upstream targets, while it was approximately 800 MeV in 1996, 1997 and 1998.
Table 1 shows for each year the calculated flux above the threshold (123.1 MeV) for muon production on carbon and averaged over the LSND detector.
| Year | flux[cm-2] | flux[cm-2] |
|---|---|---|
| 1994 | ||
| 1995 | ||
| 1996 | ||
| 1997 | ||
| 1998 | ||
| Total |
The flux above threshold (113.1 MeV) for the process is also shown. Figure 2 shows the calculated and energy spectra.

3 The LSND Detector
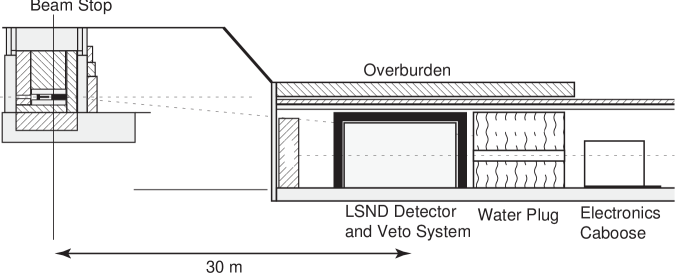
The detector is located 29.8 m downstream of the proton beam stop at an angle of to the proton beam. Figure 3 shows a side-view of the setup.
Approximately 2000 g/cm2 of shielding above the detector attenuates the hadronic component of cosmic rays to a negligible level. The detector is also well shielded from the beam stop so that beam-associated neutrons are attenuated to a negligible level. Enclosing the detector, except on the bottom, is a highly efficient liquid scintillator veto shield which is essential to reduce contributions from the cosmic ray muon background to a low level. Reference [16] provides a detailed description of the detector, veto, and data acquisition system (DAQ) which we briefly review here.
The detector is an approximately cylindrical tank containing 167 tons of liquid scintillator and viewed by 1220 uniformly spaced Hamamatsu photomultiplier tubes (PMT) covering of the surface inside the tank wall. When the deposited energy in the tank exceeds a threshold of approximately 4 MeV electron-equivalent energy and there are fewer than 4 PMT hits in the veto shield, the digitized time and pulse height of each of these PMTs (and of each of the 292 veto shield PMTs) are recorded. A veto, imposed for 15.2 s following the firing of veto PMTs, substantially reduces () the large number of background events arising from the decay of cosmic ray muons that stop in the detector. Activity in the detector or veto shield during the 51.2 s preceding a primary trigger is also recorded, provided there are detector PMT hits or veto PMT hits. This activity information is used in the analysis to identify events arising from muon decay. In particular, in this analysis the activity information is used to identify from the reaction . For such events the from the subsequent decay provides the primary trigger. Activities with veto PMT hits mostly arise from cosmic ray muons and are rejected in the analysis. It should also be noted that the 15.2 s veto applies only to the primary trigger and not to the activities preceding a valid trigger. Data after the primary event are recorded for 1 ms with a threshold of 21 PMTs (approximately 0.7 MeV electron-equivalent energy). This low threshold is used for the detection of 2.2 MeV from neutron capture on free protons. Muon events with associated neutrons arise from the processes , , and .
The detector operates without reference to the beam spill, but the state of the beam is recorded with the event. Approximately 94% of the data is taken between beam spills. This allows an accurate measurement and subtraction of cosmic ray background surviving the event selection criteria.
The detector scintillator consists of mineral oil () in which is dissolved a small concentration (0.031 g/l) of b-PBD[24]. This mixture allows the separation of Čerenkov light and scintillation light and produces about 33 photoelectrons per MeV of electron energy deposited in the oil. The combination of the two sources of light provides direction information for relativistic particles and makes particle identification (PID) possible. Note that the oil consists almost entirely of carbon and hydrogen. Isotopically the carbon is and . Stopping are captured on 8% of the time in the LSND detector. The which decay are readily identified as muons by the presence of subsequent spatially correlated Michel electrons.
The veto shield encloses the detector on all sides except the bottom. Additional counters were placed below the veto shield after the 1993 run to reduce cosmic ray background entering through the bottom support structure. More counters were added after the 1995 run. The main veto shield[25] consists of a 15-cm layer of liquid scintillator in an external tank and 15 cm of lead shot in an internal tank. This combination of active and passive shielding tags cosmic ray muons that stop in the lead shot. A veto inefficiency is achieved with this detector for incident charged particles.
4 Analysis Techniques
In the analysis presented in this paper we require a followed by a delayed coincidence with a decay . As a result of this coincidence requirement a clean beam excess sample of events can be obtained with relatively loose selection criteria. Furthermore, it is easy to verify that the events in this sample arise from muon decay since the muon lifetime and the decay electron energy spectrum are well known.
Each event is reconstructed using the hit time and pulse height of all hit PMTs in the detector[16]. The present analysis relies on the reconstructed energy, position, and two PID parameters, and , as described later in this section. The parameters and are used to distinguish electron events from events arising from interactions of cosmic ray neutrons in the detector. Fortunately, it is possible to directly measure the response of the detector to electrons and neutrons in the energy range of interest for this analysis by using copious control data samples. We also use a Monte Carlo simulation, LSNDMC[26], to simulate events in the detector using GEANT.
The response of the detector to electrons was determined from a large, essentially pure sample of electrons (and positrons) from the decay of stopped cosmic ray in the detector. The known energy spectra for electrons from muon decay was used to determine the absolute energy calibration, including its small variation over the volume of the detector. The energy resolution was determined from the shape of the electron energy spectrum and was found to be 6.6% at the 52.8 MeV end-point.
For relativistic electrons in the LSND detector approximately 65% of the photoelectrons arise from direct or reradiated Čerenkov light and only 35% from scintillator light. For muons, the threshold kinetic energy for Čerenkov radiation in the LSND detector is 39 MeV. For the sample of muons analyzed in this paper only about half are above Čerenkov threshold and none fully relativistic. As a result, the light output per MeV of energy loss for the muons is significantly less than that for relativistic electrons. There is no calibration sample available of low-energy muons with known energies. Thus we rely on the Monte Carlo simulation LSNDMC for muons. We discuss the muon energy scale further in Sections 6 and 7 when we compare observed and expected energy distributions.
There are no tracking devices in the LSND detector. Thus, event positions must be determined solely from the PMT information. The reconstruction process determines an event position by minimizing a function which is based on the time of each PMT hit corrected for the travel time of light from the assumed event position to the PMT[16]. The procedure used in several previous analyses systematically shifted event positions away from the center of the detector and thus effectively reduced the fiducial volume[3, 27]. The reconstruction procedure has been analyzed in detail and an improved reconstruction procedure was developed which reduces this systematic shift and provides substantially better position resolution. This procedure also provides results which agree well with positions obtained from the event likelihood procedure described in Ref [28]. In the analysis presented in this paper, a fiducial cut is imposed by requiring cm, where is the distance between the reconstructed electron position and the surface tangent to the faces of the PMTs. For the muon we require cm.
The particle identification procedure is designed to separate particles with velocities well above Čerenkov threshold from particles below Čerenkov threshold. The procedure makes use of the four parameters defined in Refs. [16]. Briefly, and are the quantities minimized for the determination of the event position and direction, is the fraction of PMT hits that occur more than 12 ns after the fitted event time and is proportional to the product of , and .
Several previous LSND analyses[3, 15, 27] have used for particle identification. The distribution of for electrons, however, has a small variation with electron energy and with the position of the event. Therefore, in this paper, we used a modified variable, , with approximately a mean of zero and sigma of one, independent of the electron energy and positions. We also used the variable, , which is based on the event likelihood procedures discussed in Ref. [28]. It is similar to the parameter discussed there, which is based on the ratio of Čerenkov to scintillator light. The parameter varies from 0 to 1 and peaks at one for electrons and at 0.3 for neutrons. As discussed in Refs. [4] and [29], the combination provides better separation of electrons, muons, and neutrons than by itself.
We note that a modest particle identification requirement was imposed in the initial data processing that created the samples analyzed here. The effect of this requirement is also included in the analysis.
Cosmic ray background which remains after all selection criteria have been applied is well measured with the beam-off data and subtracted using the duty ratio, the ratio of beam-on time to beam-off time. The subtraction was performed separately for each year’s data using the measured duty ratio for that year. The ratio averaged over the full data sample was 0.0632. In the present analysis the beam-off background is very small() because we require a low energy muon that is well correlated in space and time with a Michel electron.
5 Event Selection Criteria
The analysis is designed to select the from the reaction and the subsequent electron from the decay . In the LSND detector medium 92% of the stopped decay and 8% are captured. The and other particles arising from the charge-changing neutrino interaction produce light that causes an average of 250 PMTs to fire. The detector charge , measured in photoelectrons, arises mostly from the but includes contributions from other particles produced in the reaction such as protons and ’s.
Tables 2 and 3 respectively show the selection criteria and corresponding efficiencies for the electron and for the muon.
| Quantity | Criteria | Efficiency |
|---|---|---|
| Fiducial volume | cm, | 0.8800.055 |
| Electron energy | MeV | 0.9240.010 |
| Particle ID | 0.9400.018 | |
| In-time veto | PMTs | 0.9860.010 |
| Future activity | s | 0.9910.003 |
| Past activity | See text | 0.8580.010 |
| Trigger veto | s | 0.7600.010 |
| DAQ dead time | 0.9770.010 | |
| Tape dead time | 0.9810.010 | |
| Total | 0.4670.032 |
| Quantity | Criteria | Efficiency |
|---|---|---|
| Fiducial volume | cm | 0.9780.010 |
| Not Capture | – | 0.9220.005 |
| Muon Energy ( equivalent) | MeV | 0.9900.008 |
| Spatial Correlation | cm | 0.9900.002 |
| Decay Time | s | 0.6870.005 |
| Intime Veto | PMTs | 0.9880.010 |
| Total | 0.5990.011 |
For events in the decay-in-flight sample the event position is best determined from the reconstructed electron position rather than the reconstructed muon position, especially for events with low-energy muons. Therefore, the fiducial selection is imposed primarily on the electron. The reconstructed electron is required to be a distance cm from the surface tangent to the faces of the PMTs. There are nuclei within this fiducial volume. The fiducial volume efficiency, defined to be the ratio of the number of events reconstructed within the fiducial volume to the actual number within this volume, was determined to be . This efficiency is less than one because there is a systematic shift of reconstructed event positions away from the center of the detector, as discussed in Section 4. The muon is required to reconstruct only inside the region cm. A lower limit on the electron energy of 18 MeV eliminates the large background from decay created by the capture of cosmic ray on . Figure 4 shows the observed electron energy distribution compared with the expected energy distribution of Michel electrons from Monte Carlo simulation.

The distribution of the time, , between the muon and electron candidates, shown in Fig. 5, agrees well with the 2.03 s lifetime in mineral oil.

The best fit, also shown, corresponds to a lifetime of s. The requirement s is imposed to insure that the and are clearly separated in the trigger and in the readout of the data. The excellent agreement with expectations in Figs. 4 and 5 clearly shows that the events arise from muon decay. There is an 8% loss of events due to capture in the detector medium. Figure 6 shows the spatial separation between the reconstructed muon and electron positions.

A loose requirement, m, is imposed to minimize the background from accidental correlations while retaining high acceptance.
Many of the selection criteria are designed to reduce the cosmic ray background, especially that arising from the decay of cosmic ray muons which stop in the detector. Both the muon and the electron candidates are required to have fewer than 4 PMT hits in the veto and no bottom counter coincidence during the 500 ns event window. The detector PMT faces are 25 cm inside the tank and thus stopping cosmic ray muons must traverse at least 60 cm of oil to reach the fiducial volume. As a result, these muons typically produce a large detector signal. The requirement 70 MeV, where is the electron equivalent energy of the muon, eliminates most such background events with almost no loss of acceptance for muons arising from neutrino interactions.
Muons which are misidentified as electrons are removed by requiring that there be no future activity consistent with a Michel electron. Any electron candidate with future activity with fewer than 4 veto PMT hits and more than 50 detector PMT hits within 8.8 s is rejected.
Frequently, in addition to the candidate muon which satisfies the criteria in Table 3, there are one or more other activities prior to the electron. If an activity is due to a stopping muon, that muon could be the parent of the observed electron. Therefore an event is rejected if, in the 35 s interval prior to the electron, there is an activity (other than the muon) with pe or an activity with PMT hits in the veto and PMT hits in the detector. We also reject any event with a past activity within 51 s with veto PMT hits and detector PMT hits. A cut is performed during initial data processing on past activities that are spatially correlated with the primary event, within 30 s of the primary event, and have veto PMT hits.
The acceptances for the past activity and in-time veto cuts are obtained by applying these cuts to a large sample of events triggered with the laser used for detector calibration. These laser events are spread uniformly through the run and thus average over the small variation in run conditions.
Only a loose particle ID requirement, , was imposed on the electron and none on the muon. A sample of Michel electrons (electrons from the decay of stopped ) was analyzed to obtain the acceptance of electrons for the particle identification cut, as shown in Fig. 7.

The Monte Carlo simulation LSNDMC was used to obtain the PMT hit distributions expected from the various processes that contribute to the inclusive sample and to the exclusive sample with an identified decay. Figure 8 compares the observed and expected distribution of PMT hits for muons from inclusive events.

There is excellent agreement, and thus we expect that the simulation provides a reliable estimate of the fraction of events lost because they are below the activity threshold of 18 PMT hits (roughly 4 MeV). For the inclusive sample (exclusive sample) we find that only 1.2%(2.4%) of the events have fewer than 18 PMT hits.
6 The Transition to the Ground State
For analysis of the exclusive process we also require detection of the from the decay of . Therefore, for these events three particles are detected: the muon, the decay electron and the positron from the decay of . Table 4 gives the selection criteria and efficiencies for the decay positron.
| Quantity | Criteria | Efficiency |
|---|---|---|
| decay time | 52 s ms | 0.9740.002 |
| Spatial correlation | m | 0.9920.008 |
| PMT threshold | for 1994, | 0.8560.011 |
| after 1994 | ||
| Positron energy | MeV | 0.9990.001 |
| Fiducial volume | cm | 0.9860.010 |
| Trigger veto | s | 0.7600.010 |
| In-time veto | PMTs | 0.9880.010 |
| DAQ dead time | 0.9770.010 | |
| Total | 0.5980.016 |
These are the same criteria used previously in an analysis of a much larger sample from the analogous process [3, 4]. The decay has a mean lifetime of 15.9 ms and maximum positron kinetic energy of 16.3 MeV[30]. Figure 9 shows the observed decay time distribution compared with the expected 15.9 ms lifetime.

Figure 10 shows the distance between the reconstructed electron and positron positions for the beam-excess sample.

A cut was applied at 70 cm, resulting in an acceptance of . The positron is required to be spatially correlated with the electron rather than the muon because the position of the electron in general is better determined. Following a muon produced by a neutrino interaction, an uncorrelated particle, such as the positron from decay, will occasionally satisfy all the positron criteria including the requirements of time (60 ms) and spatial (70 cm) correlation with the electron. The probability of such an accidental coincidence can be precisely measured from the Michel electron sample. The background from this source is also shown in Figs. 9 and 10. The efficiency of 76.0% caused by the 15.2 s veto and the trigger dead time of 2.3% are the same as for the electron. Positrons with four or more in-time veto hits or any bottom veto coincidence are rejected. The Monte Carlo simulation was used to generate the expected distribution for the positron energy. There was a trigger requirement of 100 PMT hits for 1994 and 75 PMT hits for 1995-1998. The positron was required to have an energy less than 18 MeV. Figure 11 compares the observed and expected positron energy distributions.

Figure 12 compares the observed and expected distributions of muon decay time.

Excited states of decay by prompt proton emission and thus do not feed down to the ground state or contribute to the delayed coincidence rate. The form factors required to calculate the cross section are well known from a variety of previous measurements[5]. This cross section and the known flux are used to obtain the expected muon kinetic energy spectrum which is compared with the data in Fig. 13.

As stated in Section 4 the energy calibration for muons (the conversion from photoelectrons to MeV) is obtained from the Monte Carlo simulation LSNDMC. For this ground state reaction, the expected muon energy distribution should be very reliable. Thus the agreement seen in Fig. 13 provides confirmation for the muon energy calibration within the limited statistics.
There are two sources of background. The largest arises from the accidental coincidence of a positron candidate with an event from the inclusive sample of neutrino-induced muons. The probability of an uncorrelated particle satisfying all the positron criteria, including the requirements of time (60 ms) and spatial correlation (70 cm) with the electron, can be precisely measured from a large Michel electron sample. The second background arises from the process , where we detect the from the decay of the ground state[31]. This background is small primarily because the flux of high-energy is approximately a factor of 10 lower than the corresponding flux and because the lifetime is longer than the lifetime.
Table 5 shows the number of beam excess events, the number of background events, the efficiency, the neutrino flux for MeV, and the cross section averaged over the flux.
| Corrected beam excess events | 77.88.9 |
|---|---|
| 2.70.5 | |
| accidental background | 8.20.8 |
| 66.99.0 | |
| Efficiency | |
| flux ( 123.1 MeV) | 2.03 cm-2 |
| measured | cm2 |
| theory | |
| Engel et al. [31] | cm2 |
| Kolbe et al. [8] | cm2 |
| Volpe et al. [9] | cm2 |
| Hayes and Towner [10] | cm2 |
The efficiency shown includes the efficiency for muons to have more than 17 PMT hits as well as the electron, muon and beta efficiencies given in Table 2, Table 3 and Table 4, respectively. The flux-averaged cross section is cm2, where the first error is statistical and the second systematic. The two dominant sources of systematic error are the neutrino flux (15%) discussed in Section 2 and the effective fiducial volume (6%) discussed in Section 4.
For this reaction to the ground state it is also straightforward to measure the energy dependence of the cross section. The recoil energy of the nucleus is small and to a very good approximation, MeV, where is the muon mass, is the kinetic energy of the muon, and 17.7 MeV arises from the value of the reaction and the nuclear recoil. Figure 14 compares the measured cross section as a function of with three theoretical calculations obtained from Ref. [31].
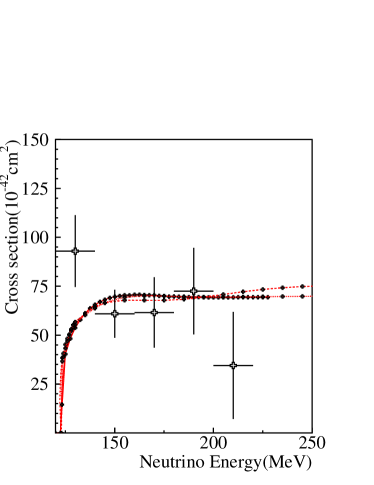
The agreement is reasonable within the limited statistics.
There is little disagreement[31] in the predicted cross section for this exclusive process, as it is fixed by measured values of closely related electroweak transition probabilities. The differences that exist among various calculations result from different models for the dependence of various elements of the transition probability on the momentum transfer. Thus, as shown in Fig. 14, the differences among shell model approaches, an RPA calculation, and an “elementary particle” model all agree for up to 160 MeV and differ only by about 10% at 250 MeV.
7 The Inclusive Reaction
Most of the inclusive beam-excess events arise from the reaction , but approximately 10% are due to other sources. Table 6 shows the number of beam-excess events, the calculated backgrounds, the efficiency, flux, and the flux-averaged cross section for this process.
| Corrected beam excess events | 246450 |
|---|---|
| 21735 | |
| 7135 | |
| 2412 | |
| 215256 | |
| Efficiency | |
| flux ( 123.1 MeV) | 2.03 cm-2 |
| measured | cm2 |
| Theory | |
| Kolbe et al. [8] | cm2 |
| Volpe et al. [9] | cm2 |
| Hayes and Towner [10] | cm2 |
The efficiency shown includes the efficiency for muons to have more than 17 PMT hits as well as the electron and muon efficiencies given in Tables 2 and 3. The backgrounds arising from the component of the decay-in-flight beam are small, primarily because the high-energy flux is approximately a factor of 10 lower than the corresponding flux. The largest background arises from the process . The cross section is well known and the uncertainty in this process is mainly due to the 15% uncertainty in the flux. A much smaller but less well understood background arises from the process . Plausibly, as observed for the process , the cross section might be expected to be approximately 60% of that given by a recent CRPA calculation[32]. We use this reduced cross section in calculating this background but assign a large error to reflect the uncertainty in the cross section. An even smaller background arises from the 1.1% component of the scintillator. For the process we use a Fermi gas model calculation and assign a 50% uncertainty.
The measured flux-averaged cross section for the inclusive reaction is cm2, where the first error is statistical and the second systematic. The mean energy of the neutrino flux above threshold is 156 MeV.
Table 6 shows for comparison results of three recent theoretical calculations of the cross section [8, 9, 10]. The shell model calculation of Hayes and Towner [10] provides the best agreement with our measurement but all three predict a higher cross section than observed. These calculations used the energy distribution calculated by LSND for the 1994 beam stop. The shape of the calculated energy distribution, however, shows only small yearly variations that would produce shifts of a few percent in the expected cross section for the different years. Averaged over all the data the calculated shape is the same as that calculated for 1994.
The systematic error is due almost entirely to the uncertainty in the flux. To determine this value, the inputs to the neutrino beam Monte Carlo program were varied within their estimated uncertainties. The resulting variation in both the magnitude and the shape of the flux above muon production threshold results in a 15% uncertainty in the inclusive cross section.
The beam dump configuration was substantially modified after the 1995 run as discussed in Section 2. The two beam dump geometries are very different. Also the flux for 1994-1995 depends primarily on production from water while the flux for 1996-1998 arises primarily from production on high-Z materials. The resulting DIF flux per incident proton with the modified configuration was only one-half of that obtained with the water target used in 1994-1995. Thus a comparison of the cross sections measured with the two beam dump configurations provides a check on the systematics of the flux simulation. The cross section measured with the APT beam dump in 1996-1998, ( cm2, was lower than that measured with the water target setup in 1994-1995, ( cm2, by a little more than one standard deviation. The statistical uncertainties of these measurements are small compared to the systematic uncertainties. The systematic errors for the two beam dump configurations are partially correlated but each has an uncorrelated systematic error of about 10%. The cross sections for the two beam dump configurations differ by cm2 compared to an expected uncertainty of cm2. Thus results for the two beam dump configurations are consistent within errors.
The spatial distribution of the beam-excess electrons is shown in Fig. 15.

There is a clear enhancement of events at high and high due to the variation of the flux over the detector. The good agreement with expectation shows that this spatial distribution is well modeled by the beam simulation program.
For the reaction , the detector charge , measured in photoelectrons, arises mostly from the but includes contributions from other particles in the reaction such as protons and ’s. The muon kinetic energy distribution obtained from the distribution is shown in Fig. 16.

According to the CRPA calculation [32], 84.5 (20.4) of the inclusive events have proton () emission from the decay of the N excited states. The average energies of these protons and s are estimated to be 9 and 4 MeV. We used the calculation of Ref. [32] to determine proton and energy distributions and LSNDMC to determine the number of photoelectrons produced. The averaged contribution of these particles to the measured electron equivalent energy of the muons is estimated to be 2.2 MeV. Protons produce less scintillation light than electrons due to saturation effects. The uncertainty in the saturation effect is the primary source of uncertainty in the muon and proton energy determination. The average contribution to from particles other than the muon is approximately 12%. The expected muon energy spectrum in Fig. 16 is obtained from a recent CRPA calculation and includes the contribution from particles other than muon. There is reasonable agreement. However, given the uncertainties in the shape of the energy spectrum, in the modeling of the energy from nuclear breakup and in the muon and proton energy calibration, we do not try to extract any information on the energy dependence of the cross section for the reaction .
Further information on the inclusive sample can be obtained by measuring the fraction of the events with an associated neutron. The presence of a neutron is established by detection of the ray from the neutron’s capture on a proton in the detector via the reaction . A detailed discussion on the procedure used to detect these ’s can be found in Ref. [33]. The distribution of the likelihood ratio for correlated ’s from neutron capture is very different from that for uncorrelated (accidental) ’s. The measured distribution for the inclusive sample, shown in Fig. 17, was fit to a mixture of these two possible sources to determine the fraction of events with associated neutrons.
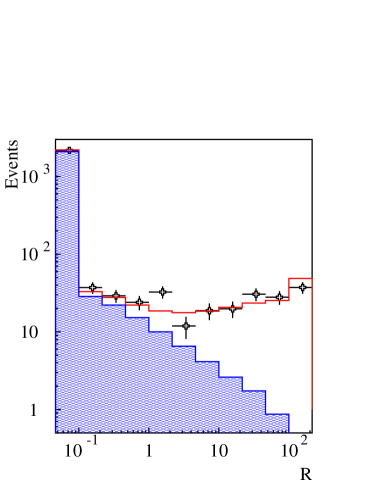
The best fit, also shown in the figure, corresponds to a fraction of events with a neutron of %, where the error includes systematic uncertainties.
The two largest backgrounds shown in Table 6 arise from the component of the beam, and almost all of these events should have an associated neutron. In contrast, most of the events arising from interactions will not have an associated neutron. A CRPA calculation predicts that 79% of the events from the reaction will have an associated neutron compared to only 5.9% for the reaction [32].
Table 7 shows the measured component with an associated neutron for the beam excess sample and the calculated backgrounds from interactions. The resulting number for the carbon sample (%) is lower than the CRPA prediction of 5.9%.
| Events from | Fraction | Events with | |
|---|---|---|---|
| Source | Table 6 | with neutron | neutron |
| Beam Excess | 2464 | 28627 | |
| 214 | 21435 | ||
| 64 | 5126 | ||
| 2181 | 2152 |
The CRPA prediction is for the spectrum used in our earlier analysis [15], which is slightly harder than that used in the present analysis as discussed in Section 2. The observed number of events with neutrons also rules out a flux much bigger than that calculated by the beam Monte Carlo simulation.
8 Conclusions
The exclusive process has been measured with a clean sample of events for which the , the decay , and the from the decay of the are detected. For this process the theoretical cross section calculations are very reliable. The flux averaged cross section is measured to be cm2 in good agreement with theoretical expectations. From comparison of this cross section with the cross section for the inclusive process we obtain a flux-averaged branching ratio of .
The inclusive process has also been measured. There are model-dependent uncertainties in the theoretical cross section calculation for this process that are not present for the cross section. The measured flux-averaged cross section, cm2, is smaller than theoretical expectations [8, 9, 10]. It is in better agreement with the shell model calculation of Hayes and Towner [10] than with the CRPA calculation of Kolbe et al. [8]. The mean energy of the neutrino flux above threshold is 156 MeV. The measured distribution of the muon energy (including contributions from other particles such as protons and ’s) agrees within errors with the CRPA calculation. The fraction of events with associated neutrons was measured to be %. This is lower than the CRPA calculation of 5.9%.
Acknowledgments This work was conducted under the auspices of the US Department of Energy, supported in part by funds provided by the University of California for the conduct of discretionary research by Los Alamos National Laboratory. This work was also supported by the National Science Foundation. We are particularly grateful for the extra effort that was made by these organizations to provide funds for running the accelerator at the end of the data taking period in 1995. It is pleasing that a number of undergraduate students from participating institutions were able to contribute significantly to the experiment.
References
- [1] D.A. Krakauer et al., Phys. Rev. C 45, 2450 (1992).
- [2] J. Kleinfeller et al., in Neutrino ’96, edited by K. Enquist, H. Huitu, and J. Maalampi (World Scientific, Singapore, 1997); B.E. Bodmann et al., Phys. Lett. B 332, 251 (1994); B. Zeitnitz, Prog. Part. Nucl. Phys. 32, 351 (1994).
- [3] C. Athanassopoulos et al., LSND Collaboration, Phys. Rev. C 55, 2078 (1997).
- [4] L.B. Auerbach et al., LSND Collaboration, Phys. Rev. C. 64, 065501 (2001).
- [5] M. Fukugita et al., Phys. Lett. B 212, 139 (1988).
- [6] T.W. Donnelly and R.D. Peccei, Phys Rep. 50, 1 (1979); T.W. Donnelly, Phys. Lett. B 43, 93 (1973).
- [7] E. Kolbe, K. Langanke, and S. Krewald, Phys. Rev. C49, 1122 (1994).
- [8] E. Kolbe, K. Langanke, and P. Vogel, Nucl. Phys. A652, 91 (1999).
- [9] C. Volpe et al., Phys. Rev. C 62, 015501 (2000).
- [10] A.C. Hayes and I.S. Towner, Phys. Rev. C 61, 044603 (2000).
- [11] N. Auerbach, N.Van Giai, and O.K. Vorov, Phys. Rev. C 56, R2368 (1997).
- [12] S.K. Singh, N.C. Mukhopadhyay, and E. Oset, Phys. Rev. C 57, 2687 (1998).
- [13] T. Suzuki, D.F. Measday and J.P. Roalsvig, Phys. Rev. C 35, 2212 (1987).
- [14] M. Albert et al., Phys. Rev. C 51, 1065 (1995).
- [15] C. Athanassopoulos et al., LSND Collaboration, Phys. Rev. C 56, 2806 (1997).
- [16] C. Athanassopoulos et al., LSND Collaboration, Nucl. Instrum. Methods Phys. Res. A 388, 149 (1997).
- [17] S. Willis et al., Phys. Rev. Lett. 44, 522 (1980).
- [18] D.A. Krakauer et al., Phys. Rev. C 45, 2450 (1992).
- [19] S.J. Freedman et al., Phys. Rev. D 47, 811 (1993).
- [20] R.C. Allen et al., Nucl. Instrum. Methods Phys. Res. A 284, 347 (1989).
- [21] R.L. Burman, M.E. Potter, and E.S. Smith, Nucl. Instrum. Methods Phys. Res. A 291, 621 (1990).
- [22] J. Langenbrunner et al., Nucl. Instrum. Methods A 325 187 (1993).
- [23] R. Imlay et al., LSND Technical Note 118 (1998), Unpublished.
- [24] R.A. Reeder et al., Nucl. Instrum. Methods Phys. Res. A 334, 353 (1993).
- [25] J. Napolitano et al., Nucl. Instrum. Methods Phys. Res. A 274, 152 (1989).
- [26] K. McIlhany et al., Proceedings of the Conference on Computing in High Energy Physics, 1994 (LBL Report 35822, 357, 1995).
- [27] C. Athanassopoulos et al., LSND Collaboration, Phys. Rev. C 54, 2685 (1996); C. Athanassopoulos et al., LSND Collaboration, Phys. Rev. Lett. 77, 3082 (1996).
- [28] C. Athanassopoulos et al., Phys. Rev. C 58, 2489 (1998), C. Athanassopoulos et al., Phys. Rev. Lett. 81, 1774 (1998).
- [29] L.B. Auerbach et al., LSND Collaboration, Phys. Rev. D. 63, 112001 (2001)
- [30] F. Ajzenberg-Selove, Nucl. Phys. A 506, 1 (1990).
- [31] J. Engel, E. Kolbe, K. Langanke, and P. Vogel, Phys. Rev. C 54, 2740 (1996).
- [32] E. Kolbe, K. Langanke, F. -K. Thielmann, and P. Vogel, Phys. Rev. C 52, 3437 (1995).
- [33] A. Aguilar et al., LSND Collaboration, Phys. Rev. D 64, 112007 (2001).