and production in GeV Au+Au collisions
Abstract
The first measurements of light antinucleus production in Au+Au collisions at RHIC are reported. The observed production rates for and are much larger than in lower energy nucleus-nucleus collisions. A coalescence model analysis of the yields indicates that there is little or no increase in the antinucleon freeze-out volume compared to collisions at SPS energy. These analyses also indicate that the freeze-out volume is smaller than the freeze-out volume.
pacs:
25.75.DwThe Relativistic Heavy-Ion Collider (RHIC) at Brookhaven National Laboratory has recently begun operation with Au beams at GeV and extends the available center of mass energy in nucleus-nucleus collisions by nearly a factor of 8 over CERN SPS collisions at GeV. First measurements from RHIC indicate an increase of at least 70% in the charged multiplicity for central collisions compared to previous measurements PHOBOS . Measurements of the antiproton to proton ratio at mid-rapidity STARpbarp indicate that the central collision region is approaching the net-baryon free limit. Such a system with large multiplicity and small net-baryon density is well suited for the production of light antinuclei. In this letter, we report the first measurements of and production at RHIC.
At RHIC energies, production of antinuclei is possible via two mechanisms. The first mechanism is direct production of nucleus-antinucleus pairs in elementary nucleon-nucleon or parton-parton interactions. The RHIC center-of-mass energy is well above the threshold for such processes. Due to their small binding energies, nuclei or antinuclei produced via early direct production are likely to be dissociated in the medium before escaping.
The second, and presumably dominant, mechanism for antinucleus production is via final-state coalescence Butler ; Schwarzschild ; Gutbrod . In this picture, produced antinucleons merge to form light antinuclear clusters during the final stages of kinetic freeze-out. The measured yield of nuclei or antinuclei with nucleon number and momentum is related to the primordial nucleon invariant yield at momentum through a coalescence parameter ,
| (1) |
Equation 1 requires that antineutrons and antiprotons are produced with identical momentum spectra.
Previous studies of smaller collision systems have noted that the measured coalescence parameter can be directly predicted from the nuclear wave function of the produced (anti)nucleus Butler . When going to higher energies or larger collision systems, however, the measured coalescence parameter is lower than that measured in small systems. This can be understood by noting that once the collision region is larger than the intrinsic size of the produced (anti)nucleus, (anti)nucleons of equal velocity are not always in close proximity and hence do not always form a bound state Sato . In this sense, the coalescence parameter can be used to infer the space-time geometry of the system Mekjian . Measurements of light nuclei and antinuclei are thus analogous to two-particle Hanbury-Brown Twiss correlations (HBT) in that they measure “homogeneity lengths” of the system at kinetic freeze-out Scheibl .
The measurements were made using the STAR detector Ackermann . The main tracking detector is a cylindrical Time Projection Chamber (TPC), which resides in a solenoidal magnet that was operated with a field strength of 0.25 T for the data reported here. The TPC tracks and identifies most charged particles produced in the central pseudo-rapidity region () with nearly full azimuthal coverage. Events are selected on the basis of coincidence of spectator neutron signals in two Zero-Degree calorimeters located 18.25 m from the nominal interaction region. Central events are selected using a Central Trigger Barrel (CTB) that measures the charged particle multiplicity with full azimuthal coverage in the pseudo-rapidity region . This analysis focuses on semi-central events, where the centrality corresponds to roughly the most central 18% of the measured minimum-bias multiplicity distribution. The analysis uses 600,000 events where the interaction vertex is within the range covered by the TPC ( cm).
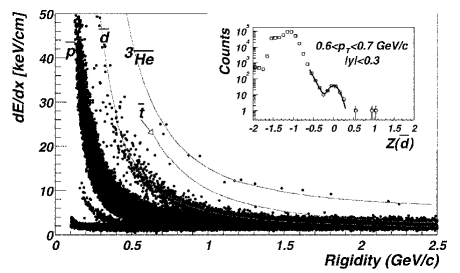
Particle identification is done by measuring the average ionization energy loss () for each track. Studies of the STAR electronics response show no evidence for saturation below 30 times minimum ionizing. For tracks with sufficient transverse momentum to leave the TPC, the path length exceeds 1.4 m. For the tracks used in this analysis, the resolution is 11%. For each track, up to 45 ionization space-point samples are taken along the path through the TPC. Space-points are found by identifying local maxima of the ADC distribution. Merged ionization clusters, where multiple tracks contribute, are identified by looking for multi-peaked structure in the ADC distribution. For the current analysis of relatively rare particles, it is necessary to impose tight cuts to eliminate background tracks with improperly measured . We require a track to have at least 35 of the 45 possible space-points. For central events, cluster merging is quite common and can lead to problems with the particle identification. To avoid these problems, we eliminate potentially merged clusters from the sample used to calculate the . For the final sample, we require that no more than 30% of the measured space-points come from potentially merged clusters. To avoid the Landau tails in the spectrum, we use a truncated mean of the lowest 70% of the measured samples. Figure 1 shows the measured truncated mean versus the magnetic rigidity for the negatively-charged tracks considered in this analysis.
Figure 1 also shows the Bethe-Bloch expectation for , and . There is a clear band below rigidity 1 GeV/c. This analysis uses only the kinematic region of good particle identification and efficiency ( GeV/c and rapidity ). We observe 14 counts clustered around the expectation in the kinematic range GeV/c and . Note that we plot the rigidity, so the momentum of the candidates is twice as large. No clear band is observed, but if one assumes that and are produced in similar numbers and with similar momentum distributions we would expect the bulk of the to have a higher rigidity where our resolution is inadequate for their identification.
To extract the yield, we construct a quantity , where is the expected ionization for a of momentum . For a pure sample of , this quantity should be well described by a Gaussian centered at zero. In the insert of Fig. 1, we plot the distribution for one transverse momentum bin. We see a Gaussian signal superimposed upon a background due to the tail of the distribution. We parameterize the background in the tail region as an exponential, and fit the resulting distribution to a Gaussian signal + exponential tail hypothesis. In the insert of Fig. 1, we also show (by the curve) our exponential+Gaussian fit. In the kinematic region considered, the signal to background ratio ranges from 30 in the lowest bin to 3 in the highest bin. We have performed a similar analysis of the distribution, and estimate the total background to be less than 0.5 counts. For extracting yields, we assume that our 14 observed are background free.
To evaluate the efficiency, we use GEANT and a TPC response simulator to create raw pixel level simulated tracks which we then embed into real events. The embedding is crucial for this analysis since it allows us to estimate the effects of cluster merging on our efficiency. No data on and interactions in material exist in the literature, and these antinuclei are not incorporated into GEANT. Instead we use and simulations in GEANT to understand our acceptance and tracking efficiency. We then add a correction for the estimated annihilation in the detector, where we assume that the annihilation cross-section is 1.4 times the annihilation cross-section, and that the annihilation cross-section is twice the annihilation cross-section. The annihilation correction was discussed in a previous publication STARpbarp , and the cross-section scaling relations are taken from Ref. Hoang . Final calculated efficiencies are in the range 0.2-0.5. This is much lower than the typical STAR efficiency for charged particle tracking (0.8-0.9). The difference is due entirely to the restrictive track cuts used in the current analysis to eliminate backgrounds.
Systematic errors were estimated by varying the cuts used in the analysis. These variations include changing the number of hits for a valid track, changing the allowed region of vertex locations, changing the assumed annihilation cross-sections, and changing the range used for the signal+background fit. We estimate the maximum systematic error on the invariant yields to be around 15%. We also assume that the errors on the individual yields are largely correlated. This causes the systematic errors to partially cancel when forming coalescence ratios.
We extract invariant yields in three transverse momentum bins, where each bin has 100 entries. The extracted yields are listed in Table 1. Comparing these yields to lower energies, there is a factor of 50 increase in the production rate in going from GeV NA44 to GeV, and an even more dramatic factor of 60,000 increase in the production rate relative to AGS energy ( GeV) E864 .
The mean transverse momentum of the observed sample is 2.4 GeV/c. We extract an invariant yield per event evaluated at the mean of . We have assumed an exponential transverse mass distribution to calculate a cross-section weighted average efficiency in the STAR acceptance. NA52 has reported two in minimum-bias Pb+Pb collisions at the CERN SPS NA52 . Our invariant yield is higher, but quantitative comparison cannot be made because of the different centralities.
Although only 14 counts were observed, our large kinematic coverage for allows us to estimate the and inverse slope . To do this, we have calculated the expected yield as a function of and using efficiency calculations from embedded data and assuming an exponential transverse mass distribution. We minimize the negative log-likelihood over the entire STAR acceptance taking into account phase-space cells with no observed counts. We extract and an inverse slope GeV.
STAR has measured invariant yields for in a similar centrality range STARpbar . These results can be combined with the invariant yields presented in this paper to calculate coalescence factors using Equation 1. In the coalescence picture, only antinucleons produced directly from the source are available to form light antinuclei. Hence, the yields in the coalescence ratio have been corrected for antihyperon feeddown. We use the RQMD model RQMD and a detector simulator to evaluate the probability of incorrectly assigning a weak-decay produced to the primary vertex, and find that about 455(sys.)% of our sample comes from antihyperon feeddown. This fraction is consistent with preliminary STAR measurements of the ratio. Table 1 lists the total invariant yields along with the estimated correction for antihyperon feeddown.
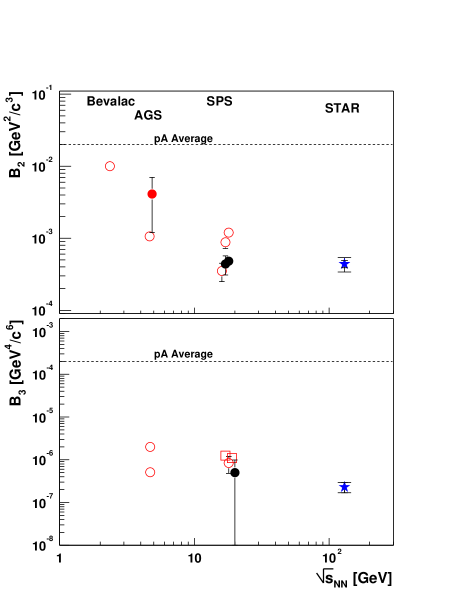
For the top 18% most central collisions, we find in the kinematic region GeV/c and . In the top panel of Fig. 2 we compare this result to previous measurements at lower energies. Here we plot the results for both and . In collisions, is essentially independent of the collision energy. In central nucleus-nucleus collisions, however, the coalescence factor decreases as the collision energy increases from Bevalac to AGS to SPS. The STAR result shows that there is no similar decrease in from GeV to GeV. Comparing the STAR result to the average of the two results at the SPS NA44 ; NA52 , we obtain .
For the top 18% most central collisions, we find in the kinematic region GeV/c and . Once again, we compare to collisions at lower energies in the bottom panel of Fig. 2. The qualitative trend for is very similar to . For collisions, the coalescence factor is independent of energy. For collisions, the coalescence factor decreases with increasing collision energy. The statistics of the measurement at the SPS preclude a quantitative comparison. If we compare to the average of and at the SPS NA52 , we obtain .
Several prescriptions have been proposed for relating the coalescence parameters to a geometrical source size Sato ; Mekjian ; Scheibl ; Llope . For these models, the coalescence parameter scales with the volume as in the limit of an (anti)nucleon volume much larger than the intrinsic size of the produced (anti)nucleus. Using this simple expression, and the measured coalescence parameter ratios, we see that and . Both measurements indicate no large increase of the antinucleon freeze-out volume when going from GeV to GeV. STAR has also measured source sizes using interferometry STARhbt . If we construct a quantity proportional to the volume, , and compare to the published SPS data NA44hbt , we estimate . All three available measurements indicate only a slight increase in volume compared to lower energy collisions. Caution should be exercised, however, when making quantitative comparisons between the volumes measured via coalescence and the volumes measured via HBT since it is not clear that the freeze-out space-time geometry for pions and antinucleons should be the same.
We can also make quantitive estimates of the freeze-out geometry within the context of a particular coalescence model and ask whether the and sources are the same. To do this, we use a simple thermal model Mekjian . This model assumes that antinucleons and antinuclei are in chemical and thermal equilibrium within a volume . From this model, we extract (stat.) fm3, and (stat.) fm3. This discrepancy indicates that the thermal model assumptions are not valid in the production of light antinuclei. The freeze-out from a smaller volume and at a presumably earlier time compared to . This trend of decreasing source size with increasing nucleon number has been observed before in the production of light nuclei Mekjian ; E864 . The coalescence picture of light antinucleus production would predict that the probability for producing an antinucleus with mass is proportional to the power of the local antinucleon density. If the antinucleon source is not of uniform density, one would expect the different mass antinuclei to measure different source sizes, and this is indeed what we observe. We have applied other coalescence models with different assumptions. The Sato and Yazaki model Sato indicates a similar trend as the thermal model, with , while the Scheibl and Heinz model Scheibl , which can be calculated assuming a Gaussian antinucleon density profile and explicitly includes the effects of radial flow, gives . In the Scheibl and Heinz model, an equivalent effective volume, as indicated by the data, would imply a larger total volume for compared to .
In summary, we have made the first measurements of the production of light antinuclei ( and ) in Au+Au collisions at GeV. A large enhancement in production rate is observed compared to lower energies. We have combined the measured yields with measurements of production to extract coalescence parameters and . Quantitative comparisons to SPS results indicate little or no increase of the antinucleon freeze-out volume. We also find that the are produced from a smaller volume than the .
We wish to thank the RHIC Operations Group and the RHIC Computing Facility at Brookhaven National Laboratory, and the National Energy Research Scientific Computing Center at Lawrence Berkeley National Laboratory for their support. This work was supported by the Division of Nuclear Physics and the Division of High Energy Physics of the Office of Science of the U.S.Department of Energy, the United States National Science Foundation, the Bundesministerium fuer Bildung und Forschung of Germany, the Institut National de la Physique Nucleaire et de la Physique des Particules of France, the United Kingdom Engineering and Physical Sciences Research Council, Fundacao de Amparo a Pesquisa do Estado de Sao Paulo, Brazil, and the Russian Ministry of Science and Technology.
References
- [1] B.B. Back et al., Phobos Collaboration, Phys. Rev. Lett.85, 3100 (2000).
- [2] C. Adler et al., STAR Collaboration, Phys. Rev. Lett.86, 4778 (2001).
- [3] S.T. Butler and C.A. Pearson, Phys. Rev. 129, 836 (1963).
- [4] A. Schwarzschild and C. Zupancic, Phys. Rev. 129, 854 (1963).
- [5] H.H. Gutbrod et al., Phys. Rev. Lett.37, 667 (1976).
- [6] H. Sato and K. Yazaki, Phys. Lett. B98, 153 (1981).
- [7] A.Z. Mekjian, Phys. Rev. C17, 1051 (1978); S. Das Gupta and A.Z. Mekjian, Phys. Rep. 72, 131 (1981).
- [8] R. Scheibl and U. Heinz, Phys. Rev. C59, 1585 (1999).
- [9] K.H. Ackermann et al., Nucl. Phys. A661, 681c (1999).
- [10] T.F. Hoang, Bruce Cork and H.J. Crawford, Z. Phys. C 29, 611 (1985).
- [11] I.G. Bearden et al., NA44 Collaboration, Phys. Rev. Lett.85, 2681 (2000).
- [12] T.A. Armstrong et al., E864 Collaboration, Phys. Rev. Lett.85, 2685 (2000); T.A. Armstrong et al., E864 Collaboration, Phys. Rev. C61, 064908 (2000).
- [13] S. Wang et al., EOS Collaboration, Phys. Rev. Lett.74, 2646 (1995).
- [14] G. Appelquist et al., NA52 Collaboration, Phys. Lett. B376, 245 (1996); M. Weber et al., NA52 Collaboration, Nucl. Phys. A661, 177c (1999).
- [15] STAR collaboration, in preparation.
- [16] H. Sorge, Phys. Rev. C52, 3291 (1995).
- [17] G. Ambrosini et al., NA52 Collaboration, Phys. Lett. B417, 202 (1998).
- [18] A.G. Hansen et al., NA44 Collaboration, Nucl. Phys. A661, 387c (1999).
- [19] S.V. Afanasiev et al., NA49 Collaboration, Phys. Lett. B486, 22 (2000).
- [20] M.J. Bennett et al., E878 Collaboration, Phys. Rev. C58, 1155 (1998).
- [21] W.J. Llope et al., Phys. Rev. C52, 2004 (1995).
- [22] C. Adler et al., STAR collaboration, Phys. Rev. Lett.87, 082301 (2001).
- [23] I.G. Bearden et al., NA44 collaboration, Phys. Rev. C58, 1656 (1998).
| w.d. correction | ||||
|---|---|---|---|---|
| 0.55 | ||||
| 0.65 | ||||
| 0.75 | ||||
| 2.4 |