Inclusive Soft Pion Production from 12.3 and 17.5 GeV/c Protons on Be, Cu and Au
Abstract
Differential cross-sections are presented for the inclusive production of charged pions in the momentum range 0.1 to 1.2 GeV/c in interactions of 12.3 and 17.5 GeV/c protons with Be, Cu, and Au targets. The measurements were made by Experiment 910 at the Alternating Gradient Synchrotron in Brookhaven National Laboratory. The cross-sections are presented as a function of pion total momentum and production polar angle with respect to the beam.
pacs:
13.85.Ni, 25.40.VeIntroduction
Pions are copiously produced in hadronic interactions at high energies. However, because of the complexity of soft hadronic interactions, theoretical descriptions of pion spectra in elementary hadronic interactions are difficult to obtain. The situation with pion production in proton-nucleus collisions is even more difficult because of the contributions from the multiple interaction of the projectile proton and potential final-state interactions of the outgoing pions with the nuclear target. At low momentum these final-state interactions are expected to be dominated by the low-lying baryon resonances which are thought to also play an important role in nucleus-nucleus collisions at AGS and lower energies. Precise measurements of pion spectra at low momentum may then provide new insight into the role of these resonances and may help constrain event generators arc ; rqmd which have been used to set a baseline for new phenomena in heavy-ion collisions.
Detailed knowledge of pion spectra at low momentum is also of great practical importance since the production of intense muon beams at potential new high-energy facilities like muon colliders mumu and neutrino factories geer ; studyII relies on the decay of pions produced in a nuclear target. The strong increase in pion yields at very low momentum resulting from the excitation and decay of baryonic resonances in the target may provide the necessary yield per beam proton to make such facilities attractive. Experimental measurement of these spectra is crucial to evaluating the feasibility of generating such intense beams.
Unfortunately, existing data in the low-momentum region ( MeV/c) are limited due to lack of statistics, acceptance, or the particle identification capabilities of previous experiments Abbott ; Baker ; Dekkers ; Lundy ; Marmer . E910 is the first experiment at the AGS to provide a large statistics data set that covers a large angular range at low momentum and to provide particle identification over its entire acceptance. It thus provides an unprecedented opportunity to fill the gap in our knowledge of pion production in proton-nucleus interactions.
Experiment
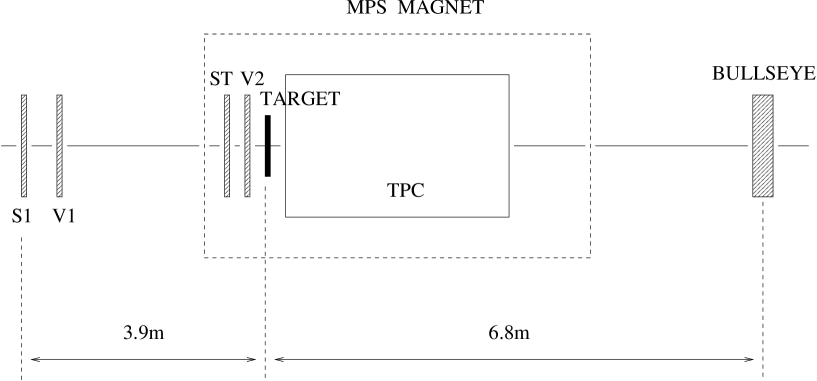
Experiment 910 ran for 14 weeks at the MPS facility in the A1 secondary beamline of the BNL AGS in 1996. Figure 1 shows part of the detector layout pertinent to the inclusive pion production measurement. The total momenta and directions of incoming beam particles were reconstructed using proportional chambers located in the beamline upstream of the target. Three threshold Čerenkov counters along the beamline were used to reject particles in the beam other than protons. A set of trigger counters (S1, ST) and veto counters (V1, V2) located between the proportional chambers and the target were used to detect and constrain the trajectories of incoming beam particles. These are shown in Figure 2. The Au, Cu and Be targets were rectangular with 55, 6.356.35 and 7.622.54 cm2 cross section and 3.9, 4.1 and 3.4 g/cm2 thickness respectively. The beam spot on the target was defined by the last veto scintillator which had a 21 cm2 slot with semicircular ends.
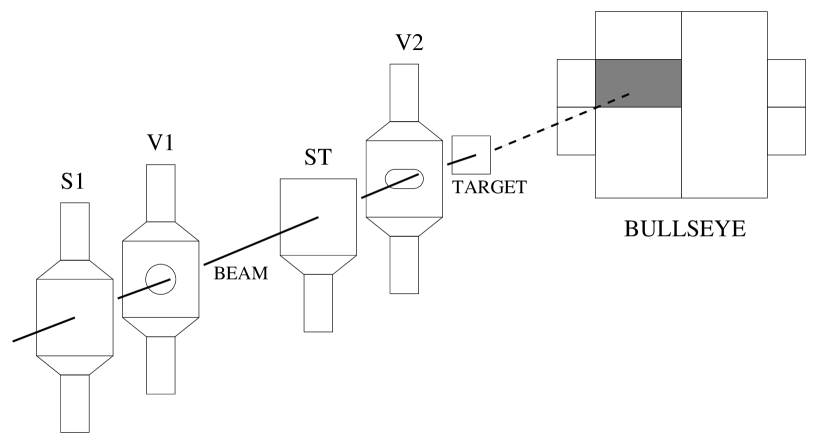
The EOS time projection chamber (TPC) TPC was placed inside the MPS magnet with its active gas volume about 10 cm downstream of the target and with its long axis () approximately aligned with the incoming beam direction. It contains 15360 pads of size 0.81.2 cm2 arranged in 128 transverse () rows with 120 pads each to give a 96153.6 cm2 footprint for the pad plane. The total vertical drift distance used for recorded ADC samples was 70 cm. The magnetic field had a strength of 0.5 T and was oriented along the vertical () direction. A vertical electric field of 120 V/cm supplied the drift force on electrons from ionization by charged tracks in the P10 gas at atmospheric pressure. Pad signals were sampled by 12 bit ADCs every 100 ns. Signals from charged tracks were reconstructed as hits in the TPC centered on padrows in with the position given by a charge weighted mean of the signal from several pads in a row and the position calculated by the offset from a gamma function fit to the time dependence. Reconstructed hit positions were corrected for shifts due to inhomogeneities in the magnetic field before tracking. Simultaneous track finding and momentum reconstruction with a fixed radius helical fit Karimaki was followed by primary vertex reconstruction Patrick by projecting the beam track forward and TPC tracks back to the target. Track momenta were then refit using the magnetic field map. The trigger of the production results in this paper was obtained by requiring the absence of a beam particle in a downstream “bullseye” counter. This counter consisted of two pairs of scintillator slats, one pair of cm slats placed along the vertical and the other cm pair along the horizontal. Beam particles consistent with the aperture defined by the veto counters were entirely located within the intersection of one of the horizontal and one of the vertical slats as shown in Figure 2. In addition to about 4 million minimum bias bullseye triggers, a set of pure beam triggers was also recorded and used to study potential biases in the bullseye trigger and to check the normalization of the spectra. A large fraction of bullseye triggers came from interactions well downstream of the target due to material in the beam path (including wire chambers and a Čerenkov detector located between the TPC and bullseye, as well as the TPC gas).

Data Analysis
We required a minimum of ten hits in the TPC for charged tracks associated with the vertex. We also required the reconstructed primary vertex to be consistent with the target position and the veto hole. Interactions were identified as events with a succesfully reconstructed vertex with at least two charged tracks in the TPC. Two-prong events consistent with a beam track and a delta electron from the target were removed from the interaction sample. After these cuts, there were 16.5-79K events in the bullseye trigger samples for the six data sets. Table 1 shows the event statistics. The primary method of particle identification used for slow pions was ionization energy loss . Figure 3 shows as a function of momentum below 1.4 GeV/c. Note the overlap of the pion band with the proton band above 1.2 GeV/c and the overlap of pions in the 100-200 MeV/c range with electrons/positrons resulting primarily from pair production through photon conversions in the nuclear targets. The for each track was calculated using a 5-65% truncated mean after discarding any hits that were shared with other tracks. A residual shift of the truncated mean with the number of samples was corrected for using a quadratic fit and the resulting distributions were very nearly gaussian.
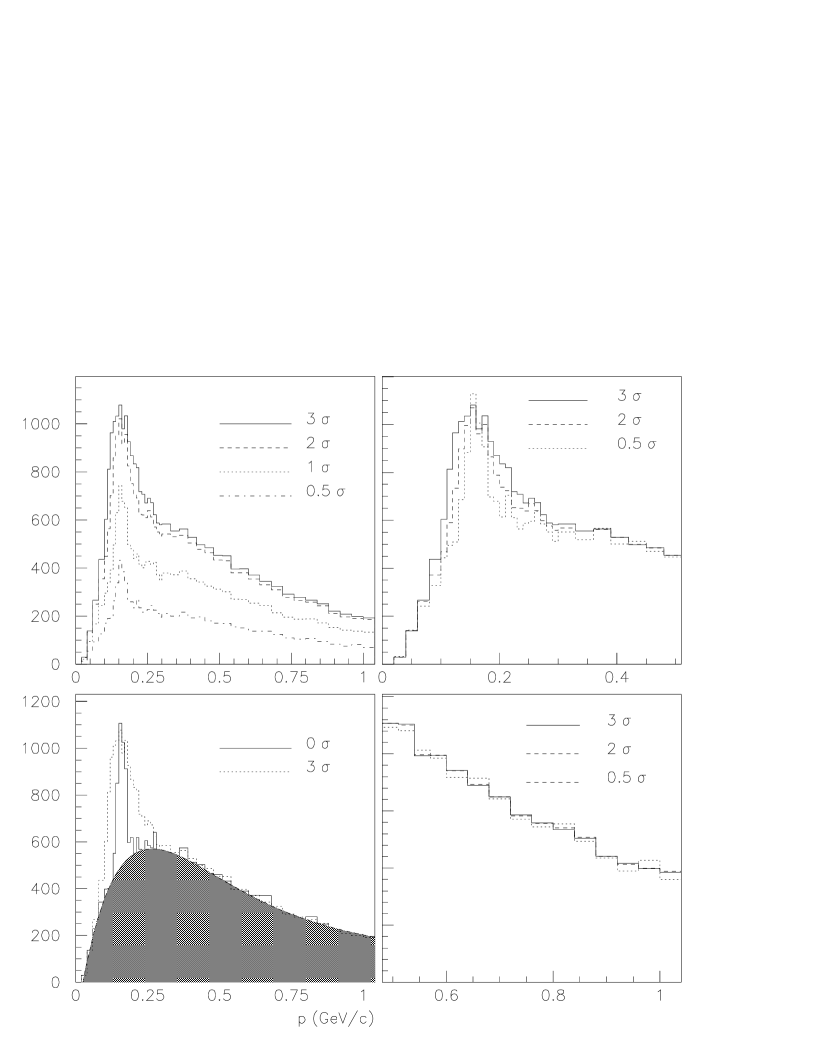
To resolve the particle identification ambiguity in the low momentum overlap region, we used the following simple method illustrated in Figure 4. First we took momentum distributions with progressively narrower cuts on the width around the pion band: , , , etc. These have the electron background confined to a shrinking region of momentum. Then we extrapolated the resulting distributions to zero width after proper scaling. Finally we fit the extrapolated distribution and subtracted the electron component. In this fit, we used the product of an exponential and a third order polynomial for the pion distribution and a gaussian for the electron distribution. The width extrapolation and acceptance correction were done in two dimensions (), whereas the two-component fitting was carried out on one dimensional momentum projections.

The geometric acceptance of the TPC covers most of the forward hemisphere. We applied fiducial cuts to the data to exclude regions where the acceptance is less than 10%. The full acceptance, shown in Figure 5 was calculated by running eight million pion tracks for each target through a GEANT simulation of our experiment, which included all the relevant processes (energy loss, multiple scattering, decay) as well as hit and track reconstruction efficiencies. We also ran a million 17.5 GeV/c p-Au events generated by RQMD rqmd through the simulation to evaluate multitrack effects.
A lower momentum cutoff of 100 MeV/c was set by requiring the momentum resolution from multiple scattering and energy loss to be below 5%. This is well within the geometric acceptance. The 1.2 GeV/c limit at the other end is due to the overlap between protons and pions. We picked bin sizes in momentum (100 MeV/c) and (0.1) to keep the statistical uncertainty in each bin below 20%. The 100-200 MeV/c bin is further split in two (100-140 and 140-200 MeV/c) in cases where the electron pion overlap was restricted to the 140-200 MeV/c region. Our momentum resolution ranges from 2% at 1.2 GeV/c to 4.5% at 100 MeV/c. The decay loss in the lowest momentum bin is less than 4%. Multitrack effects contribute less than 5% to the uncertainty in production results. Also, we estimate the effect of reinteraction and pion absorption in the target to be less than 5% each based on simulations.
Results
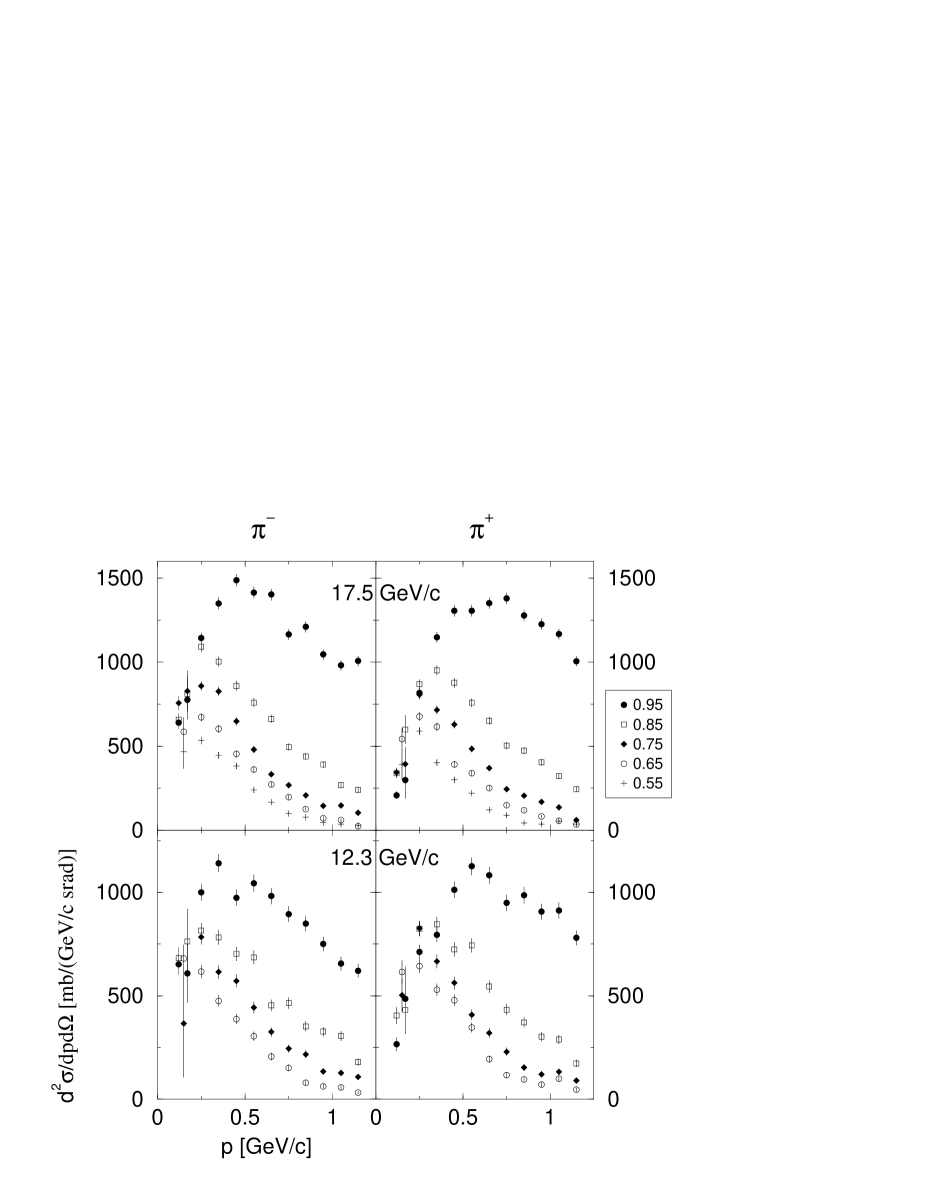
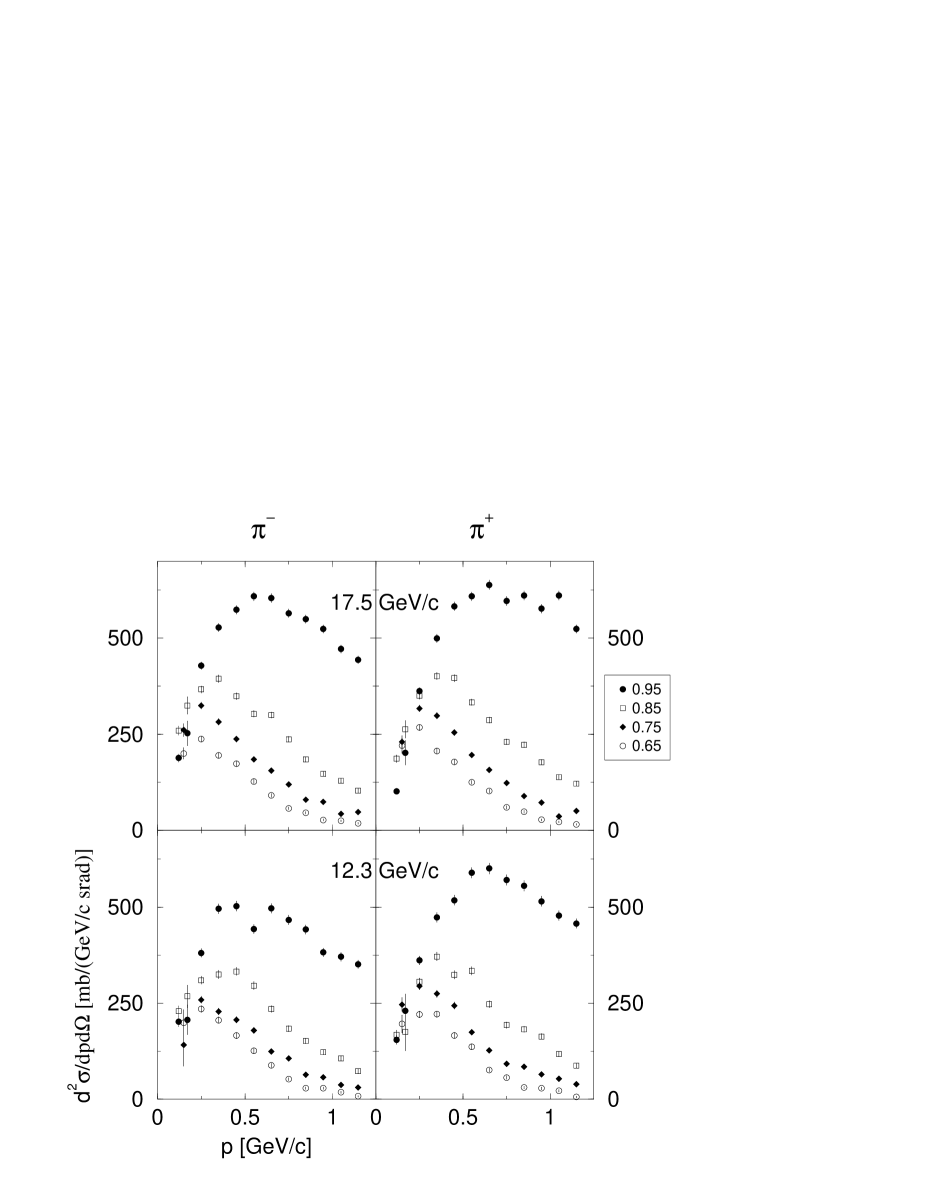
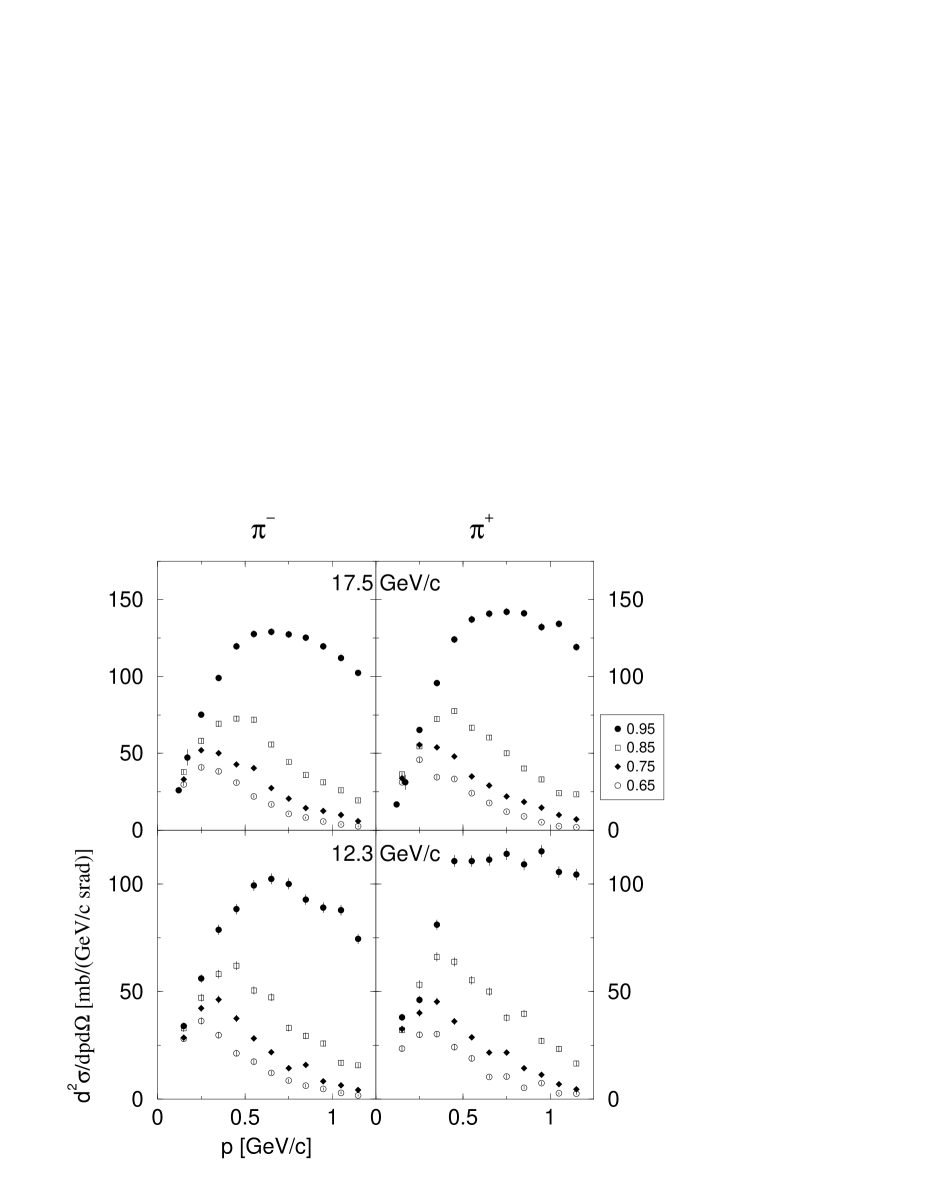
The differential cross section for pion production for Au, Cu and Be targets at 12.3 and 17.5 GeV/c are shown in figures 6 to 8 and tables 2 to 5. These were calculated in the lab frame as
where is the atomic weight and is Avogadro’s number. and are the number of incoming beam particles and the area density of the target. stands for the acceptance, and are the bin sizes and is the number of pions in the bin. We rescaled the final results by the ratio of measured interaction rates in the beam and bullseye samples. This correction ranged from 2 to 10% and is shown in Table 1. There is also a 2% uncertainty in the target thickness. We estimate the overall normalization uncertainty to be less than 5%. The errors listed are statistical, but include the uncertainty from electron background subtraction. After performing the subtraction using a gaussian fit for the electron contamination, we chose the momentum binning such that the entire overlap region after width extrapolation was contained in a single bin. We added the uncertainty in the area of the gaussian fit to the error bar for the signal in that bin.
| Beam | Target | Number of | Correction |
| Momentum | Interactions | Factor | |
| Au | 32121 | 1.052 | |
| 17.5 GeV/c | Cu | 54591 | 1.033 |
| Be | 78927 | 1.080 | |
| Au | 16522 | 1.023 | |
| 12.3 GeV/c | Cu | 36891 | 1.096 |
| Be | 41790 | 1.040 |
We note that the spectra change from relatively flat momentum distributions in the forward direction to low momentum peaks at higher angles. Pion production is mostly forward at higher momenta whereas it is almost isotropic at lower momenta. This is more pronounced for the heavier Au nucleus than for the lighter Be nucleus.
An interesting feature of the Au data is the large excess over at the lowest momenta, which is larger at the higher beam energy. One can attribute this in part to the neutron/proton ratio of the Au nucleus. Such low momentum pions are most likely produced through the decay of resonances and the intranuclear cascade could favor negative pions over positives. The effect is diminished for Be and Cu which have about the same number of neutrons as protons.
Looking at the 17.5 GeV/c p-Au distributions in more detail, for , the peak in production shifts from about 450 MeV/c momentum in the most forward bin to about 250 MeV/c in all larger angle bins. distributions are peaked at higher momenta, around 750 MeV/c in the most forward bin and 350 MeV/c in the second forward bin, while larger angle bins look similar. and yields are very close above 500 MeV/c in all except the most forward bin. The excess over is most pronounced in the three most forward bins where the to ratio in the 100-140 MeV/c momentum bin is 2-3. At larger angles, the and yields are close. The large to yield ratio at low momenta and forward angles warrants further study. There are no significant systematic effects in our tracking to bias the reconstruction against one sign. Our acceptance is also insensitive to the sign of track curvature within the region of momentum space considered in our reported results. Neutral decay contribution, on the other hand, may be appreciable and we can not rule out the possibility that some of the asymmetry between and at low momentum is due to the decays of slow ’s. We have used the results of our 17.5 GeV/c p+Au RQMD simulation to evaluate this effect within the context of that model. Although the contribution of decays to the total yield below 1.2 GeV/c is small (about 3%), it is up to 8% at 100-300 MeV/c in the most forward bin and lower in the larger angle bins. The decay contribution to and yields in this sample is no more than 2% of the total in any bin.
Acknowledgements.
We thank Dr. R. W. Hackenburg and the MPS staff, J. Scaduto, and Dr. G. Bunce for their help in setting up and running the experiment. We also thank T. Schlagel and A. Stange for help with computing resources at BNL for data analysis. This work was supported by the U.S. Department of Energy under contracts with BNL (DE-AC02-98CH10886), Columbia (DE-FG02-86ER40281), ISU (DOE-FG02-92ER4069), KSU (DE-FG02-89ER40531), LBNL (DE-AC03-76F00098), LLNL (W-7405-ENG-48), ORNL (DE-AC05-96OR22464), and UT (DE-FG02-96ER40982), and the National Science Foundation under contract with Florida State University (PHY-9523974). It was also supported in part by grants from the Illinois Board of Higher Education and the Illinois Department of Commerce and Community Affairs.References
- (1) S. H. Kahana, Y. Pang and T. J. Schlagel, in Proceedings of Heavy Ion Physics at the AGS - HIPAGS 93, eds. G. S. Stephans, S. G. Steadman and W. E. Kehoe.
- (2) H. Sorge, Phys. Rev. C 52, 3291 (1995).
- (3) C. M. Ankenbrandt et al., Phys. Rev. ST Accel. Beams 2, 081001 (1999).
- (4) S. Geer, Phys. Rev. D 57, 6989 (1998)
- (5) Feasibility Study-II of a Muon-Based Neutrino Source, eds. S. Ozaki, R. Palmer, M. Zisman, and J. Gallardo, BNL-52623, June 2001
- (6) T. Abbott et al., Phys. Rev. D 45, 3906 (1992)
- (7) W. F. Baker et al., Phys. Rev. Lett. 7, 101 (1961)
- (8) D. Dekkers et al., Phys. Rev. 137, B962 (1962)
- (9) R. A. Lundy et al., Phys. Rev. Lett. 14, 504 (1965)
- (10) G. J. Marmer et al., Phys. Rev. 179, 1294 (1969)
- (11) G. Rai et al., IEEE Trans. Nucl. Sci. 37, 56 (1990)
- (12) V. Karimäki, Nucl. Instr. and Meth. A305, 187 (1991)
- (13) G. N. Patrick and B. Schorr, Nucl. Instr. and Meth. A241, 132 (1985)
| 17.5 GeV/c | 12.3 GeV/c | ||||||||
|---|---|---|---|---|---|---|---|---|---|
| error(stat) | error(stat) | error(stat) | error(stat) | ||||||
| [GeV/c] | [mb/(GeV/c)] | [mb/(GeV/c)] | |||||||
| 0.95 | 0.12 | 208.3 | 20.5 | 640.4 | 35.9 | 265.8 | 31.5 | 652.2 | 49.3 |
| 0.17 | 297.8 | 106.7 | 776.6 | 116.0 | 486.2 | 153.0 | 609.1 | 142.0 | |
| 0.25 | 817.0 | 25.6 | 1143.0 | 30.3 | 712.6 | 32.6 | 1000.1 | 38.6 | |
| 0.35 | 1146.9 | 30.4 | 1349.5 | 32.9 | 794.6 | 34.4 | 1140.5 | 41.3 | |
| 0.45 | 1305.6 | 32.4 | 1487.8 | 34.6 | 1011.7 | 38.9 | 974.1 | 38.1 | |
| 0.55 | 1304.9 | 32.4 | 1414.5 | 33.7 | 1125.7 | 41.0 | 1043.8 | 39.5 | |
| 0.65 | 1350.5 | 32.9 | 1402.3 | 33.6 | 1082.4 | 40.2 | 981.5 | 38.3 | |
| 0.75 | 1378.8 | 33.3 | 1165.3 | 30.6 | 948.0 | 37.6 | 894.9 | 36.5 | |
| 0.85 | 1277.7 | 32.0 | 1209.3 | 31.2 | 985.8 | 38.4 | 849.0 | 35.6 | |
| 0.95 | 1225.7 | 31.4 | 1045.3 | 29.0 | 906.8 | 36.8 | 749.9 | 33.5 | |
| 1.05 | 1167.6 | 30.6 | 980.9 | 28.1 | 912.6 | 36.9 | 655.1 | 31.3 | |
| 1.15 | 1004.6 | 28.4 | 1007.5 | 28.5 | 779.5 | 34.1 | 621.1 | 30.5 | |
| 0.85 | 0.12 | 339.9 | 26.1 | 656.5 | 36.3 | 404.0 | 38.8 | 682.0 | 50.4 |
| 0.17 | 599.1 | 84.5 | 811.4 | 102.6 | 430.9 | 114.2 | 763.2 | 155.7 | |
| 0.25 | 867.8 | 26.4 | 1091.3 | 29.6 | 824.4 | 35.1 | 815.3 | 34.9 | |
| 0.35 | 951.5 | 27.7 | 1003.6 | 28.4 | 845.7 | 35.5 | 782.7 | 34.2 | |
| 0.45 | 876.5 | 26.5 | 859.1 | 26.3 | 724.1 | 32.9 | 702.4 | 32.4 | |
| 0.55 | 758.1 | 24.7 | 759.3 | 24.7 | 743.8 | 33.3 | 685.4 | 32.0 | |
| 0.65 | 651.6 | 22.9 | 661.8 | 23.1 | 544.2 | 28.5 | 454.1 | 26.0 | |
| 0.75 | 503.0 | 20.1 | 494.7 | 19.9 | 433.4 | 25.4 | 465.0 | 26.3 | |
| 0.85 | 472.4 | 19.5 | 438.6 | 18.8 | 371.5 | 23.5 | 352.8 | 22.9 | |
| 0.95 | 404.5 | 18.0 | 390.5 | 17.7 | 302.2 | 21.2 | 327.1 | 22.1 | |
| 1.05 | 321.5 | 16.1 | 268.4 | 14.7 | 288.4 | 20.7 | 305.6 | 21.4 | |
| 1.15 | 245.1 | 14.0 | 240.4 | 13.9 | 173.5 | 16.1 | 179.3 | 16.4 | |
| 17.5 GeV/c | 12.3 GeV/c | ||||||||
|---|---|---|---|---|---|---|---|---|---|
| error(stat) | error(stat) | error(stat) | error(stat) | ||||||
| [GeV/c] | [mb/(GeV/c)] | [mb/(GeV/c)] | |||||||
| 0.75 | 0.12 | 344.3 | 26.3 | 755.4 | 39.0 | ||||
| 502.4 | 77.4 | 366.7 | 260.8 | ||||||
| 0.17 | 392.7 | 101.1 | 828.1 | 119.4 | |||||
| 0.25 | 806.2 | 25.5 | 857.3 | 26.2 | 826.4 | 35.1 | 783.6 | 34.2 | |
| 0.35 | 715.5 | 24.0 | 826.4 | 25.8 | 667.0 | 31.6 | 614.7 | 30.3 | |
| 0.45 | 629.9 | 22.5 | 648.1 | 22.8 | 562.4 | 29.0 | 571.7 | 29.2 | |
| 0.55 | 483.5 | 19.7 | 479.3 | 19.6 | 407.8 | 24.7 | 443.4 | 25.7 | |
| 0.65 | 369.9 | 17.2 | 333.4 | 16.4 | 320.4 | 21.9 | 324.9 | 22.0 | |
| 0.75 | 244.3 | 14.0 | 268.2 | 14.7 | 229.7 | 18.5 | 244.0 | 19.1 | |
| 0.85 | 204.5 | 12.8 | 207.3 | 12.9 | 153.0 | 15.4 | 217.5 | 18.0 | |
| 0.95 | 168.5 | 11.6 | 145.2 | 10.8 | 120.9 | 13.4 | 133.4 | 14.1 | |
| 1.05 | 135.6 | 10.4 | 146.6 | 10.9 | 132.2 | 14.0 | 128.0 | 13.8 | |
| 1.15 | 59.8 | 7.8 | 104.5 | 9.2 | 90.7 | 12.6 | 108.0 | 12.7 | |
| 0.65 | 0.15 | 541.6 | 62.5 | 586.7 | 83.5 | 615.5 | 54.5 | 680.7 | 64.3 |
| 0.25 | 676.2 | 23.3 | 671.1 | 23.2 | 643.3 | 31.0 | 616.5 | 30.3 | |
| 0.35 | 615.3 | 22.2 | 602.6 | 22.0 | 530.0 | 28.1 | 475.5 | 26.6 | |
| 0.45 | 392.1 | 17.8 | 454.0 | 19.1 | 478.0 | 26.7 | 387.4 | 24.0 | |
| 0.55 | 338.4 | 16.5 | 361.0 | 17.0 | 346.6 | 22.7 | 305.0 | 21.3 | |
| 0.65 | 251.1 | 14.2 | 273.4 | 14.8 | 193.2 | 17.0 | 207.0 | 17.6 | |
| 0.75 | 149.8 | 11.0 | 196.2 | 12.6 | 117.3 | 13.3 | 151.0 | 15.0 | |
| 0.85 | 118.8 | 9.8 | 126.3 | 10.1 | 94.9 | 11.9 | 79.7 | 11.4 | |
| 0.95 | 81.9 | 8.3 | 71.6 | 7.6 | 71.2 | 11.0 | 62.7 | 9.9 | |
| 1.05 | 55.9 | 6.9 | 59.8 | 6.9 | 99.0 | 12.2 | 56.1 | 9.2 | |
| 1.15 | 35.4 | 6.0 | 24.5 | 5.0 | 46.9 | 9.0 | 32.3 | 6.9 | |
| 0.55 | 0.15 | 391.1 | 88.0 | 467.2 | 100.5 | ||||
| 0.25 | 589.7 | 21.8 | 533.5 | 20.7 | |||||
| 0.35 | 402.2 | 18.0 | 445.9 | 18.9 | |||||
| 0.45 | 300.1 | 15.5 | 382.9 | 17.5 | |||||
| 0.55 | 219.9 | 13.3 | 239.0 | 13.9 | |||||
| 0.65 | 122.0 | 9.9 | 165.5 | 11.5 | |||||
| 0.75 | 88.9 | 8.7 | 99.5 | 8.9 | |||||
| 0.85 | 42.3 | 5.9 | 77.7 | 7.9 | |||||
| 0.95 | 37.7 | 6.2 | 44.8 | 6.2 | |||||
| 1.05 | 54.4 | 6.6 | 36.0 | 5.4 | |||||
| 1.15 | 36.0 | 5.6 | 28.2 | 4.8 | |||||
| 17.5 GeV/c | 12.3 GeV/c | ||||||||
|---|---|---|---|---|---|---|---|---|---|
| error(stat) | error(stat) | error(stat) | error(stat) | ||||||
| [GeV/c] | [mb/(GeV/c)] | [mb/(GeV/c)] | |||||||
| 0.95 | 0.12 | 101.4 | 7.3 | 188.1 | 9.9 | 154.4 | 11.0 | 202.2 | 12.6 |
| 0.17 | 201.7 | 31.4 | 252.1 | 31.7 | 229.8 | 43.4 | 206.9 | 38.4 | |
| 0.25 | 362.3 | 8.7 | 428.2 | 9.4 | 361.2 | 10.6 | 380.5 | 10.9 | |
| 0.35 | 499.2 | 10.2 | 527.5 | 10.5 | 473.4 | 12.2 | 495.6 | 12.5 | |
| 0.45 | 582.7 | 11.0 | 573.6 | 10.9 | 517.9 | 12.7 | 502.9 | 12.5 | |
| 0.55 | 608.5 | 11.3 | 608.5 | 11.3 | 589.4 | 13.6 | 442.8 | 11.8 | |
| 0.65 | 638.6 | 11.5 | 604.2 | 11.2 | 600.5 | 13.7 | 496.9 | 12.5 | |
| 0.75 | 596.4 | 11.1 | 564.5 | 10.8 | 570.3 | 13.4 | 466.5 | 12.1 | |
| 0.85 | 611.1 | 11.3 | 549.5 | 10.7 | 555.1 | 13.2 | 441.7 | 11.8 | |
| 0.95 | 576.4 | 11.0 | 524.0 | 10.4 | 514.9 | 12.7 | 382.0 | 10.9 | |
| 1.05 | 610.5 | 11.3 | 471.2 | 9.9 | 477.5 | 12.2 | 370.7 | 10.8 | |
| 1.15 | 523.7 | 10.4 | 443.5 | 9.6 | 457.3 | 12.0 | 350.9 | 10.5 | |
| 0.85 | 0.12 | 186.2 | 9.8 | 259.1 | 11.6 | 167.4 | 11.4 | 228.7 | 13.4 |
| 0.17 | 262.9 | 22.3 | 324.6 | 22.3 | 175.0 | 48.8 | 267.7 | 29.0 | |
| 0.25 | 349.9 | 8.5 | 366.6 | 8.7 | 305.6 | 9.8 | 309.9 | 9.9 | |
| 0.35 | 401.1 | 9.1 | 394.3 | 9.1 | 371.1 | 10.8 | 324.5 | 10.1 | |
| 0.45 | 395.9 | 9.1 | 349.3 | 8.5 | 323.8 | 10.1 | 332.6 | 10.2 | |
| 0.55 | 333.3 | 8.3 | 302.9 | 7.9 | 334.2 | 10.2 | 295.7 | 9.6 | |
| 0.65 | 286.3 | 7.7 | 299.8 | 7.9 | 247.6 | 8.8 | 234.6 | 8.6 | |
| 0.75 | 230.1 | 6.9 | 236.8 | 7.0 | 192.9 | 7.8 | 183.9 | 7.6 | |
| 0.85 | 222.6 | 6.8 | 184.3 | 6.2 | 182.1 | 7.6 | 151.8 | 6.9 | |
| 0.95 | 177.2 | 6.1 | 146.9 | 5.5 | 163.4 | 7.2 | 121.9 | 6.2 | |
| 1.05 | 138.5 | 5.4 | 128.9 | 5.2 | 117.4 | 6.1 | 105.9 | 5.8 | |
| 1.15 | 121.4 | 5.0 | 102.8 | 4.6 | 87.2 | 5.2 | 72.7 | 4.8 | |
| 0.75 | 0.15 | 229.7 | 16.4 | 260.9 | 16.6 | 246.4 | 17.5 | 141.5 | 54.9 |
| 0.25 | 317.0 | 8.1 | 324.3 | 8.2 | 294.2 | 9.6 | 258.6 | 9.0 | |
| 0.35 | 298.3 | 7.9 | 282.2 | 7.7 | 274.2 | 9.3 | 228.5 | 8.5 | |
| 0.45 | 254.3 | 7.3 | 237.3 | 7.0 | 243.7 | 8.7 | 206.9 | 8.0 | |
| 0.55 | 195.4 | 6.4 | 184.5 | 6.2 | 174.2 | 7.4 | 178.8 | 7.5 | |
| 0.65 | 156.5 | 5.7 | 154.6 | 5.7 | 126.8 | 6.3 | 123.8 | 6.2 | |
| 0.75 | 123.2 | 5.1 | 119.3 | 5.0 | 92.5 | 5.4 | 105.8 | 5.8 | |
| 0.85 | 89.2 | 4.3 | 79.5 | 4.1 | 84.8 | 5.2 | 63.5 | 4.5 | |
| 0.95 | 71.8 | 3.9 | 73.9 | 3.9 | 64.9 | 4.5 | 57.2 | 4.2 | |
| 1.05 | 36.0 | 2.7 | 43.0 | 3.0 | 52.9 | 4.0 | 37.3 | 3.4 | |
| 1.15 | 50.5 | 3.2 | 47.0 | 3.1 | 39.2 | 3.5 | 30.8 | 3.1 | |
| 0.65 | 0.15 | 220.2 | 19.4 | 200.0 | 14.5 | 195.9 | 22.9 | 198.8 | 33.7 |
| 0.25 | 267.8 | 7.5 | 237.0 | 7.0 | 220.6 | 8.3 | 234.5 | 8.6 | |
| 0.35 | 206.3 | 6.6 | 194.3 | 6.4 | 221.3 | 8.3 | 205.6 | 8.0 | |
| 0.45 | 177.5 | 6.1 | 173.0 | 6.0 | 166.0 | 7.2 | 165.7 | 7.2 | |
| 0.55 | 124.9 | 5.1 | 127.2 | 5.1 | 136.4 | 6.5 | 126.0 | 6.3 | |
| 0.65 | 102.1 | 4.6 | 90.8 | 4.3 | 76.2 | 4.9 | 87.9 | 5.2 | |
| 0.75 | 59.8 | 3.5 | 57.1 | 3.4 | 56.5 | 4.2 | 52.2 | 4.0 | |
| 0.85 | 47.8 | 3.2 | 45.3 | 3.1 | 30.6 | 3.1 | 28.7 | 3.0 | |
| 0.95 | 27.1 | 2.4 | 27.0 | 2.4 | 28.5 | 3.1 | 28.5 | 3.0 | |
| 1.05 | 21.6 | 2.1 | 24.6 | 2.3 | 22.1 | 2.6 | 18.1 | 2.4 | |
| 1.15 | 15.2 | 1.8 | 17.7 | 1.9 | 6.3 | 1.8 | 7.6 | 1.7 | |
| 17.5 GeV/c | 12.3 GeV/c | ||||||||
| error(stat) | error(stat) | error(stat) | error(stat) | ||||||
| [GeV/c] | [mb/(GeV/c)] | [mb/(GeV/c)] | |||||||
| 0.95 | 0.12 | 16.8 | 1.2 | 26.0 | 1.5 | ||||
| 0.15 | 38.1 | 1.5 | 34.0 | 1.4 | |||||
| 0.17 | 31.2 | 4.7 | 47.3 | 5.1 | |||||
| 0.25 | 65.3 | 1.5 | 75.2 | 1.6 | 46.2 | 1.7 | 56.0 | 1.8 | |
| 0.35 | 95.8 | 1.8 | 99.1 | 1.9 | 81.2 | 2.2 | 78.7 | 2.2 | |
| 0.45 | 124.2 | 2.1 | 119.7 | 2.1 | 110.7 | 2.6 | 88.3 | 2.3 | |
| 0.55 | 137.2 | 2.2 | 127.7 | 2.1 | 110.6 | 2.6 | 99.3 | 2.4 | |
| 0.65 | 140.8 | 2.2 | 129.1 | 2.1 | 111.3 | 2.6 | 102.4 | 2.5 | |
| 0.75 | 142.2 | 2.2 | 127.5 | 2.1 | 114.0 | 2.6 | 100.0 | 2.4 | |
| 0.85 | 141.1 | 2.2 | 125.2 | 2.1 | 109.1 | 2.5 | 92.8 | 2.3 | |
| 0.95 | 132.2 | 2.2 | 119.6 | 2.1 | 115.3 | 2.6 | 89.0 | 2.3 | |
| 1.05 | 134.3 | 2.2 | 112.1 | 2.0 | 105.5 | 2.5 | 87.8 | 2.3 | |
| 1.15 | 119.1 | 2.1 | 102.4 | 1.9 | 104.4 | 2.5 | 74.4 | 2.1 | |
| 0.85 | 0.15 | 36.3 | 1.1 | 37.9 | 1.2 | 32.2 | 1.4 | 32.9 | 1.4 |
| 0.25 | 54.5 | 1.4 | 58.1 | 1.4 | 53.3 | 1.8 | 47.1 | 1.7 | |
| 0.35 | 72.3 | 1.6 | 69.2 | 1.6 | 66.1 | 2.0 | 58.2 | 1.9 | |
| 0.45 | 77.6 | 1.7 | 72.5 | 1.6 | 63.9 | 1.9 | 62.0 | 1.9 | |
| 0.55 | 66.6 | 1.5 | 71.8 | 1.6 | 55.3 | 1.8 | 50.5 | 1.7 | |
| 0.65 | 60.3 | 1.5 | 55.9 | 1.4 | 50.0 | 1.7 | 47.4 | 1.7 | |
| 0.75 | 50.2 | 1.3 | 44.4 | 1.3 | 37.9 | 1.5 | 33.1 | 1.4 | |
| 0.85 | 40.1 | 1.2 | 35.8 | 1.1 | 39.7 | 1.5 | 29.4 | 1.3 | |
| 0.95 | 33.1 | 1.1 | 31.2 | 1.0 | 27.1 | 1.3 | 25.9 | 1.2 | |
| 1.05 | 24.0 | 0.9 | 26.0 | 1.0 | 23.3 | 1.2 | 16.9 | 1.0 | |
| 1.15 | 23.3 | 0.9 | 19.4 | 0.8 | 16.7 | 1.0 | 15.7 | 1.0 | |
| 0.75 | 0.15 | 33.7 | 1.1 | 33.2 | 1.1 | 32.6 | 1.4 | 28.6 | 1.3 |
| 0.25 | 55.5 | 1.4 | 52.1 | 1.4 | 40.1 | 1.5 | 42.3 | 1.6 | |
| 0.35 | 53.9 | 1.4 | 50.0 | 1.3 | 45.4 | 1.6 | 46.3 | 1.7 | |
| 0.45 | 48.1 | 1.3 | 42.8 | 1.2 | 36.1 | 1.5 | 37.6 | 1.5 | |
| 0.55 | 35.0 | 1.1 | 40.4 | 1.2 | 28.7 | 1.3 | 28.3 | 1.3 | |
| 0.65 | 29.1 | 1.0 | 27.4 | 1.0 | 21.7 | 1.1 | 21.9 | 1.1 | |
| 0.75 | 22.1 | 0.9 | 20.6 | 0.9 | 21.7 | 1.1 | 14.5 | 0.9 | |
| 0.85 | 18.5 | 0.8 | 14.5 | 0.7 | 14.4 | 0.9 | 15.9 | 1.0 | |
| 0.95 | 14.7 | 0.7 | 12.6 | 0.7 | 11.4 | 0.8 | 8.3 | 0.7 | |
| 1.05 | 9.9 | 0.6 | 9.9 | 0.6 | 6.9 | 0.6 | 6.5 | 0.6 | |
| 1.15 | 7.1 | 0.5 | 6.0 | 0.5 | 4.6 | 0.5 | 4.3 | 0.5 | |
| 0.65 | 0.15 | 31.3 | 1.1 | 29.8 | 1.0 | 23.6 | 1.2 | 28.1 | 1.3 |
| 0.25 | 45.8 | 1.3 | 40.9 | 1.2 | 29.9 | 1.3 | 36.4 | 1.5 | |
| 0.35 | 34.5 | 1.1 | 38.2 | 1.2 | 30.4 | 1.3 | 29.7 | 1.3 | |
| 0.45 | 33.4 | 1.1 | 31.0 | 1.0 | 24.2 | 1.2 | 21.3 | 1.1 | |
| 0.55 | 24.2 | 0.9 | 22.0 | 0.9 | 19.0 | 1.1 | 17.5 | 1.0 | |
| 0.65 | 17.7 | 0.8 | 16.7 | 0.8 | 10.4 | 0.8 | 12.3 | 0.9 | |
| 0.75 | 12.1 | 0.7 | 10.7 | 0.6 | 10.5 | 0.8 | 8.6 | 0.7 | |
| 0.85 | 9.0 | 0.6 | 8.2 | 0.5 | 5.4 | 0.6 | 6.3 | 0.6 | |
| 0.95 | 5.1 | 0.4 | 5.8 | 0.5 | 7.4 | 0.7 | 4.8 | 0.5 | |
| 1.05 | 2.7 | 0.3 | 3.8 | 0.4 | 2.7 | 0.4 | 3.0 | 0.4 | |
| 1.15 | 1.8 | 0.3 | 2.5 | 0.3 | 2.7 | 0.4 | 1.7 | 0.3 | |