Transverse mass distributions of neutral pions from 208Pb-induced reactions at 158 GeV
Abstract
Results on transverse mass spectra of neutral pions measured at central rapidity are presented for impact parameter selected 158 GeV Pb + Pb, and Pb + Nb collisions. The distributions cover the range . The change of the spectral shape and the multiplicity with centrality is studied in detail. In going from p+p to semi-peripheral Pb+Pb collisions there is a nuclear enhancement increasing with transverse mass similar to the well known Cronin effect, while for very central collisions this enhancement appears to be weaker than expected.
pacs:
25.75.DwParticle and resonance production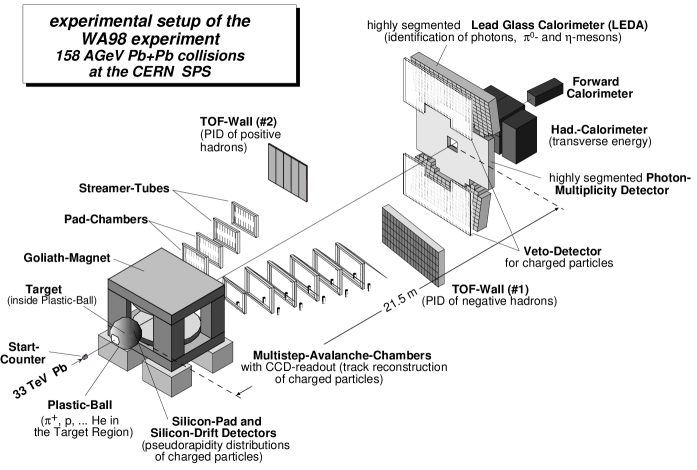
1 Introduction
Heavy ion reactions at ultrarelativistic energies provide information on nuclear matter at high energy density (for reviews see e.g. qm96 ; qm97 ; qm99 ). Hadron production is generally considered to be sensitive to the late freeze-out stage of the collision, when hadrons decouple from one another. Already from the experimentally determined shape of the transverse mass spectra it is evident that heavy ion reactions are not merely a superposition of nucleon-nucleon collisions Jones:1996xc ; na44:coll ; wa80:pi0:98 .
The broadening of the transverse mass spectra in p+A collisions compared to p+p (Cronin-effect cronin ) has been attributed to initial state multiple scattering of partons krzywicki79 ; LEV83 . However, models which attempt to describe nucleus-nucleus reactions, like the Monte-Carlo programs VENUS WERNER93a or RQMD sorge89 rely on the assumption that final state rescattering plays an important role in determination of the momentum distributions of the hadrons. If final state rescattering is very strong, the notion of local kinetic equilibrium may be valid, which is the basic assumption for a hydrodynamical description (see e.g. LEE89 ; schnedermann93a ).
It remains unclear, whether equilibration is attained. If it occurs, it will be important to isolate the contributions of thermal, pre-equilibrium, and initial state processes to the hadron yield. Since the latter are expected to dominate at large transverse momenta, it is hoped that systematic studies of hadron spectra over a large range in momentum might allow to disentangle these contributions. In the analysis of central reactions of Pb + Pb at 158 GeV it is seen that both predictions of perturbative QCD wa98:pi0:98 ; wang:1998:qcd and hydrodynamical parameterizations wa98:hydro:99 can describe the measured neutral pion spectra reasonably well. It is particularly surprising to observe that, on the one hand, a pQCD calculation gives a reasonable description also at relatively low momenta, while on the other hand, a hydrodynamical parameterization can provide a good description, even at very high momenta.
The understanding of the relative contributions of the various soft and hard processes in particle production is especially important in view of the recent interest in the energy loss of partons in dense matter jetq1 ; jetq2 , generally referred to as jet quenching, as a possible probe for the quark-gluon-plasma. One of the suggested experimental hints of jet quenching is the suppression of particle production at high transverse momenta jetq3 . In order to confirm such an interpretation, it is important to study other possible nuclear modifications of particle production in detail. More information in this respect may be gathered from the variation of the particle spectra for different reaction systems or different centralities. First attempts in this respect have been discussed in wa98:pi0:98 , where the neutral pion average as a function of the centrality was shown to rise from p+p collisions to peripheral Pb+Pb collisions and to saturate for medium central and central Pb+Pb collisions. It was also seen that the neutral pion yield for reactions with more than about 30 participating nucleons exhibits a scaling as with a power which is approximately independent of .
In the present paper we will present a detailed study of neutral pion transverse mass spectra in the range and for collisions of Pb+Pb and Pb+Nb at 158 GeV for different centralities.
2 Experiment
The CERN experiment WA98 misc:wa98:proposal:91 is a general-purpose apparatus which consists of large acceptance photon and hadron spectrometers together with several other large acceptance devices which allow to measure various global variables on an event-by-event basis. The experiment took data with the 158 GeV 208Pb beams from the SPS in 1994, 1995, and 1996. The data presented here were taken during the 1995 and 1996 beamtimes at the CERN SPS. The layout of the WA98 experiment as it existed during the final WA98 run period in 1996 is shown in Fig. 1.
Neutral pions are reconstructed on a statistical basis from their two-photon decay, using photons measured with the LEDA spectrometer in the pseudorapidity interval . This detector is located 21.5 m from the target and consists of 10,080 modules. Each module is a cm3 (14.3 radiation lengths) TF1 lead-glass block read out by an FEU-84 photomultiplier. The high voltage is generated on-base with custom developed ref:ne95 Cockcroft-Walton voltage-multiplier type bases which are individually controlled by a VME processor. The photomultiplier signals are digitized with a custom-built ADC system ref:wi94 . Twenty-four lead-glass modules are epoxied together in an array 6 modules wide by 4 modules high to form a super-module. Each super-module has its own calibration and gain monitoring system based on a set of 3 LEDs and a PIN-photodiode mounted inside a sealed reflecting front cover dome ref:pe96 . The photon spectrometer is separated into two nearly symmetric halves above and below the beam plane in the two regions of reduced charged-particle density which result from the sweeping action of the GOLIATH magnet. More details about the experimental setup and the photon spectrometer can be found in wa98:photons .
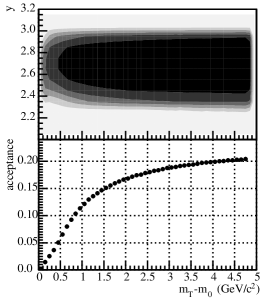
The acceptance of the photon spectrometer for detection in rapidity and transverse mass is shown in Fig. 2. The acceptance covers the region , near mid-rapidity ().
The minimum bias trigger requires a valid signal of the beam counters and a minimum amount of transverse energy GeV, detected by the Mid-Rapidity Calorimeter, MIRAC mirac , which is located 24 m downstream of the target. MIRAC consists of a hadronic and an electromagnetic section and covers the pseudorapidity interval . Data have been taken with the 158 GeV lead beam on targets of Pb (495 and 239 mg/cm2) and Nb (218 mg/cm2). For the present analysis million Pb+Pb and million Pb+Nb minimum bias events were accumulated. The minimum bias cross sections have been calculated from the number of beam triggers and minimum bias triggers and the target thicknesses. The yields have been corrected for small non-target background contributions (typically a few percent) to obtain mb and 4400 mb for Pb + Pb and Pb + Nb reactions, respectively. These absolute cross sections are estimated to have an overall systematic error of less than 10%.
3 Pion Reconstruction and Efficiency
The method for pion reconstruction is similar to that used by the WA80 collaboration as discussed in wa80:pi0:98 . It is also discussed at length in wa98:photons ; phd:blume so we will only briefly sketch the basics of the method.
The showers used for the extraction of the neutral pion yield via the decay branch can be selected with different criteria. It has been demonstrated that the extracted yield does not depend significantly on the choice of these photon identification cuts wa98:photons . For the present analysis, showers with a small lateral dispersion berger92 have been selected as photon candidates.
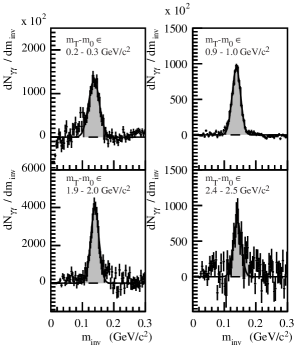
Hits in LEDA are combined pairwise to provide distributions of pair mass vs. (where is the transverse mass and is the rest mass) for all possible combinations. These distributions are obtained both for real events, , and for so-called mixed events, , where a hit from one event is combined with a hit from another event with similar multiplicity. provides a good description of the combinatorial background and is subtracted from to obtain the mass distribution of neutral pions (see Fig. 3).
The large multiplicities, especially in central reactions of Pb + Pb, lead to a considerable probability that showers in the detector overlap and influence each other. Particles may be lost for reconstruction. In other cases the particle might be measured with an incorrect energy. These effects lead to a detector efficiency for pion reconstruction which depends on particle density. To study this detection efficiency, the GEANT geant simulation package has been used to create artificial signals for the lead glass modules corresponding to neutral pions incident on the detector. The effects of detector noise and the digitization of the photomultiplier signals are also implemented. To obtain the reconstruction efficiency, these simulated photon shower pairs have been superimposed onto the measured events. The simulation provides the means to extract the probability that a pion at a given input transverse mass will be measured with . These probabilities, extracted as a function of , can be understood as a matrix which transforms the real physical distributions into the measured ones. These correction matrices are used to correct the measured distributions. A detailed description of the efficiency correction can be found in wa98:photons .
The distributions have then been corrected for contributions from reactions of Pb projectiles with material other than the target (e.g. residual gas, exit windows, etc.). The corresponding corrections were obtained by measurements performed without target. The corrections are negligible for medium-central and central reactions.
The systematic errors on the measured transverse mass spectra are dominated by the following contributions:
-
•
An uncertainty in the absolute calibration of the momentum scale of 1%. This may be translated into an uncertainty in the yields of a few % at low rising to at , which is independent of centrality or reaction system.
-
•
Uncertainties in the extraction which include the error in the determination of the invariant mass peak content and the propagation of the energy resolution through the acceptance and efficiency corrections. This is largest in central collisions. It leads to an error below 10% for for most samples.
-
•
Uncertainties in the correction for contributions from no-target reactions, which are only relevant for peripheral reactions. This leads to an error below 10% for .
The total centrality dependent systematic error is below 10% for for most centrality classes and below 20% for the most central sample.

4 Results
4.1 Neutral Pion Spectra
Neutral pion spectra for Pb + Pb and Pb + Nb collisions for minimum bias and selected centralities are presented in Fig. 4. On the left hand side results for Pb + Pb minimum bias as well as for the 12.7% most central and the 17% most peripheral event selections are shown. Included also are results of exponential fits:
| (1) |
fitted over the range . As noted previously wa80:pi0:98 ; wa98:pi0:98 , the data clearly deviate from the exponential shape when considered over the full range of transverse masses. The fit in the limited transverse mass range can, however, still be used to extract slope parameters . For the 12.7% most central collisions one finds which is significantly larger than the value of for peripheral collisions. Spectra for reactions of Pb + Nb (minimum bias and 10% central) are shown on the right hand side. The spectral shapes are very similar to those for Pb + Pb collisions. For central collisions a slope parameter of is extracted which is intermediate compared to that of peripheral and central Pb + Pb collisions. Since the statistics for the Pb + Nb dataset is limited, we will concentrate on the Pb + Pb reactions in the rest of the paper.
In Fig. 6 the multiplicity distribution for central collisions is compared to predictions of the event generators FRITIOF 7.03 ANDERSSON93 , VENUS 4.12 WERNER93a , and HIJING 1.36 wang:hijing . Clearly FRITIOF does not describe the data at all, while VENUS and HIJING yield a more reasonable description. The prediction of the pQCD calculation from wang:1998:qcd is included as a solid line, which also shows a reasonable agreement with the data. The degree of agreement of the models can be better seen in Fig. 6 where the ratio of the experimental data to the generator results is shown. FRITIOF is not included as the discrepancies are already evident from Fig. 6. VENUS overpredicts the pion production at high by about a factor of two. HIJING shows the best agreement at large momenta but underpredicts the data slightly at intermediate . Also the Monte Carlo models lead to a stronger concave curvature than the data. The pQCD calculation overpredicts the data by in the range .


The momentum spectra for central collisions have been published already in wa98:pi0:98 . As discussed in the corresponding erratum, cross section estimates had turned out to be incorrect. In the course of the present analysis it was realized that for the presentation of the results in figure 1 of Ref. wa98:pi0:98 , the multiplicities were incorrectly normalized. All other results and conclusions of Ref. wa98:pi0:98 are unchanged. Unfortunately, the same improperly normalized distributions were analyzed in Ref. wang:1998:qcd . The correct normalization reduces the mulitiplicities by with the result that the pQCD calculations presented there would overpredict the measured WA98 result, as shown in Fig. 6. Still different parameters for the -broadening in these calculations might possibly enable the model to describe the central distributions better. More stringent tests of such a model can be performed when looking at the detailed centrality dependence of the pion production which has been done in the following.
The minimum bias sample has been subdivided into eight centrality samples summarized in Table 1. Measurements were performed with and without magnetic field, which does not affect the neutral pion distributions, but alters the transverse energy used to determine the centrality. The corresponding cuts have been adjusted so that always the same fractions of the minimum bias cross section were selected. The data samples with and without magnetic field agree well with each other and have been combined in the present analysis. Table 1 shows the transverse energy cuts for one particular data set as an example.
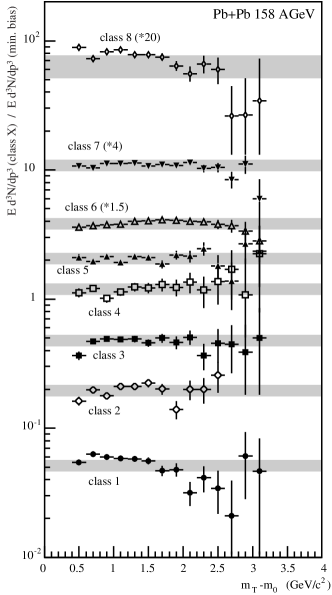
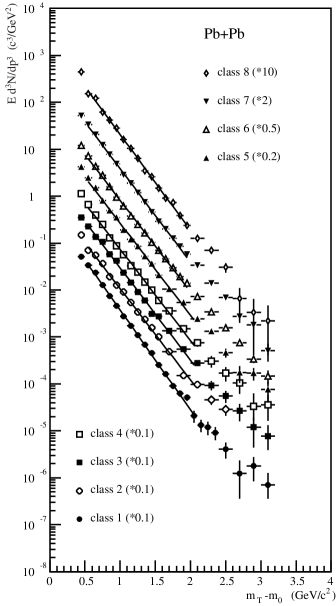
All the transverse mass distributions for Pb + Pb collisions for the different centrality classes as a function of have a very similar shape (see Fig. 7). The distributions are compared more closely in Fig. 8 where the spectra for given centrality classes are divided by the minimum bias spectrum. Still in these ratios no drastic variations are seen when displayed in logarithmic scale. The spectral shapes, especially for the intermediate centrality classes, are very similar. The spectra are broadened when going from peripheral reactions to semi-peripheral reactions, consistent with the nuclear enhancement seen in p + A cronin and in S + Au collisions wa80:pi0:98 . However, the enhancement does not continue to grow for central collisions. Instead there is an indication of a stronger fall off in the most central class.
This observation is surprising, because both initial state (parton multiple scattering) and final state (hadron rescattering) mechanisms are expected to yield a further broadening of the spectra with decreasing impact parameter, i.e. increasing thickness or volume.
The change in the spectrum for the most stringent centrality selection of of the minimum bias cross section appears to be relatively strong, and the question arises whether this cut is really significant enough and whether this sample should not behave similarly to the adjacent sample. We have therefore performed detailed investigations of possible backgrounds and biases with respect to this particular sample. Pile-up of multiple beam interactions is effectively suppressed by strong time and amplitude cuts on the trigger level. In addition, the total calorimeter coverage of MIRAC and the ZDC is sufficient to reject all possible pile-up events, as the measured energy would exceed the beam energy.
Also, simulations of the centrality selections including realtistic fluctuations in the detectors show that e.g. classes 7 and 8 are significantly different. This can e.g. be expressed by the mean (rms) of the distribution of the number of participating nucleons which are 346 (20) and 380 (10), respectively.
As the centrality selection is performed with the transverse energy measured slightly off midrapidity, one might suspect that midrapidity particle production could suffer a different bias, if e.g. the pseudorapidity distribution would change significantly over the small range relevant here. This is, however, not observed. The charged particle pseudorapidity density at increases in a fashion identical to the transverse energy as can be seen in Ref. wa98:scaling .
While this leads us to expect no additional bias from the event selection, the direct comparison of the spectra obtained with different analysis cuts for the most central sample (class 8) shows slightly larger variations than the other samples. We have therefore assigned a larger systematic error of to this sample, as was discussed in Section 3.
class (GeV) 1 24.35 17.2 % 2 24.35 55.45 15.8 % 3 55.45 114.85 18.2 % 4 114.85 237.35 23.5 % 5 237.35 326.05 12.3 % 6 326.05 380.35 6.2 % 7 380.35 443.20 5.8 % 8 443.20 1.0 % 6 - 8 326.05 12.7 %
4.2 Average and Inverse Slopes
Another means to characterize the spectral shape is via the average transverse momentum , or via the inverse slopes of the spectra. The truncated average transverse momentum has already been presented in wa98:pi0:98 , where it was shown that the values of , with a lower cutoff of , increase from peripheral to medium central collisions but seem to saturate for still smaller impact parameters. Since the is dominated by the momentum region near the cutoff, this is not in contradiction with the dependence observed in Fig. 8. A similar analysis has been performed with inverse slope parameters which were obtained by fitting exponentials (Eq. 1) to the spectra in limited regions of transverse mass. The extracted slope parameters as a function of the number of participants are shown in Fig. 9. Fits in the lowest interval yield a slope of for peripheral reactions. In the intermediate centrality range the slope appears to be constant at .

Inverse slopes have also been extracted for other intervals of transverse mass (see Fig. 9). For all centralities the slopes increase with larger transverse mass, which is another demonstration of the curvature of the spectra. The centrality dependence is more pronounced for the higher regions ( GeV/ and GeV/). There is a continuous rise in the inverse slope from very peripheral reactions up to reactions with , the highest slopes reaching and , respectively. There is an indication of a decrease in the slope for very central collisions which is however not conclusive in view of the systematic errors.
From this analysis of the spectral shapes by looking at spectral ratios or inverse slopes one may conclude, that apart from the broadening in going from peripheral to semi-peripheral collisions, no striking features are observed. Apparently these analysis tools are not suited to extract information on possible more subtle variations.
4.3 Scaling with System Size
In addition to variations of the shape of the momentum spectra it is of interest to study the variations in absolute multiplicities. Especially at high transverse momentum one naïvely expects an increase of the cross section proportional to the mass number of the nuclei and, correspondingly, an increase of the multiplicity proportional to the number of binary collisions due to the importance of hard scattering. In fact, it was already observed in pA collisions at beam energies of cronin that the increase in cross section at high transverse momenta is even stronger than the increase in the target mass.
This behaviour can be investigated by parameterizing the data according to the phenomenological expression:
| (2) |
where and are the mass numbers of the projectile and target nuclei. For this purpose the experimental data have been compared to a parameterization phd:blume of pp reactions don76 ; bus76 ; ang78 ; kou80 ; dem87 ; ada96 ; alp75 ; bre95 scaled to the same :
| (3) |
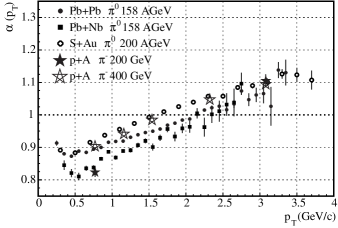
with , and . We have assigned a systematic error of to this reference distribution. The values of the exponents for minimum bias reactions of Pb+Pb and Pb+Nb are shown in figure 10. Included for comparison are results for S+Au collisions at 200GeV wa80:pi0:98 and the proton induced data from cronin . All data follow the same trend, i.e. the exponent is considerably lower than one for low transverse momenta and increases monotonically with finally reaching values for high . However, the values differ by about for the different systems and the point where they cross the line ranges from to . It should be noted that the different experimental trigger biases may influence these results.
This form of scaling analysis is only applicable to minimum bias reactions. To study the scaling behaviour for heavy ion reactions of different centralities the scaling with the number of participants or nucleon-nucleon collisions is more appropriate. An analysis of the scaling of the charged multiplicity with the number of participants has been performed in na57:scaling . A more general analysis of the scaling behaviour of transverse energy and particle production in Pb + Pb collisions has been presented in wa98:scaling and the scaling of neutral pion production with the number of participants in wa98:pi0:98 . For the present paper the number of participants and collisions have been obtained as described in wa98:scaling . The values are given in Table 1. The systematic errors of these quantities have been obtained by comparing calculations with different assumptions. In addition to VENUS and FRITIOF calculations with default parameter settings, we have investigated VENUS calculations with a modified nuclear density distribution, with a significantly worsened energy resolution of the calorimeter, with different assumptions on the size of the minimum bias cross section and ignoring the target-out contribution. These calculations are described in wa98:scaling . Moreover we have also investigated independently results of a toy model calculation of nuclear geometry and also the influence of modest variations of the nucleon-nucleon cross section entering into the calculations. The maximum deviation of any of these other calculations from the default one is within the error given in Table 1. As expected, the relative error is largest in the most peripheral sample. This is due to the uncertainty in modelling the -fluctuations and the trigger threshold —effects which have been included in our error estimate.
It should be noted that the most peripheral data set in this analysis does not correspond to the most peripheral collisions theoretically possible from nuclear geometry, as they are rejected by the minimum bias trigger. Our minimum bias trigger cross section of mb corresponds to of the expected total geometrical cross section. The more peripheral reactions rejected by our trigger would of course have a still larger uncertainty due to e.g. the uncertainties in the nuclear density distribution. In our samples the error is still at a reasonable level as quoted in the table.
Furthermore, the error in ratios of e.g. the number of collisions for different samples is considerably smaller, since some of the systematic effects are correlated, as is obvious e.g. for the size of the nucleon-nucleon cross section.
The scaling of the neutral pion production is analyzed both as a function of the number of collisions and as function of the number of participants. As in the earlier publications the yield is parameterized as:
| (4) |
or
| (5) |
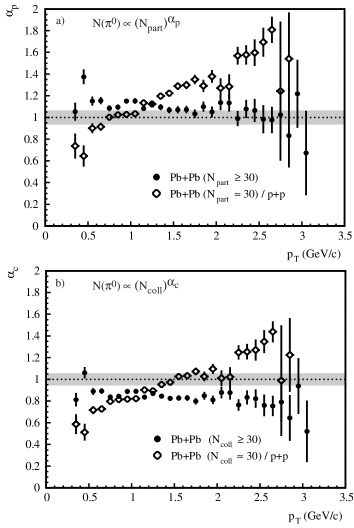
The results are presented in Fig. 11 where the upper panel shows the scaling with the number of participants and the lower panel with the number of collisions. The open circles represent the exponents calculated from the ratio of semi-peripheral collisions (class 2) to the parameterization of pp collisions (Eq. 3). In this case a behaviour very similar to the original Cronin-effect is observed: The exponents increase monotonically with increasing reaching values for large . A scaling of the particle yields with is equivalent to a scaling of the minimum bias cross sections with . This value is reached in Fig. 11b at , similar to where the scaling exponents of the p+A and S+Au data in Fig. 10 reach the value of 1. However, the minimum bias Pb+Pb data in Fig. 10 show a weaker scaling exponent at intermediate and higher .
Fits to the centrality classes 2-8 (displayed as filled circles in Fig. 11), i.e. up to the most central collisions, show almost constant exponents for all transverse momenta. In fact, the values even indicate a slight decrease with increasing . At the highest the exponents appear to be and . They are considerably below the scaling exponents for semi-peripheral Pb+Pb relative to p+p. Noticeably the scaling exponent is also significantly below the value of 1 expected as a naïve scaling for hard scatterings.
Ratios of the measured pion multiplicity distributions for two different samples (labeled X and Y) normalized to the number of collisions given in Table 1:
| (6) |
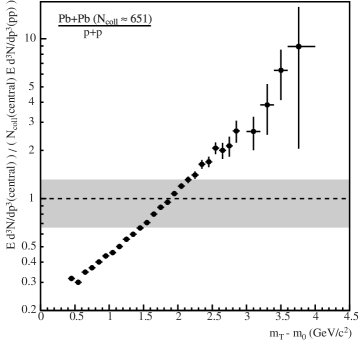
are shown in Figs. 12, 13 and 14. In Fig. 12 the ratio of the most central collisions to the parameterization of p+p is shown:
| (7) |
This special case of equation 6 is sometimes referred to as the nuclear modification factor wang:pqcd2 . The ratio is at low and increases exponentially towards higher approaching values close to 10. 111The same ratio for central Pb+Pb(Au) collisions is shown in wang:pqcd2 . There a curve is drawn which saturates at for high . It is actually dominated by data points at , and the WA98 data points can be seen to lie above the curve at high . Remaining differences in the two figures might be due to different estimates for the pp-spectra being used in the ratios. This is in line with the earlier observations and demonstrates again that relative to p+p reactions there is a strong Cronin effect in heavy ion collisions for all centralities. However, as evident from Fig. 11b, most of the anomalous enhancement is already present in peripheral reactions, and the additional enhanement in central reactions is much weaker. In the following we will concentrate on this particular observation.
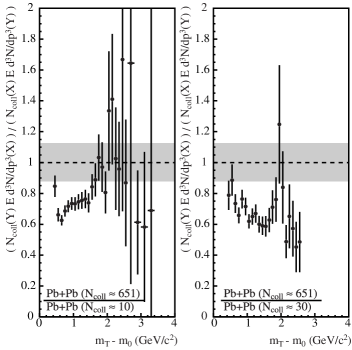
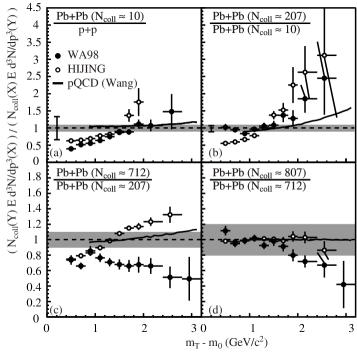
Fig. 13 shows ratios of the most central collisions to the two most peripheral samples. Both ratios are below 1 for low . In comparison to the most peripheral sample (left part) the spectra are compatible with a scaling with the number of collisions in central reactions at higher , while relative to the semi-peripheral class (right part) the enhancement is significantly weaker even at high . Similar ratios for more detailed centrality selections are shown in Fig. 14. The ratio of peripheral Pb+Pb collisions to p+p (Eq. 3) (Fig. 14a) increases strongly with increasing transverse mass – this is in line with the Cronin effect discussed above. A similar trend is observed when going from peripheral to medium-central data (Fig. 14b). In addition, the pion production is seen to increase roughly proportional to the number of collisions even at low transverse masses. Going from medium central to central (Fig. 14c) the trend is reversed: the ratio decreases with increasing transverse mass as was already seen in Fig. 8 and the pion multiplicities increase more weakly than the number of collisions. The ratio of very central to central collisions shows an indication of a similar effect although not very significant.
Included in Fig. 14 are results of HIJING calculations (open circles) for the same centralities. They show a very different trend: For all but the most central case the ratios increase with increasing transverse mass, for high transverse masses the ratio is always larger than one. HIJING does not describe p+p data well at these energies while a reasonable description of central Pb+Pb collisions is obtained by an implementation of the Cronin effect via a soft transverse momentum kick model which introduces a very strong dependence, as was pointed out already in gyulassy98 . Thus the reasonable description of central Pb+Pb collisions by HIJING appears to be fortuitous. The authors of gyulassy98 stated that a better implementation of the Cronin effect should use an additional intrinsic of the incoming partons and a likely weaker broadening. Still, in any model of the Cronin effect one would expect the ratios of central to less central spectra, as shown in Fig. 14c, to be larger than one at high transverse mass. Similarly, one would expect the scaling exponent shown in Fig. 11 to be at high transverse momentum. A more refined calculation including intrinsic was performed in wang:pqcd2 using the same model as in wang:1998:qcd . The results are also shown in Fig. 14 as solid lines. As expected, the ratios show a weaker increase at high compared to HIJING, but are all and thus do not explain the centrality dependence as seen in Fig. 14c.
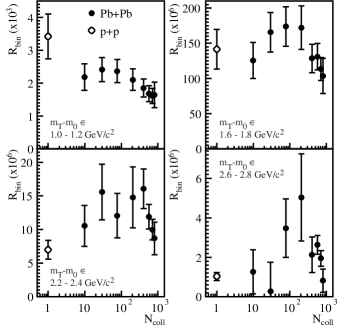
With these observations in mind one can revisit the evolution of the particle yields with system size at given transverse mass. This is done in Fig. 15 where the neutral pion yield per binary collision:
| (8) |
is shown as a function of the number of collisions for four different transverse mass intervals. In addition to Pb+Pb reactions also the parameterization of p+p is included. At relatively low transverse mass the yield per collision decreases as expected from the scaling exponent . With increasing transverse mass a rise of develops which is most prominent for the highest . However, it is also clear that decreases significantly with for . The exact point of turnover of the evolution of the pion yields could not be so easily observed in the investigation of the scaling exponents above – it is much more clearly born out when normalizing to the number of binary collisions as in .
5 Summary
We have presented transverse mass spectra of neutral pions in Pb+Pb reactions at 158 GeV for different centralities. A comparison to several event generators found none of them able to adequately describe the spectra.
While there is a strong broadening of the transverse mass spectra in going from p+p to peripheral Pb+Pb reactions, and further to semi-peripheral reactions, there is an indication of a stronger fall off of the spectra when going to the most central selections. The absolute yields at high transverse momenta show an enhancement which grows stronger than with the number of collisions up to medium central Pb+Pb collisions, which is qualitatively similar to the Cronin effect observed in p+A collisions. For central collisions, however, the further increase in multiplicity at high is weaker than with the number of collisions. This is in qualitative contradiction to conventional explanations of the Cronin effect (-broadening) which is expected to cause a further strengthening of the nuclear enhancement with more central collisions. As a possible explanation of this behaviour one may consider that the multiple scattering mechanisms which are expected to be responsible for the apparent -broadening in pA and peripheral Pb+Pb might be modified in central Pb+Pb collisions. This might be possible if both initial and final state scatterings are relevant for the enhancement, and the relative contributions are shifted more towards final state contributions in central collisions, reminiscent of a more and more thermalized system. Alternative explanations might involve suppression mechanisms independent of the nuclear enhancement in question, e.g. an onset of quenching via energy loss of produced particles (partons or hadrons) in central Pb+Pb collisions.
Acknowledgements.
We wish to express our gratitude to the CERN accelerator division for excellent performance of the SPS accelerator complex. We acknowledge with appreciation the effort of all engineers, technicians and support staff who have participated in the construction of the experiment. This work was supported jointly by the German BMBF and DFG, the U.S. DOE, the Swedish NFR and FRN, the Dutch Stichting FOM, the Polish KBN under Contract No 621/E-78/SPUB-M/CERN/P-03/DZ211/, the Grant Agency of the Czech Republic under contract No. 202/95/0217, the Department of Atomic Energy, the Department of Science and Technology, the Council of Scientific and Industrial Research and the University Grants Commission of the Government of India, the Indo-FRG Exchange Program, the PPE division of CERN, the Swiss National Fund, the INTAS under Contract INTAS-97-0158, ORISE, Research-in-Aid for Scientific Research (Specially Promoted Research & International Scientific Research) of the Ministry of Education, Science and Culture, the University of Tsukuba Special Research Projects, and the JSPS Research Fellowships for Young Scientists. ORNL is managed by Lockheed Martin Energy Research Corporation under contract DE-AC05-96OR22464 with the U.S. Department of Energy. The MIT group has been supported by the US Dept. of Energy under the cooperative agreement DE-FC02-94ER40818.References
- (1) Quark Matter ‘96 proceedings, Nucl. Phys. A 610 (1996).
- (2) Quark Matter ‘97 proceedings, Nucl. Phys. A 638 (1997).
- (3) Quark Matter ‘99 proceedings, Nucl. Phys. A 661 (1999).
- (4) NA49 Collaboration, P.G. Jones et al., Nucl. Phys. A 610 (1996) 188c.
- (5) NA44 Collaboration, I.G. Bearden et al., Phys. Rev. Lett. 78 (1997) 2080.
- (6) WA80 Collaboration, R. Albrecht et al., Eur. Phys. J. C 5, 255–267 (1998).
- (7) D. Antreasyan, et al. Phys. Rev. D 19, 764 (1979).
- (8) A. Krzywicki et al., Phys. Lett. B85 (1979) 407–416.
- (9) M. Lev and B. Petersson, Z. Phys. C21 (1983) 155–161.
- (10) K. Werner, Phys. Rep. 232 (1993) 87–299.
- (11) H. Sorge, H. Stöcker, and W. Greiner, Nucl. Phys. A498 (1989) 567c–576c.
- (12) K.S. Lee and U. Heinz, Z. Phys. C43 (1989) 425–429.
- (13) E. Schnedermann et al., Phys. Rev. C48 (1993) 2462–2475.
- (14) M. Gyulassy and M. Plümer, Phys. Lett. B243 (1990) 432; R. Baier et al., Phys. Lett. 345 (1995) 277.
- (15) R. Baier, D. Schiff, and B.G. Zakharov Ann.Rev.Nucl.Part.Sci. 50 (2000) 37-69 and references therein.
- (16) X.-N. Wang and M. Gyulassy, Phys. Rev. Lett. 68 (1992) 1480; X.-N. Wang, Phys. Rev. C 58 (1998) 2321.
- (17) WA98 Collaboration, M.M. Aggarwal et al., Phys. Rev. Lett. 81 (1998) 4087; Phys. Rev. Lett. 84 (2000) 578 (erratum).
- (18) X.-N. Wang, Phys. Rev. Lett. 81 (1998) 2655-2658.
- (19) WA98 Collaboration, M.M. Aggarwal et al., Phys. Rev. Lett 83 (1999) 926.
- (20) WA98 Collaboration, Proposal for a large acceptance hadron and photon spectrometer, 1991, Preprint CERN/SPSLC 91-17, SPSLC/P260.
- (21) T.C. Awes et al., Nucl. Instrum. Methods Phys. Res. Sect. A 279, (1989) 479.
- (22) S. Neumaier et al., Nucl. Instrum. Methods Phys. Res. Sect. A 376, 368 (1996).
- (23) A. L. Wintenberg et al., Proceedings of Electronics for Future Colliders Conference, May 1994, LeCroy Corp.
- (24) T. Peitzmann et al., Nucl. Instrum. Methods Phys. Res. Sect. A 360, 593 (1995).
- (25) WA98 Collaboration, M.M. Aggarwal et al., submitted to Phys. Rev. C, preprint nucl-ex/0006007.
- (26) C. Blume, doctoral thesis, University of Münster, Germany (1998).
- (27) F. Berger et al., Nucl. Instrum. Methods Phys. Res. Sect. A 321 (1992) 152–164.
- (28) R. Brun et al., GEANT3, CERN/DD/cc/84-1.
- (29) B. Andersson, G. Gustafson, and H. Pi, Z. Phys. C 57, 485 (1993).
- (30) X.-N. Wang, and M. Gyulassy, Phys. Rev. D 44 (1991) 3501; Comput. Phys. Commun. 104 (1997) 70.
- (31) WA98 Collaboration, M.M. Aggarwal et al., Eur. Phys. J. C 18 (2001) 651–663.
- (32) G. Donaldson et al., Phys. Rev. Lett. 36 (1976) 1110.
- (33) F.W. Büsser et al., Nucl. Phys. B 106 (1976) 1.
- (34) A.L.S. Angelis et al., Phys. Lett. B 79 (1978) 505.
- (35) C. Kourkoumelis et al., Z. Phys. C 5 (1980) 95.
- (36) C. DeMarzo et al., Phys. Rev. D 36 (1987) 16.
- (37) D.L. Adams et al., Phys. Rev. D 53 (1996) 4747.
- (38) B. Alper et al., Nucl. Phys. B 100 (1975) 237.
- (39) A. Breakstone et al., Z. Phys. C 69 (1995) 55.
- (40) WA97/NA57 Collaborations, F. Antinori et al., Eur. Phys. J. C 18 (2001) 57–63.
- (41) M. Gyulassy, and P. Levai, Phys. Lett. B 442 (1998) 1.
- (42) E. Wang, and X.-N. Wang, Interplay of soft and hard processes and hadron spectra in and collisions, preprint nucl-th/0104031.