Compton Scattering by the Proton 111Supported by the Italian Istituto Nazionale di Fisica Nucleare (INFN) and by Deutsche Forschungsgemeinschaft (SFB 201) and by DFG-contracts Schu222 and 436RUS113/510
G. Gallera, V. Lisinb, R. Kondratievb, A.M. Massonec, S. Wolfa, J. Ahrensd, H.-J. Arendsd, R. Beckd, M. Camena, G.P. Capitanie, P. Grabmayrf, S.J. Hallg, F. Härterd, T. Hehlf, P. Jenneweind, K. Kosserta, A.I. L’vovh, C. Molinaric, P. Ottonelloc, J. Peised, I. Preobrajenskid, S. Proffa, A. Robbianoc, M. Sanzonec, M. Schumachera,111corresponding author: schumacher@physik2.uni-goettingen.de, M. Schmitzd, F. Wissmannc,222present address: Zweites Physikalisches Institut, Universität Göttingen
a Zweites Physikalisches Institut, Universität Göttingen,
D-37073 Göttingen, Germany
b Institute for Nuclear Research, Moscow 117312, Russia
c Dipartimento di Fisica dell’Universita di Genova and
INFN - Sezione di Genova, I-16146 Genova, Italy
d Institut für Kernphysik, Universität Mainz, D-55099 Mainz,
Germany
e INFN - Laboratori Nazionali di Frascati, I-00044 Frascati, Italy
f Physikalisches Institut, Universität Tübingen, D-72076
Tübingen, Germany
g Kelvin Laboratory, Glasgow University, Glasgow, Scotland,
G12 8QQ, UK
h P. N. Lebedev Physical Institute, Moscow 117924, Russia
Abstract
Compton scattering by the proton has been measured over a wide range covering photon energies and photon scattering angles , using the tagged-photon facility at MAMI (Mainz) and the large-acceptance arrangement LARA. The data are in good agreement with the dispersion theory based on the SAID-SM99K parameterization of photo-meson amplitudes. From the subset of data between 280 and 360 MeV the resonance pion-photoproduction amplitudes were evaluated leading to the multipole E2/M1 ratio . From all data below 455 MeV the proton’s backward spin polarizability was determined to be .
PACS number: 25.20.Dc
Compton scattering, proton,
scattering amplitudes, spin polarizabilities
1 Introduction
Compton scattering by the proton in the energy-region has played an important role in recent nucleon-structure investigations carried out at the tagged-photon facilities at Saskatoon (SAL) [1], Brookhaven (LEGS) [2, 3, 4] and Mainz (MAMI) [5, 6, 7, 8]. In addition, data are available for the second resonance region measured in Tokyo [9, 10] and Bonn [11] in the early 1980’s. Though important results have been obtained in these former experiments, the experimental techniques had the disadvantage that only one angle and a relatively small interval of photon energies were available with a given configuration of the experimental set-up. The present work reports about the first experiment where large ranges of and were covered simultaneously through the use of tagged photons and large acceptance arrangements for the scattering angle and the photon energy.
The interpretation of the data obtained in the present experiment is facilitated by a recent progress [12, 13] in the dispersion theory of proton Compton scattering which is used as a precise tool for studying electromagnetic properties of the nucleon. These properties include the electric and magnetic polarizabilities and , the four spin polarizabilities with the backward spin polarizability being a particular linear combination of them, and the strength and the multipole ratio E2/M1 of the transition. These quantities enter into the theoretical Compton differential cross section as (not fully independent) parameters and they are predominantly important in the energy range.
Earlier versions of the dispersion theory of Compton scattering were restricted to the first resonance region and failed at higher energies. An extension of the dispersion theory to the second resonance region was obtained only recently in [12], using more accurate photo-meson amplitudes and applying special measures to suppress divergences of partial-wave series in dispersion integrals at large (see [12] for details). The success of this theory in wide energy and angular ranges is an important prerequisite for its reliable application in the -isobar region.
A more recent version of the dispersion theory [13] improves on the previous work [12] by considering more quantitatively the dynamics of the -channel two-pion exchange. In [12] this process was treated highly phenomenologically by approximating asymptotic contributions by effective-meson exchanges, where the -exchange in case of the invariant amplitude is of prominent importance. However, in its current version the newer theory [13] unfortunately is less sophisticated in its treatment of pion-photoproduction contributions. This makes the predictions of [13] unstable in the region MeV which contains 3/4 of the experimental data obtained in the present experiment. For that reason we rely in our analysis entirely on the theoretical framework of [12] and include uncertainties in the parameters of the asymptotic contributions into model errors of the extracted physical quantities.
In comparison with the original version described in [12], we use a slightly updated code taking into account preliminary results of the Mainz GDH experiment [14] for a more accurate calculation of double-pion photoproduction contributions to the dispersion integrals, and taking into account the , channel exchanges with couplings borrowed from [15].
2 Experiment
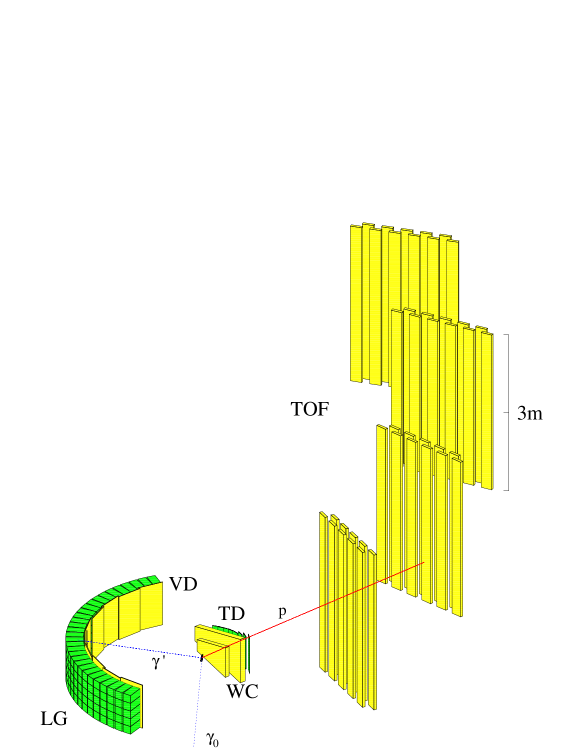
The present paper contains the results of an experiment carried out using the LARge Acceptance Arrangement (LARA) shown in Fig. 1. This arrangement had been designed to cover the whole angular range of photon scattering-angles from to in the laboratory and the interval of photon energies from to . The principle of the present method is to make use of the energy of the incident photon, of the direction of the scattered photon and of the direction and energy of the recoil proton to separate Compton scattering events from background being mainly due to the () reaction.
The experiment makes use of the Glasgow tagged photon facility [16] installed at the three-stage microtron MAMI in Mainz [17]. The energy resolution achieved by the tagger was on the average. The scattering target consists of lq. contained in a Kapton cylinder of length and diameter.
On the photon arm 150 lead glass photon detectors (LG) were used having dimensions of positioned cylindrically around the scattering target with the front faces having distances of from the target center. This leads to an angular resolution on the photon arm of both in the horizontal and the vertical direction. Each block containing 3 (horizontal) 5 (vertical) detectors is equipped with a plastic scintillator (VD) of thickness to identify charged background.
On the proton arm the proton angle with respect to the incident photon beam is determined by two wire chambers (WC) at distances of and from the target center. Each of these wire chambers consists of two layers of wires tilted against the vertical direction by and , respectively. The distance between wires in the layers is 2.5 mm. The resolution achieved for the proton angle is better than in the horizontal (geometrical ) and vertical (geometrical ) directions. The proton energy is determined via time-of-flight, measured through coincidences between signals from the tagger and signals from 43 bars of plastic scintillators (TOF) [18]. The latter are arranged in 4 planes positioned at distances of 2.6, 5.7, 9.4 and from the target center. The experiment trigger was defined through a coincidence between a signal from a lead glass block and a signal from one out of 8 trigger detectors (TD) positioned behind the wire chambers, with the geometry fulfilling the angular constraints of a Compton event.
3 Data analysis
Protons were identified through their comparatively large energy-deposit in a TD detector and through their time-of-flight. For each proton event detected by a TOF detector a trajectory was constructed using the intersection points in the two wire chambers. The event was accepted as a good one if the trajectory intersected the scattering target, hit the appropriate TD detector and intersected the TOF detector at the experimental impact point within its spacial resolution. Then, for a given proton trajectory and a given incident photon energy the direction of the scattered photon as well as the energy of the recoil proton were calculated assuming Compton kinematics. Only those events were accepted where the experimental direction of the secondary photon was in agreement with the direction calculated for a Compton photon within the spacial resolution of the apparatus. This procedure led to a drastic reduction of the number of background events from photoproduction.
In addition to the separation procedures discussed above a further very effective separation of events from Compton scattering and photoproduction was achieved by time-of-flight analysis. The experimental time-of-flight was compared with the one calculated from the energy expected for a recoil proton of a Compton event. Mean energy losses of the proton were used in this calculation. The difference between the experimental and the calculated time-of-flight was named the missing time .
The analysis of the experimental data was accompanied by a Monte Carlo simulation to determine the detector efficiencies. All calibrations needed as inputs for a precise simulation, including the efficiencies of the wire chambers, were found in a calibration procedure making use of the large amount of (,) events provided by the experiment.
Fig. 2 shows a typical missing time spectrum for primary photon energies of = 345 MeV. At this low energy there is a complete separation of the two types of events whereas at higher energies in the first resonance region there is some overlap which can be removed by subtracting the tail of the (,) events underneath the Compton peak.
In the second resonance region it was necessary to make use of -background subtraction. The procedure is described in Fig. 3 for a photon energy of Eγ = 780 MeV. Subfigure A shows Compton plus background events, measured under conditions where the trajectories of the incident photon, the recoil proton and the scattered photon were located in one plane within the spacial resolutions of the detectors. The variables and E are the cosine of the measured proton angle and the measured proton energy, respectively, on a scale where these quantities are equal to zero for a Compton event. Subfigure B shows background events to be subtracted from the data of subfigure A. They are measured out-of-plane but otherwise under comparable conditions. Any kinematical differences between the background events in A and B are eliminated, by adjusting the data of B to the kinematical conditions of A along the predictions of a Monte Carlo simulation. It the apparent that the vertical projection C as well as the horizontal projection E of the data contained in the rectangular boxes of subfigures A and B lead to net Compton events of good precision, as shown in the subfigures D and F, respectively.
4 Results and Discussion
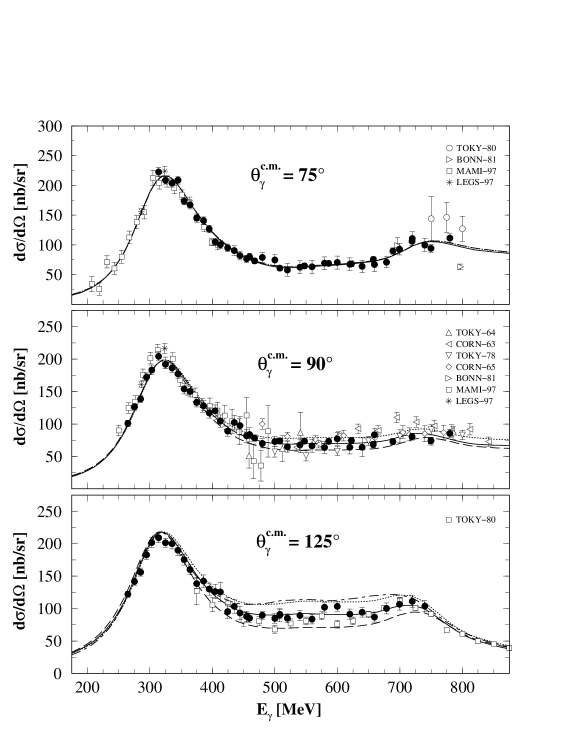
Fig. 4 shows differential cross sections of the present experiment for three scattering angles and energies in the first and second resonance regions in comparison with data from earlier experiments. Three theoretical curves were calculated using the SAID-SM99K parameterization of the photo-meson amplitudes [28] and three different mass parameters of the effective- exchange. They demonstrate the sensitivity to and show that the choice made in [12], i.e. MeV, works reasonably well.
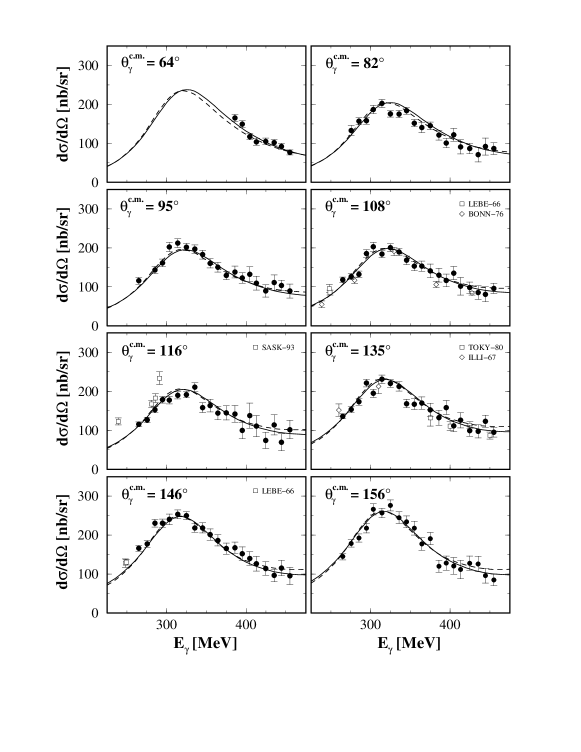
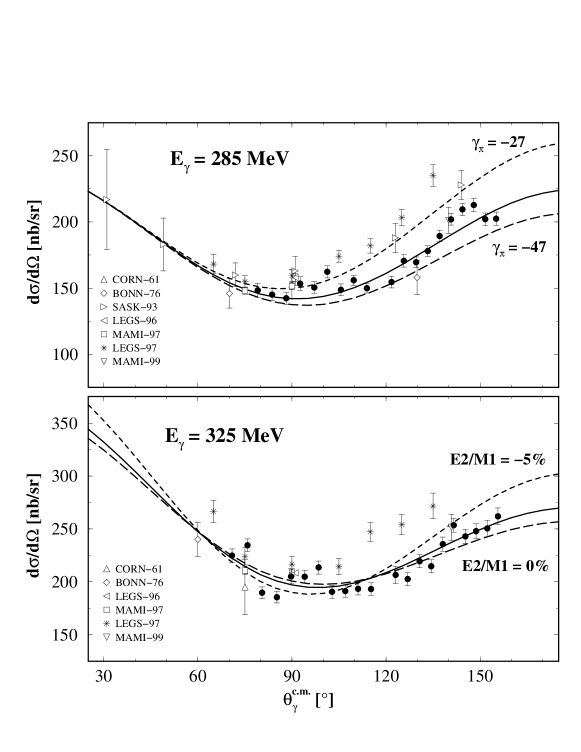
Fig. 5 and 6 show further examples of differential cross sections obtained for the first resonance region. The errors shown contain all contributions which are individual (random) for each data point and have been carefully determined during the evaluation procedure. These are the errors due to the counting statistics and the systematic errors due to the detection efficiency, the geometrical uncertainty of the apparatus and the background subtraction procedure. There are additional common (scale) systematic errors due to the tagging efficiency () and target density and thickness (). The two photon energies selected in Fig. 6 are chosen such that the sensitivity of the quantities and E2/M1 to the differential cross sections is clearly demonstrated, whereas for the analysis described below a wider sample of our data has been taken into account. Keeping this in mind, the fluctuations of some of the data shown in Fig. 6 are not indicative of a lack of precision of the results. Fig. 5 clearly proves that rather precise information on the properties of transition may be obtained from the total amount of data obtained in the first resonance region.
In order to determine the multipoles characterizing the -resonance and to extract we use the following procedure. We start with the fixed mass parameter MeV and the difference of the electric and magnetic polarizabilities of the proton, , as determined from low-energy Compton scattering experiments [29]. Taking a subset of 167 data points close to the -resonance peak, namely those between the limits and 360 MeV where the -resonance contribution strongly dominates, we slightly rescale the -resonance parts of the photo-pion amplitudes and , as described in [7], in order to achieve the best agreement between the present experimental data and dispersion-theory predictions. The above choice of the energy limits is made in order to reduce otherwise bigger model errors in the determination of the resonance parameters. With these corrected amplitudes, setting an overall scale for the theoretical differential cross sections of Compton scattering close to the resonance, we tune through the asymptotic contribution to the invariant amplitude (cf. [4]) in order to arrive at the best in the whole energy region covering the -resonance, which here is the region MeV containing 467 data points. With this we repeat the determination of the amplitudes and and then arrive again at , etc. These iterations quickly converge and eventually give the final values for , and .
In order to determine the model uncertainties of the extracted quantities we used different values for within the experimental uncertainty of this quantity (i.e. between 8.5 and [29, 30]). Also different values for were used between 500 to 700 MeV. This range of is supported by a comparison of different theoretical calculations of the amplitude [12, 13, 31, 32]. Moreover, we varied the coupling by 4% and the and couplings by 50%. The form factors accompanying the , , t-channel contributions were varied and also the parameters which determine the multipole structure of double-pion photoproduction below 800 MeV where the latter variation was based on experience of a recent GDH experiment [14].
We present our findings in terms of the absolute value of the amplitude at the energy 320.0 MeV corresponding to the maximum of the differential cross section for Compton scattering. The E2/M1 ratio (EMR) of the imaginary parts of the amplitudes and is determined for 340.0 MeV where the real parts of these amplitudes are about zero, in complete agreement with the previous procedure [3, 33, 34] where the ratio of the imaginary parts was determined from pion photoproduction experiments. It is important to exactly use the same energy when comparing the amplitudes and obtained from different experiments because they rapidly vary with . Our results are
| (1) |
The systematic errors given here include changes imposed by a simultaneous shift of all data points within the scale uncertainty of 3%. This uncertainty fully dominates the resulting uncertainty of the amplitude. Note that the required modifications of the amplitudes and are compatible with zero. Without the modification, the SAID-SM99K parameterization gives (in the same units) and EMR. The present value for perfectly agrees with the one previously determined by Hünger et al. [7]: . The value of EMR determined from the present Compton scattering data is smaller than the one obtained in a dedicated Mainz photo-pion experiment, i.e. [33, 34], and also smaller than the result published by the LEGS group [3], i.e. .
The uncertainties of the spin polarizability are dominated by the model errors, especially by the variations of and . Our result for is in disagreement with the one determined in 1997 by the LEGS group [4] which gave the smaller value (in the same units of ). This difference can be traced back to a difference in the measured differential cross sections, as can be seen in Fig. 6.
The present value of agrees well with predictions of the unsubtracted dispersion relation for the invariant amplitude adopted in [12]. The latter gives with the same photo-meson input and with the same energy cut in the dispersion integrals of GeV, thus assuming no essential asymptotic contributions beyond pseudoscalar-meson exchanges (). The present value for satisfactorily agrees with predictions of the “small scale expansion” scheme, which effectively is chiral perturbation theory including the -resonance, [35]. It also agrees with standard chiral perturbation theory to order , which does not include the -resonance, [36], provided is used for the anomaly contribution to from exchange333We do not use another ChPT prediction, [37] for reasons explained in [38].. Furthermore, it agrees with backward-angle dispersion relations, which include the and the - exchanges, [15]. Thus, there is good overall consistency between the present Compton scattering data, the dispersion theory, and the SAID-SM99K photo-meson amplitudes.
Such a consistency is deteriorated when the latest SAID-SM00K photo-pion amplitudes are used. This is because in that latest parameterization the -strength of the -resonance is decreased to . Therefore, we have to increase the SM00K -amplitude by in order to achieve a satisfactory description of Compton scattering. When such a rearrangement is made, the value extracted for is , i.e. it turns out to be only slightly smaller than the one of Eq.(1) with similar errors.
When using the MAID2K [39] parameterization of photo-pion amplitudes the same procedure gives the results
| (2) |
which are more at variance with Eq. (1) than the alternatives discussed above. In this case a slightly bigger rearrangement of the resonance amplitudes is required in comparison with their original values which, for MAID2K, are and EMR. The biggest change is, however, in the spin polarizability which can be traced back to rather different nonresonant amplitudes and in the SAID and MAID representations in the -resonance range. The overall quality of the description of the present Compton scattering data at energies below 455 MeV, containing 467 data points in total, is approximately the same for the SAID and MAID photo-meson input. The fitting procedure based on the two sets of parameterizations leads to and 565, respectively, and the differences in the predictions are small as can be seen in Fig. 5.
However, the properties of the SAID and MAID parameterizations are quite different in the second resonance region. For instance, is obtained for 190 data points between 450 and 600 MeV for SAID-based theoretical predictions with SAID-based parameters (1), whereas is obtained for the same 190 data points with MAID-based theoretical predictions and MAID-based parameters (2). This means that the MAID-based parameterization does not lead to a reasonable fit to the data when the same parameter MeV is used. The biggest difference between these two versions is seen at backward angles in the dip region between the first and second nucleon resonance, as illustrated by the dashed-dotted curve in Fig. 4. The use of a smaller with the same reduces the discrepancy in the dip region, however without leading to an overall agreement. It is observed that the fit to the data below 455 MeV carried out with that smaller requires an even bigger compared to the one given in (2), and with this bigger again no agreement is achieved between the theory and the data in the dip region.
5 Conclusions
The results of the present experiment may be summarized as follows. For the first time Compton scattering by the proton has been measured with a large acceptance set-up for the scattering angle and the photon energy. The data confirm the magnitude of the -strength adopted in the SAID-SM99K and MAID2K parameterizations (not in SAID-SM00K), and are in agreement with the E2/M1 ratio given by these parameterizations. The backward spin polarizability is found to be in agreement with latest theoretical calculations, although model errors should yet be better understood.
Acknowledgment
The authors are greatly indebted to Professor Turleiv Buran, Department of Physics, University of Oslo and to the Norwegian Research Council for Science and the Humanities for having given them the opportunity to use their 120 lead glass detectors for this experiment, containing 150 lead glass detectors in total. They wish to acknowledge the excellent support of the accelerator group of MAMI, as well as many other scientists and technicians of the Institut für Kernphysik at the University of Mainz.
References
- [1] E.L. Hallin et al. Phys. Rev. C 48 (1993) 1497
- [2] G. Blanpied et al., Phys. Rev. Lett. 76 (1996) 1023
- [3] G. Blanpied et al., Phys. Rev. Lett. 79 (1997) 4337
- [4] J. Tonnison et al., Phys. Rev. Lett. 80 (1998) 4382
- [5] C. Molinari et al., Phys. Lett. B 371 (1996) 181
- [6] J. Peise et al., Phys. Lett. B 384 (1996) 37
- [7] A. Hünger et al., Nucl. Phys. A 620 (1997) 385
- [8] F. Wissmann et al., Nucl. Phys. A 660 (1999) 232
- [9] T. Ishii et al., Nucl. Phys. B 165 (1980) 189
- [10] Y. Wada et al., Nucl. Phys. B 247 (1984) 313
- [11] M. Jung et al., Z. Phys. C 10 (1981) 197
- [12] A.I. L’vov, V.A. Petrun’kin, M. Schumacher, Phys. Rev. C 55 (1997) 359
- [13] D. Drechsel, et al., Phys. Rev. C 61, 015204 (1999)
- [14] H.-J. Arends (private communication)
- [15] A.I. L’vov, A.M. Nathan, Phys. Rev. C 59 (1999) 1064
-
[16]
I. Anthony et al., Nucl. Instr. Meth. A 301 (1991) 230;
S.J. Hall et al., Nucl. Instr. Meth. A 368 (1996) 698 - [17] H. Herminghaus et al., Nucl. Instr. Meth. 138 (1976) 1; A 187 (1981) 103
- [18] P. Grabmayr et al., Nucl. Instr. Meth. A 402 (1998) 85
- [19] K. Ukai, T. Nakamura, ’Data Compilation of Single Pion Photoproduction below 2 GeV’, INS-T-550(1997)
- [20] Y. Nagashima et al., PRP Institute for Nuclear Study, University of Tokyo 81 (1964)
- [21] R.F. Stiening, E. Loh and M. Deutsch, Phys. Rev. Lett. 10 (1963) 536
- [22] K. Toshioka et al., Nucl. Phys. B 141 (1978) 364
- [23] D. R. Rust et al., Phys. Rev. Lett. 15 (1965) 938
- [24] P.S. Baranov et al., Sov. J. Nucl. Phys. 3 (1966) 3 791
- [25] P.S. Baranov et al., JETP 23 (1966) 242
- [26] E.R. Gray, A. O. Hanson, Phys. Rev. 160 (1967) 1212
- [27] H. Genzel et al., Z. Phys. A279 (1976) 399
-
[28]
R.A. Arndt, I.I. Strakovsky, R.L. Workman, Phys. Rev. C53 (1996) 430;
http://gwdac.phys.gwu.edu - [29] B.E. MacGibbon et al., Phys. Rev. C52 (1995) 2097
- [30] P.S. Baranov et al., Part. Nucl. Phys. (2001), in press; nucl-ex/0011015
- [31] B.R. Holstein, A.M. Nathan, Phys. Rev. D 49 (1994) 6101
- [32] A.I. L’vov, A.M. Nathan, unpublished (1999).
- [33] R. Beck et al., Phys. Rev. Lett. 78 (1997) 606
- [34] R. Beck et al., Phys. Rev. C 61 (2000) 035204
- [35] T.R. Hemmert et al., Phys. Rev. D 57 (1998) 5746
- [36] K.B. Vijaya Kumar et al., Phys. Lett. B 479 (2000) 167
- [37] G.C. Gellas et al., Phys. Rev. Lett. 85 (2000) 14
- [38] M.C. Birse et al., nucl-th/0011054
-
[39]
D. Drechsel et al., Nucl. Phys. A 645 (1999) 145;
http://www.kph.uni-mainz.de/MAID - [40] J.W. DeWire et al., Phys. Rev. 124 (1961) 909
- [41] R. Beck, H.P. Krahn, Phys. Rev. Lett. 79 (1997) 4512