Quest for double beta decay of 160Gd and Ce isotopes
F.A. Danevich, V.V. Kobychev, O.A. Ponkratenko,
V.I. Tretyak and Yu.G. Zdesenko111Corresponding author. Institute for Nuclear Research, Prospekt Nauki 47, MSP 03680 Kiev, Ukraine; fax: 380(44)265-4463; phone: 380(44)265-2210; e-mail: zdesenko@kinr.kiev.ua
Institute for Nuclear Research, MSP 03680 Kiev, Ukraine
Abstract
The decay study of 160Gd has been performed in the Solotvina Underground Laboratory with the help of Gd2SiO5:Ce crystal scintillator (volume 95 cm3). The background of the detector in the vicinity of the energy of 160Gd was reduced to 1.0 cpd/keVkg. The new improved half-life limits have been established for decay of 160Gd to the ground (0+) and first excited (2+) levels of 160Dy: (1.3) yr at 68%(90%) C.L. The bounds have been also set for , and modes of 160Gd decay, as well as for different decay processes in 136Ce, 138Ce and 142Ce.
PACS: 23.40.-s; 12.60.-i; 27.60.+j
Keywords: decay, neutrino mass, GSO crystal scintillator.
1 Introduction
An exceptional interest to the neutrinoless double beta () decay is explained by the great potential of this process – which violates the lepton number conservation – to search for the neutrino mass () and its nature as a sign of a possible new physics beyond the standard model (SM) [1, 2, 3, 4, 5, 6]. The absence of the decay, established at the required level of sensitivity, yields strong restrictions on , lepton violation constants and other parameters of the manifold SM extensions, which allow to narrow a wide choice of theoretical models and to touch the multi-TeV energy range competitive to the accelerator experiments [3, 4, 5, 6].
In fact, the most sensitive results were obtained by using the so called ”active source” technique, in which a detector (containing candidate nuclei) serves as source and detector simultaneously [1, 2]. As examples, we recall the impressive half-life limits in the range of yr ( eV) established for 136Xe (high pressure Xe TPC) [7], 130Te (low temperature bolometers TeO2) [8], 116Cd (enriched 116CdWO4 scintillators) [9], and the highest limit reached for 76Ge (enriched HP 76Ge detectors): yr [10, 11]. Therefore, it is apparent that application of the ”active source” technique with a new nucleus allows to extend the number of candidates studied with a high sensitivity222For example, the first interesting results were obtained recently for decay processes in 40Ca and 46Ca with the help of newly developed low radioactive CaF2(Eu) crystal scintillators [12]..
During last years cerium-doped gadolinium silicate Gd2SiO5:Ce (GSO) crystal scintillators have been developed [13, 14]. These scintillators are non-hygroscopic and have a large density (6.71 g/cm3), fast response (primary decay time about ns), quite high light output of NaI(Tl), wavelength of emission maximum 440 nm). Moreover, it was already demonstrated [15, 16, 17] that GSO crystals can be applied for the decay search of 160Gd, which is one of the interesting candidate nucleus due to the following reasons. First, despite rather low decay energy release ( keV [18]) its theoretical value of yr is nearly three times lower than that for 76Ge and 136Xe [19], thus for the equal measured limits the experiment with 160Gd will yield the more stringent restrictions on the neutrino mass and other parameters of the theory. Secondly, recent calculation [20] shows that two-neutrino decay of 160Gd is strongly forbidden due to heavy deformation of this nucleus. Meanwhile, the suppression of the decay mode would be not so strong due to different sets of intermediate states involved in both transitions. Therefore the energy region of signal of 160Gd could be free of the background from decays, which is very serious problem for detectors with the poor energy resolution [2] . Thirdly, the natural abundance of 160Gd is rather large (21.86% [21]) allowing to build up the high sensitive apparatus with natural GSO crystals.
The present paper describes the new and further improved half-life limits on decay of 160Gd obtained with the help of 95 cm3 GSO crystal scintillator and with about 3 times larger running time than in ref. [22], where preliminary results of this experiment have been already published.
2 Set up, background measurements and data analysis
Cerium-doped gadolinium silicate crystal (5.4 cm long, 4.7 cm in diameter) grown by Czochralski method was used in the measurements. The mass of the crystal is 635 g, and the number of 160Gd nuclei is 3.951. The first 630 h of measurements had been carried out with the mass of the crystal equal to 698 g, then its side surface had been ground on 1–1 mm.
The experiment was performed in the Solotvina Underground Laboratory (SUL) of the INR in a salt mine 430 m underground (1000 m w. e., cosmic muon flux 71 cm-2 s-1, neutron flux 2.71 cm-2 s-1, radon concentration in air 30 Bq m-3) [23]. In the low background installation the GSO crystal is viewed by the photomultiplier FEU-110 through a plastic light-guide 8.6 cm in diameter and 18.2 cm long. The energy resolution of the detector was measured in the energy region keV by using lines of 22Na, 137Cs, 207Bi, 226Ra, 232Th and 241Am sources. As an example, the resolution equals , , and at the energy 662, 1064, 1770 and 2615 keV, respectively. In course of measurement the energy calibration was carried out with 207Bi source weekly. The passive shield made of high purity copper (5 cm thickness), mercury (7 cm), and lead (15 cm) surrounds the GSO scintillator to reduce the external background. Event-by-event data acquisition system consists of the IBM PC compatible personal computer and CAMAC crate with electronic units, which allow to record the amplitude (energy) and arrival time of each event [24].
Total statistics collected in the experiment is 13949 h ( yr kg of exposure). The measured background spectrum of the GSO crystal is depicted in fig. 1, where the following peculiarities exist: the clear peak at the energy 420 keV, the comparatively wide peak at the energy around 1050 keV and two broad distributions dropped down at the energies 2.4 and 5.5 MeV. Taking into account the relative light yield for particles as compared with that for electrons ( ratio) for the GSO scintillator333The energy dependence of the ratio was determined by using the peaks of 214Po, 215Po, 216Po and 220Rn from the internal contamination of the crystal as following: , where is in MeV. The mentioned peaks were selected from the background with the help of the time-amplitude analysis described below., the first peak is attributed to particles of 152Gd (81 yr; keV; abundance ) and 147Sm (61 yr; = keV; ; samarium can be present as impurity of the GSO crystal at the level of 8 ppm [15]). The peak near 1050 keV as well as the broad distribution up to the energy 2.4 MeV is mainly due to the radioactive contamination of the crystal by the nuclides from the 232Th, 235U and 238U families. The second distribution up to the energy 5.5 MeV is caused by decays of 232Th daughter isotopes: a) decay of 208Tl ( MeV); b) decay of 212Bi ( MeV) followed by decay of its daughter 212Po ( s; MeV or 2.7 MeV in scale).

To recognize and reduce the background from the intrinsic radioactive impurities of the crystal, the off-line analysis of the arrival times of measured events was fulfilled (as described in details elsewhere [22, 24]). Using this method fast sequences of decays belonging to the natural radioactive chains were searched for, as for example the sequence of two decays from the 232Th family: 220Rn ( MeV, s) 216Po ( MeV, s) 212Pb. Because the energy of 220Rn particles corresponds to 1.7 MeV in scale of the GSO detector, the events within the energy region MeV were used as triggers. Then all events following the triggers in the time interval ms (it contains the part = 0.945 of the total number of the 216Po decays) were selected. As an example, the spectra of the 220Rn and 216Po decays obtained in this way – as well as the distribution of the time intervals between the first and second events – are presented in fig. 2. It is evident from this figure that selected spectra and time distribution are in the excellent agreement with those expected from particles of 220Rn and 216Po. Taking into account the efficiency of the time-amplitude analysis, the number of accidental coincidences, and the interfered chain of 219Rn Po (it is selected by the applied procedure with efficiency), the 228Th activity in the GSO crystal was determined as 2.287(13) mBq/kg. Then on the next step of analysis the fast couples found (220Rn and 216Po) were used as triggers to search for preceding decays of 224Ra ( MeV, d). The time window was set as s (it contains of 220Rn decays). Resulting distribution which includes the accidental coincidences (calculated ratio of the effect to the accidental background is equal to 0.825) is also in a good agreement with the expected peak of 224Ra.

The same technique was applied to the sequences of decays from the 235U family: 223Ra ( MeV, d) 219Rn ( MeV, s) 215Po ( MeV, ms) 211Pb. For the fast couple (219Rn and 215Po), events within MeV were used as triggers and the time interval of ms (containing of 215Po decays with energy between 1.5 and 2.6 MeV) was chosen444The used procedure selects also pairs 220Rn 216Po and 214Bi 214Po with efficiencies and , respectively. These contributions are taken into account in the calculation of activities.. The obtained peaks correspond to activity of 0.948(9) mBq/kg for the 227Ac impurity in the crystal. Then the procedure analogous to that described for the 224Ra was applied to find the preceding 223Ra decays.
For the analysis of the 226Ra chain (238U family) the following sequence of and decays was used: 214Bi ( MeV, m) 214Po ( MeV, s) 210Pb. For the first event the lower energy threshold was set at 0.5 MeV, while for the second decay the energy window MeV was chosen. Time interval of s ( of 214Po decays) was used. The selection efficiency is also decreased a little by the energy threshold applied to the first event (in the procedures described above the selection efficiency of the energy windows is equal to ). By the Monte Carlo simulation the part of the 214Bi spectrum above 500 keV (as compared with the total spectrum) has been determined as . The obtained spectra for 214Bi555Peak observed in the spectrum of 214Bi (see fig. 3) is the part () of 219Rn decays (from 235U family), which corresponds to the chosen time interval s. Due to known activity of 227Ac the contribution of 219Rn 215Po (as well as of the chain 220Rn 216Po) was calculated accurately and subtracted from the activities of 214Bi and 214Po. and 214Po are shown in fig. 3 and lead to the 226Ra activity in the GSO crystal equal to 0.271(4) mBq/kg.

Besides determination of the background components, the time-amplitude analysis is used for reduction of the background. In this case, the attention is paid, first, to selection of time-correlated decays with minimal loss of the exposure, and, secondly, to prevention of the double selection of the events. With these aims four ”removing” procedures were applied (the subscripts numerate events in the chain):
(i) 500 keV; s; keV.
This cut removes mainly decays of 214Bi and 214Po ( , , , thus the total efficiency of selection is ), while efficiencies for the pairs of 219Rn – 215Po and 220Rn –216Po are rather low: and , respectively.
(ii) , keV; s – 1 s.
The corresponding efficiencies are: (219Rn – 215Po) ; (220Rn – 216Po) ; and (214Bi – 214Po) . It is also necessary to take into account the pairs of 223Ra – 219Rn () and 224Ra – 220Rn ().
(iii) In the third cut a fast chain of decays (220Rn – 216Po) is used as a trigger to select the previous event of 224Ra. The parameters taken for 224Ra selection are the following: 1000 keV; s; keV; s; keV. The final efficiency for selection of 224Ra is .
(iv) In the fourth cut procedure a fast chain of decays (219Rn – 215Po) is used as a trigger to select the previous event of 223Ra. The parameters are: 1000 keV; s; keV; s ms; keV. It removes 53.4% ( 0. of 223Ra decays.
Since the time windows of the cuts are not overlapping, the probability that one event could be selected more than once is rather low. Indeed, from the total number of 345169 events being attributed to the time-correlated background, only 318 (i. e. ) are double-selected.
The part of the measured distribution in the energy interval keV is depicted in the insert of fig. 1 (open circles) together with the resulting spectrum after subtraction of the selected decays (filled circles). It corresponds to yrkg of exposure ( 13400 h), or of the initial value that was decreased by the ”removing” procedures. At the same time, due to these procedures the background rate in the vicinity of the energy release of the decay of 160Gd ( keV) has been reduced by 2.3 times up to the value of 1.01(1) cpd/keVkg.
3 Background simulation
With the aim to evaluate the 2 decay processes in 160Gd the measured background spectrum (after subtraction of the time-correlated decays) was simulated with the help of GEANT3.21 package [26]. The event generator DECAY4 [27] was used to describe initial kinematics of decays (number and types of emitted particles, their energies, directions of movement and times of emission). It takes into account decays to ground state as well as to excited levels of daughter nuclei with the subsequent complex de-excitation process [25]. The possibilities of emission of conversion electrons and e+e- pairs instead of quanta in nuclear transitions and the angular correlation between emitted particles are also taken into consideration.
The background model was built up as a result of the procedure, in which the experimental spectrum was fitted by the sum of simulated response functions. The coefficients of the latest were determined on the basis of the following data:
i) Activity values for 228Th, 227Ac and 226Ra (and their short-lived daughters) that are present as intrinsic contamination in the GSO crystal. These activities were determined firmly and accurately (with uncertainty less than ) with the help of the time-amplitude analysis, as described above. The part of decays of 224Ra, 220Rn, 216Po; 223Ra, 219Rn, 215Po; 214Bi and 214Po was removed from the background spectrum, and the remaining part is calculated with high precision for all these nuclides. Thus, one can describe the spectrum of, for example, 228Thdaughters as a sum of the simulated spectra with exactly known areas. If we suppose the secular equilibrium within the natural radioactive chains for these contaminations, the activities of the remaining long-lived members of the 232Th, 235U and 238U families would be known too. However, it is known that chemical procedures and crystal growth usually break the equilibrium in the natural radioactive series. To account this possibility the activities of the mentioned remaining members of the radioactive chains (namely, 232Th, 228Ra, 235U+238U+234U, 231Pa, 230Th, and 210Pb) were taken as free parameters for the fitting procedure666Three isotopes of uranium 235U, 238U and 234U are not chemically separable, and their relative activities (0.046:1:1) do not change, so we can take only one parameter for these nuclides..
ii) The radioactive impurities of the photomultiplier (PMT), which are the main source of the external background. Their values for PMT FEU-110 were measured previously [24] as 3.0(3) Bq (40K), 0.8(2) Bq (226Ra) and 0.17(7) Bq (228Th). In the fit these activities were taken as free parameters varied within their errors.
Besides, simulated spectra of 40K and 138La – natural radionuclides which could be present in the GSO crystal – were included into the fitting procedure too. The last component of the background model is the exponential function (with two free parameters) which describes the residual external background (multiple scattering of quanta, influence of weak neutron flux and so on). The exponential behavior of this component was confirmed by the measurements with the high radiopurity CdWO4 crystal scintillator (454 g) performed in the same set up [28].
The fit of the experimental spectrum in the energy region MeV by the sum of the described components gives the following activities of the additional intrinsic contamination of the GSO crystal: 40K 14 mBq/kg; 138La 55 mBq/kg777This limit of 138La activity corresponds to the possible La impurity in the GSO crystal at the level of 67 ppm, which does not contradict with the results of the chemical analysis.; 232Th 6.5 mBq/kg; 228 Ra 9 mBq/kg; 238U 2 mBq/kg; 231Pa 0.08 mBq/kg; 230Th 9 mBq/kg; 210Pb 0.8 mBq/kg. The parameters of the exponent were also found in the fit procedure and its contribution to the experimental distribution was revealed to be small ( for the energy interval MeV). For illustration the fitting curve (in the energy region MeV) is presented in the insert of fig. 1 together with the experimental data.
4 Half-life limits on the 2 decay of 160Gd
Since in the measured spectrum the decay peak of 160Gd is evidently absent, only the limit for the probability of this process can be set on the base of the experimental data. To estimate the half-life limit , we use the formula lim , where is the detection efficiency, is the number of 160Gd nuclei, is the measuring time and is the number of effect’s events which can be excluded with a given confidence level. To calculate the values of and , the response function of the GSO detector for the effect being sought has been simulated with the help of GEANT3.21 and DECAY4 programs. It was found that for the decay the response function is the Gaussian centered at 1730 keV and its width (FWHM) equals 176 keV. The edge effects (escape of one or both electrons and bremsstrahlung quanta from the crystal) remove from the peak of events, thus . The values were determined in two ways. First, by using the so called ”one approach”, in which the excluded number of effect’s events is estimated simply as square root of the number of background counts in a suitably chosen energy window . Notwithstanding its simplicity this method gives the right scale of the sensitivity of the experiment. For instance, in the measured spectrum within the energy interval keV (it contains of the expected peak area) there are 74500 counts; thus, the square root estimate gives events. Using this value of , the total exposure related to 160Gd nuclei ( nuclei yr), and the calculated efficiency (), we obtain the half-life limit: T yr 68% C.L.. Further, the value was determined by using the standard least squares procedure, where the experimental energy distribution in the vicinity of the peak searched for was fitted by the sum of the background model (as described above) and effect’s peak being sought. It should be stressed that for the energy interval of interest the main important contributions (73 of the experimental spectrum within 1600 – 1900 keV) are the activities of 226Ra, 227Ac and 228Th (and their short-lived daughters) from the intrinsic contamination of the GSO crystal, whose values were determined accurately (better than uncertainty).
As a result of the fit procedure in the energy region 1.3–2.1 MeV, the obtained area for the decay peak is counts ( value equals to 0.85), thus giving no evidence for the effect. The difference between measured and simulated spectra in the energy region of the hypothetical decay peak of 160Gd is shown in fig. 4, where the excluded effect is also depicted (solid line). The number of effect’s events, which can be excluded with 90%(68%) C.L. was calculated [29] as 298(169). It gives the half-life limit:

(02)1 yr at 90%(68%) C.L.
Comparing our limit with the theoretical calculations [19], one can compute the restriction on the neutrino mass 26(19) eV at 90%(68%) C.L.
The same limit has been set for the transition to the first excited level of 160Dy (2+, 87 keV) because 87 keV quanta following this process will be almost fully absorbed inside the scintillator. The obtained limits are several times larger than those already published [15, 16, 17, 22].
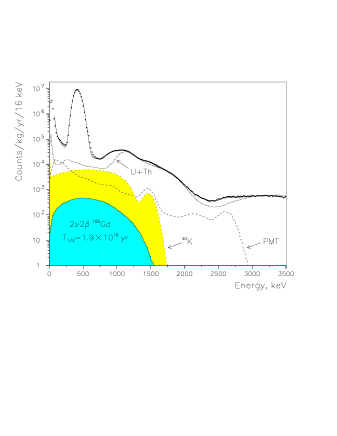
The two neutrino decay rate was evaluated in two ways. For the very conservative estimate the model spectra of the exactly measured contamination in the crystal and PMT were subtracted from the experimental data. The residual in the chosen energy region was equated to the simulated decay distribution and the latest was taken as an excluded effect with 7.6 events corresponding to the (g.s.) 51 yr ( C.L.) for decay of 160Gd. However, within this simple approach it was impossible to reproduce adequately the measured spectrum, thus the background model and the fitting procedure described above were applied for the decay mode too. The set of fits were performed by changing the fitting energy region from (100 760) keV to (2400 – 3000) keV. The maximum value of an excluded effect ( 2.21 events at C.L.) was found for the energy interval 760 – 2600 keV. The corresponding Monte Carlo simulated spectrum of decay of 160Gd (g.s.g.s.) is shown in fig. 5 together with the fitting curve and the most important background components. It is visible from this figure that our background model reproduces the experimental data quite well even outside the region of the fit. The final lower limit for the process searched for is equal to:
(g.s.) yr at () C.L.
The same method gives the limit for transition to the first (2+) excited level of 160Dy888It should be noted that shape of distribution for decay to 2+ level differs from transition to ground (0+) state [2].:
(2+) yr at () C.L.
The similar fitting procedure was used to set limits on double beta decays with one or two Majoron emission. The estimated restrictions on half-life are:
yr at () C.L.
yr at () C.L.
5 Limits on 2 decay processes of Ce isotopes
The concentration of cerium in the GSO(Ce) crystal () is known from the crystal growth conditions and from the results of the chemical analysis. It allows to search for the processes in three cerium isotopes: double positron decay (2), or electron capture and positron decay (), or double electron capture (2) in 136Ce (mass difference between parent and daughter atoms = 2397(48) keV; abundance of parent nuclide ); double electron capture in 138Ce ( keV; ); and 2 decay in 142Ce ( keV; ). The total numbers of 136Ce, 138Ce and 142Ce nuclei in the crystal are 4.1, 5.4 and 2.4, respectively. The response functions of the detector for the different possible processes in these cerium isotopes were simulated with the help of GEANT3.21 code and event generator DECAY4. As an example, the simulated energy distributions for neutrinoless and two-neutrino 2 (Kand 2K) decays of 136Ce are presented in fig. 6. Limits on half-lives with respect to different modes of 2 processes of cerium isotopes were calculated in the way analogous to that for 160Gd – they are summarized in the Table. Except two limits for 02 decay of 136Ce and 02 decay of 142Ce (already obtained by using CeF3 scintillators [30]), all presented results for cerium isotopes are set for the first time.

6 Conclusions
The present experiment performed in the Solotvina Underground Laboratory with the help of GSO scintillator has shown ”pro et contra” of these crystals for the advanced double decay study of 160Gd.
The current level of sensitivity is limited mainly by the intrinsic contamination of the GSO crystal (232Th, 235U and 238U families), therefore further development (which is in progress now) to remove these impurities from the crystals is at most importance. Careful purification of raw materials from actinides and their daughters (technically available now) could decrease radioactive contaminations of the GSO crystals by two-three orders of magnitude down to the level of several Bq/kg999Such a radiopurity has been already reached in the CdWO4 crystal scintillators used for the decay study of 116Cd [24, 31, 32].. Another possibility to reduce background is the pulse-shape discrimination. Our preliminary measurement shows the difference of decay times for pulses induced in GSO by particles and quanta: 50.8(4) and 48.3(4) ns, respectively101010These results are in a good agreement with ref. [33].. Although this difference is not so large, the proper pulse shape discrimination technique, which is under development now, would allow to eliminate background from decays of 147Sm, 152Gd and members of 232Th, 235U and 238U families.
On the other hand, due to the high abundance of 160Gd () the GSO crystals could be grown up from natural Gd, thus such detectors should be well less expensive than those made of enriched decay candidate isotopes. Therefore, the enforcement of the large scale and high sensitivity experiment with 160Gd would be really possible by using the GSO multi-crystal array with total mass of about 2000 kg (400 kg of 160Gd).
The background of such a detector could be reduced further by placing these crystals into a high purity liquid (water or scintillator)111111The existing and future large underground neutrino detectors (SNO [34] , BOREXINO [35], KamLand [36]) could be appropriate for our proposal with one-two tons of the GSO crystals. The latest located in the water or liquid scintillator would be homogeneously spread out on a sphere with diameter 3–4 m and viewed by the distant PMTs. serving as shield and light guide simultaneously. The similar idea has been recently proposed in CAMEO project [37] with aim to study 2 decay of 116Cd by using 116CdWO4 crystals placed in the liquid scintillator of the BOREXINO Counting Test Facility (CTF). It was evidently demonstrated by pilot measurements with 116Cd [9] and by Monte Carlo simulation that sensitivity of the CAMEO experiment (in term of the limit for decay) with 100 kg of 116CdWO4 crystals is 1026 yr which translates to the constraint on the neutrino mass eV [37]. Moreover, the strong dependence of the light collected by each PMT versus coordinate of the emitting source in the crystal has been found. Such a dependence is explained by difference of the refraction indexes of crystal ( = for CdWO4) and liquid scintillator ( = ), which leads to the redistribution between reflected and refracted light due to change of the source position. By means of the GEANT Monte Carlo simulation it was shown that spatial resolution of 1– 5 mm (depending on the event location and the energy deposit) can be reached with CdWO4 crystals ( cm) placed in the liquid scintillator of the CTF and viewed by 200 distant PMTs [37]. With the GSO detectors (refractive index = ) placed in a liquid ( ), the simulation of light propagation gives the spatial resolution in the range of 4 – 10 mm. Anyhow, it would certainly allow to reduce background in the energy region of interest additionally (roughly by factor of 10 – 50).
We estimate that sensitivity of the experiment with about two tons of the GSO crystals (placed in the SNO or BOREXINO set ups) and for 5 – 10 years of exposition would be of the order of 21026 yr, hence the restriction on the Majorana neutrino mass can be reduced down to eV. It is comparable with the sensitivities of the recently proposed large scale projects for decay study, like MOON [40], EXO [41], CAMEO [37], CUORE [38], MAJORANA [42], GENIUS [39], whose results could provide crucial tests of the certain key problems and theoretical models of the modern astroparticle physics. Note, however, that cost of the GSO experiment would be well lower than those of mentioned projects.
The authors would like to thank A.Sh. Georgadze, B.N. Kropivyansky, A.S. Nikolaiko, and S.Yu. Zdesenko for their participation in the measurements.
References
- [1] M. Moe and P. Vogel, Ann. Rev. Nucl. Part. Sci. 44 (1994) 247.
- [2] V.I. Tretyak and Yu.G. Zdesenko, At. Data Nucl. Data Tables 61 (1995) 43.
- [3] J. Suhonen and O. Civitarese, Phys. Rep. 300 (1998) 123.
- [4] A. Faessler and F. Simkovic, J. Phys. G: Nucl. Part. Phys. 24 (1998) 2139.
- [5] H.V. Klapdor-Kleingrothaus, Int. J. Mod. Phys. A 13 (1998) 3953. M. Hirsch and H.V. Klapdor-Kleingrothaus, Prog. Part. Nucl. Phys. 40 (1998) 323.
- [6] P. Vogel, nucl-th/0005020 9 May 2000.
- [7] R. Luescher et al., Phys. Lett. B 434 (1998) 407.
- [8] A. Alessandrello et al., Phys. Lett. B 433 (1998) 156; Phys. Lett. B (2000) in press.
- [9] F.A. Danevich et al., Phys. Rev. C 62 (2000) 045501.
- [10] L. Baudis et al., Phys. Rev. Lett. 83 (1999) 41; V. Alexeev et al., INFN – LNGS Ann. Report 1999, p. 77.
- [11] C.E. Aalseth et al., Phys. Rev. C 59 (1999) 2108; D. Gonzalez et al., Nucl. Phys. B (Proc. Suppl.) 87 (2000) 278.
- [12] P. Belli et al., Nucl. Phys. B 563 (1999) 97.
- [13] H. Ishibashi, Nucl. Instrum. & Meth. A 294 (1990) 271.
- [14] C.L. Melcher et al., IEEE Trans. Nucl. Sci. NS-37 (1990) 161.
- [15] S.F. Burachas et al., Preprint KINR-93-2, Kiev (1993); Phys. At. Nucl. 58 (1995) 153.
- [16] M. Kobayashi, S. Kobayashi, Nucl. Phys. A 586 (1995) 457.
- [17] T. Iwawaki et al., KEK Proc. 97-8 (July 1997) 66.
- [18] G. Audi and A.H. Wapstra, Nucl. Phys. A 595 (1995) 409.
- [19] A. Staudt et al., Europhys. Lett. 13 (1990) 535.
- [20] O. Castanos et al., Nucl. Phys. A 571 (1994) 276.
- [21] K.J.R. Rosman, P.D.P. Taylor, Pure & Appl. Chem. 70 (1998) 217.
- [22] F.A. Danevich et al., Nucl. Phys. B (Proc. Suppl.) 48 (1996) 235.
- [23] Yu.G. Zdesenko et al., Proc. 2 Int. Symp. Underground Phys., Baksan Valley, 1987 (Nauka, Moscow, 1988) p. 291.
- [24] F.A. Danevich et al., Phys. Lett. B 344 (1995) 72.
- [25] R.B. Firestone, Table of Isotopes, ed. by V.S. Shirley, 8th ed. (John Wiley & Sons, N.Y., 1996).
- [26] GEANT. CERN Program Library Long Write-up W5013, CERN (1994).
- [27] O.A. Ponkratenko et al., Phys. of Atomic Nuclei 63 (2000) 1282.
- [28] F.A. Danevich et al., Phys. At. Nucl. 59 (1996) 5.
- [29] Particle Data Group, Review of Particle Properties, Phys. Rev. D 54 (1996) 1.
- [30] R. Bernabei et al., Nuovo Chimento A 110 (1997) 189.
- [31] F.A. Danevich et al., Sov. J. Prib. Tekhn. Exper. 5 (1989) 80.
- [32] S.Ph. Burachas et al., Nucl. Instrum. & Meth. A 369 (1996) 164.
- [33] H. Ishibashi et al., IEEE Trans. Nucl. Sci. 36 (1989) 170.
- [34] A.B. McDonald, Nucl. Phys. B (Proc. Suppl.) 77 (1999) 43; J. Boger et al., Nucl. Instrum. & Meth. A 449 (2000) 172.
- [35] G.Bellini, Nucl. Phys. B (Proc. Suppl.) 48 (1996) 363.
- [36] A. Suzuki, Nucl. Phys. B (Proc. Suppl.) 77 (1999) 171.
- [37] G. Bellini et al., Phys. Lett. B 493 (2000) 216.
- [38] E. Fiorini, Phys. Rept. 307 (1998) 309.
- [39] H.V. Klapdor-Kleingrothaus et al., J. Phys. G: Nucl. Part. Phys. 24 (1998) 483.
- [40] H. Ejiri et al., nucl-ex/9911008 v3 15 May 2000.
- [41] M. Danilov et al., Phys. Lett. B 480 (2000) 12.
- [42] E. Fiorini, Review talk on Neutrino’2000, to be published in Proceedings.
| Nuclide | Decay mode | Limit on T1/2, yr | |||
|---|---|---|---|---|---|
| present work | other works, (C.L.) | ||||
| 90(68)% C.L. | |||||
| 160Gd | 2 | g.s.–g.s., | (90%) [15] | ||
| (68%) [16] | |||||
| (90%) [22] | |||||
| g.s.–g.s. | (99%) [15] | ||||
| g.s. | |||||
| g.s.–g.s. | (99%) [15] | ||||
| g.s.–g.s. | |||||
| 136Ce | 2 | g.s.–g.s. | (68%) [30] | ||
| g.s.–g.s. | |||||
| K | g.s.–g.s. | ||||
| g.s.–g.s. | |||||
| 2K | g.s.–g.s. | ||||
| g.s.–g.s. | |||||
| 138Ce | 2K | g.s.–g.s. | |||
| g.s.–g.s. | |||||
| 142Ce | 2 | g.s.–g.s. | (68%) [30] | ||
| g.s.–g.s. | |||||