Simultaneous Measurements of the Reactions
Abstract
A stack of annular detectors made of high purity germanium was used to measure simultaneously and differential cross sections at beam momenta of 750 MeV/c, 800 MeV/c, and 850 MeV/c over a large angular range. The extracted total cross sections for the reactions bridge a gap between near threshold data and those in the resonance region. The ratio of the cross sections for the two reaction channels taken at the same yields indicating that a deviation from isospin symmetry is very small.
1 Introduction
The study of the two reactions
| (1) | |||
| (2) |
is of interest because of the underlying reaction mechanism. On one hand, the deuteron is the ideal case for the impulse approximation. In this approximation the incident proton interacts with one target nucleon leaving the third nucleon as a spectator. Thus, both reactions are dominated by the underlying two elementary reactions
| (3) | |||
| (4) |
On the other hand, the struck nucleon is bound in the deuteron and its momentum distribution will strongly influence the reaction since the presently chosen lowest beam momentum of 750 MeV/c is still below the pion threshold in nucleon–nucleon interactions.
The model of the underlying elementary reactions 3 and 4 goes back to Ruderman [1]. Although many groups have theoretically studied the two reactions along this path, only moderate success has been achieved. The various approaches differ in the treatment of the bound state wave functions, additional interactions, distortions, inclusion of the deuteron D-state and so on. An excellent overview of the theoretical work is given by Canton et al. [2].
Studies of pion production on the nucleon as well as on light nuclei induced by protons have been shown to be dominated by excitation of the P-wave isobar. Only very close to threshold one is sensitive to the interesting pion S-wave [3]. While for the elementary reactions 3 and 4, no interference between these two waves can occur because of the symmetry in the entrance channel, reactions 1 and 2 show very strong forward–backward asymmetry containing information on the phases. The models are therefore especially successful in the resonance region where the interference is small compared to the P-wave contribution. Germond and Wilkin [4] showed that for collinear kinematics only two independent amplitudes exist. These were fitted to forward and backward scattering angles, to differential cross section data and to deuteron tensor analyzing powers [6]. It was shown in Ref. [4] that close to threshold the energy dependence of these two amplitudes is represented by a linear expansion in terms of with and the emission angle in the centre of mass system. However, when this model with the fitted parameters is extended to higher energies, it can neither describe the total cross sections nor the differential cross sections at forward and backward angles.

The situation for the total cross section is shown in Fig. 1. The data are from Ref.’s [8, 9, 10, 7, 11]. For the data from Ref. [10], charge symmetry was assumed to hold. Pickar et al. [11] extracted total cross sections from the forward and backward differential cross sections of Kerboul et al. [6] by making additional use of some systematics. These data are omitted here since they are much larger than direct measurements. The near–threshold data with are reproduced by the Germond -Wilkin model. The data in the resonance region follow the scaled cross section. Clearly, in the intermediate region where the S–D–wave interference effects are expected to be large, data are missing. We, therefore, performed measurements for reaction 2 in that interval. In these experiments, also the production of (reaction 1) was measured simultaneously. A comparison of reactions 1 and 2 permits the study of isospin symmetry breaking. The beam energy was chosen to be below the resonance in order to avoid problems due to different resonance masses. On the other hand, the momentum seems to be sufficiently large to minimize Coulomb effects in the exit channel.
Isospin symmetry is known to be only an approximate symmetry. In addition to static breaking due to Coulomb effects, the dynamic effects due to the mass differences between the up and down quark are expected to contribute [12]. Isospin symmetry predicts a value of 2.0 for the ratio of the cross sections. There have been several studies in the literature of the ratio
| (5) |
for the same beam momentum. However, it is not clear whether this is the proper quantity to study isospin symmetry conservation because of the different pion masses and mass differences between and . The great advantage of the present work compared to measurements with constant pion centre of mass momentum is that a simultaneous measurement avoids a lot of systematical errors. This principal advantage is lost when the detector does not allow simultaneous measurements as in Ref.’s [14, 15, 16, 17]. Furthermore, these studies are restricted to only a few (up to 4) angles. All previous results for are larger than 2. The two reactions were also measured almost over the full angular range by the same group with the same apparatus at 500 MeV, however at different time [18, 9]. We found from these measurements an integral ratio . It should be mentioned that the authors never drew conclusions about charge independence from the cross section data but studied analyzing powers. Köhler [19] studied the ratio in the framework of the Ruderman approach [1, 13] and found the ratio of the form factors to be the dominant source of deviation from 2.
2 Experimental Procedure
We have measured reactions 1 and 2 simultaneously employing a detector with large momentum and geometrical acceptance for both heavy recoiling nuclei at the same time. Proton beams with momenta of 750 MeV/c, 800 MeV/c, and 850 MeV/c were extracted from the COSY accelerator and focussed onto a target cell containing liquid deuterium. It had a diameter of 6 mm and a thickness of 6.4 mm [20] with windows of 1.5 m Mylar. The excellent ratio of deuterium to heavier nuclei in the window material reduced empty target events to a negligible level in contrast to all previous studies. The beam intensity was measured by different monitor counter arrangements being individually calibrated for each setting of the accelerator. The calibration was done by measuring the number of scattered particles in the monitor counters as a function of the beam particles. The latter were measured with the trigger hodoscope in the focal plane of the magnet spectrograph. This number is of course much larger and leads to dead time in the hodoscope. The beam intensity was then reduced by debunching the beam between the ion source and the cyclotron injector. For sufficiently small beam intensity, the relation between monitors and hodoscope is linear. Because of the chosen geometry, the counting rate in the monitor counters was small, thus avoiding errors due to pile up. The detector system is the so called GEM detector, consisting of the “GErmanium Wall” [21] and the Q3D2Q Magnetic spectrograph [3] at COSY. Here we give only some additional details specific for this experiment.The germanium wall consisted of three high purity germanium detectors with radial symmetry with respect to the beam axis as shown in figure 2.

The first detector (called Quirl-detector) measures the position and the energy loss of the penetrating particles. The active area of this diode is divided on both sides by 200 grooves. Each groove is shaped as an Archimedes’ spiral covering an angular range of with opposite directions on the front and rear side, respectively. The energy-detectors are mainly used for measuring the energy loss of the penetrating particles or the total kinetic energy of stopped particles, respectively. These detectors are divided into 32 wedges to reduce the counting rate per division leading to a higher maximum total counting rate of the total detector.
Fig. 3 shows the response of the germanium wall for reaction particles from the interaction of 850 MeV/c protons with deuterons.

Clearly visible are bands attributed to protons, deuterons, tritons, and . The latter two ions are produced in the two reactions of present interest and . Protons and deuterons are from elastic scattering and from reactions. The faint areas for protons and deuterons are due to the situation where one particle with higher energy generates a trigger for a low energy particle falling below the discriminator thresholds. The information deduced from the germanium wall are energy, emission vertex and particle type. They were converted to a four momentum vector. These measurements together with the knowledge of the four momenta in the initial state yield the missing mass of the unobserved pion by applying conservation of momentum, energy, charge and baryon number.
In the off-line analysis, soft gates were applied to the triton and loci in Fig. 3. This leads to some background in the missing mass spectrum but avoids throwing away good events. An example for and emission at a beam momentum of 850 MeV/c is shown in Fig. 4.
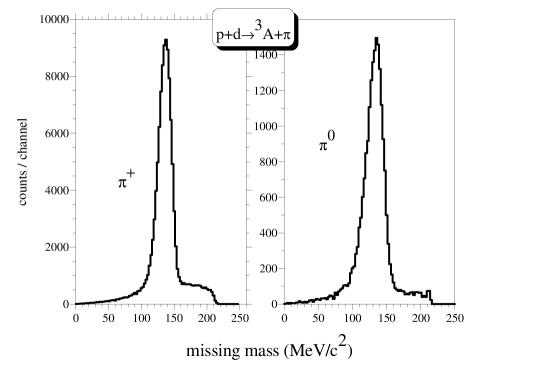
The data are shown as histograms. The good peak to background ratio is obvious as well as the excellent statistics. The peak in the case of emission is broader than for emission. This is due to the larger energy straggeling in the target of the double charged particle compared to the one for single charged particle. In the final analysis this effect is corrected. The data could be fitted by a second order polynomial for the background and a Gaussian with variable width for the peak. In order to remove this background, spectra of observables not depending on the emission angle were analyzed. For the curve was linearized and projected to the -axis. For the centre of mass momentum was used. The resulting spectra show a peak on a smooth background. In a second step, the background was fitted by smooth functions and subtracted for each bin in . The efficiency of the analysis procedures were studied by Monte Carlo calculations [22].
For particles being stopped in the Quirl detector, the kinematical relation between emission angle and energy was applied. Unfortunately, this was only possible for the runs at 750 MeV/c and 800 MeV/c, while in the runs at 850 MeV/c a hardware coincidence between the Quirl and the first energy detector was required. Tritons being emitted under zero degree in the laboratory system with the smallest energy were detected in the magnetic spectrometer applying hardware and software cuts as reported in Ref. [3]. Finally, the data were corrected for reduced efficiencies due to nuclear absorption in the detector material [23].
3 Experimental Results
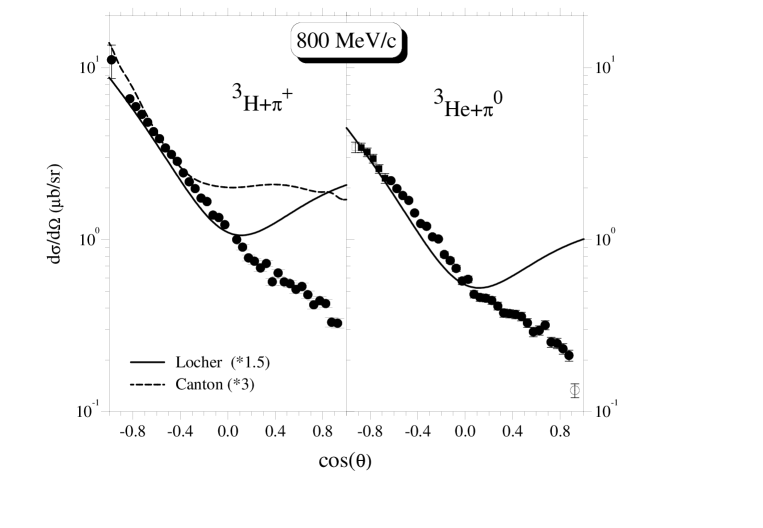
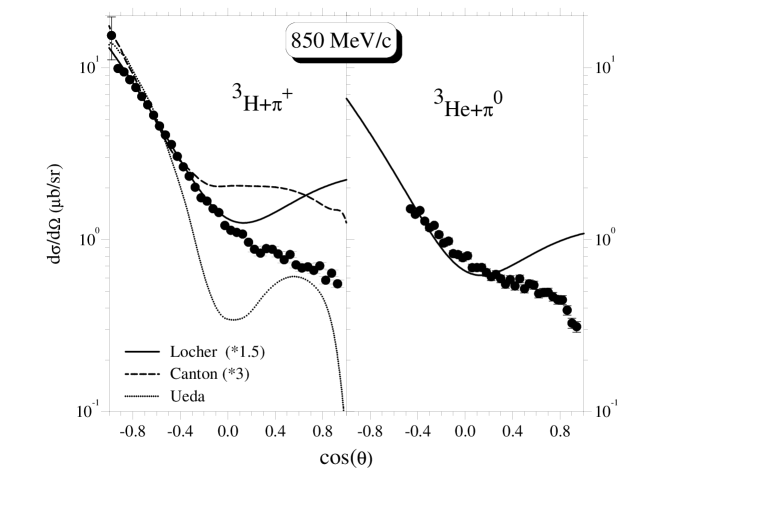
The measured angular distributions in the centre of mass system are shown in Fig. 5, 6, and 7 for beam momenta of 750 Mev/c, 800 MeV/c, and 850 MeV/c, respectively.
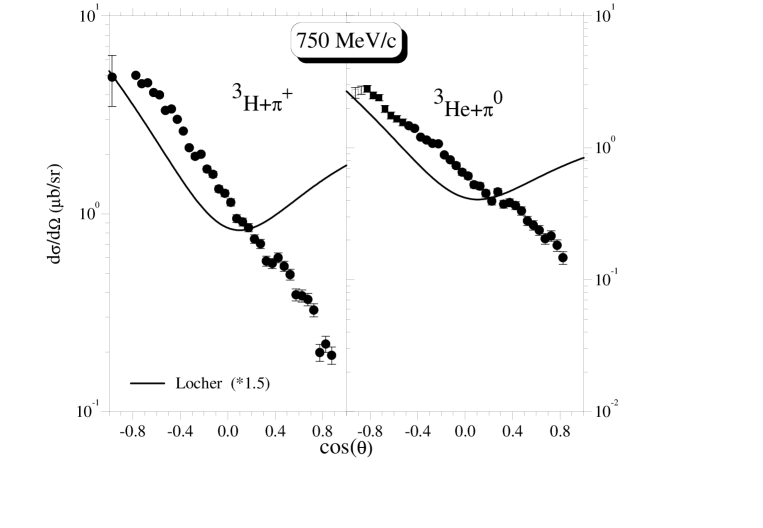
All data are from the measurements with the germanium wall except the triton zero degree measurement corresponding to in the centre of mass system. These points were obtained with the help of the magnetic spectrograph. Because of the small acceptance left over for this device by the hole in the germanium wall the count rate was rather small. An additional uncertainty is due to the size of the acceptance which may result from a slightly inclined beam together with the rather thick target and a beam having widths of mm and mm. We assume this additional uncertainty to be 20 and add it to the count rate error in quadrature. For emission at smaller energies for the 750 MeV/c and 800 MeV/c beam momenta the analysis was based on the almost linear relation between kinetic energy and emission angle for the two body reaction, as mentioned above. This method leads to a larger background than in case of coincidence measurements esp. due to the triton events with not too different kinematics. Therefore, the statistical error bars are much larger for these data which are shown as squares in Fig.’s 5 and 6. These points show some deviations from the points obtained from the coincidence measurements because of threshold effects. The Quirl had a thickness of 1.3 mm. ions with approximately 70 MeV kinetic energy are stopped in this detector. This corresponds to and for the beam momenta of 750 MeV/c and 800 MeV/c, respectively. Ions with slightly larger energy can fall below thresholds in the trigger electronics or the ADC. This effect leads to a reduction of counting rate for larger emission angles and to an increased counting rate in a similar interval below these angles due to the smaller energy deposit of these ions in the Quirl detector. (In principle a hole should appear but this is smeared out due to the longitudinal straggling.) We have studied this effect with Monte Carlo calculations and found that differential cross sections can be different up to . The data are finally corrected for this effect.
The shown error bars include the statistical uncertainty as well as the systematic one from background subtraction. This is larger in the case of tritium emission than for emission while the pure statistical uncertainty behaves opposite.
The cross sections for both reactions show a backward peaking of the nuclei which corresponds to a forward peaking of the pion. The angular distribution for the smallest beam momentum shows an exponential decrease with increasing . For the larger beam momenta an additional component at forward angles shows up which seems to be less angle dependent. Also shown in Fig.’s 5, 6, and 7 are model calculations which will be discussed further down. Only the statistical errors are shown. In addition, there are systematic uncertainties due to target thickness (5%), luminosity calibration (7%) and detector response and analysis method (3%). Only the last contribution is different for the two reactions. The same is true for the energy loss corrections in the target. This leads to a total systematic error of up to 9.1.
4 Discussion
4.1 Comparison with other data
We will first compare the present results with older data. This is done in Fig. 8.
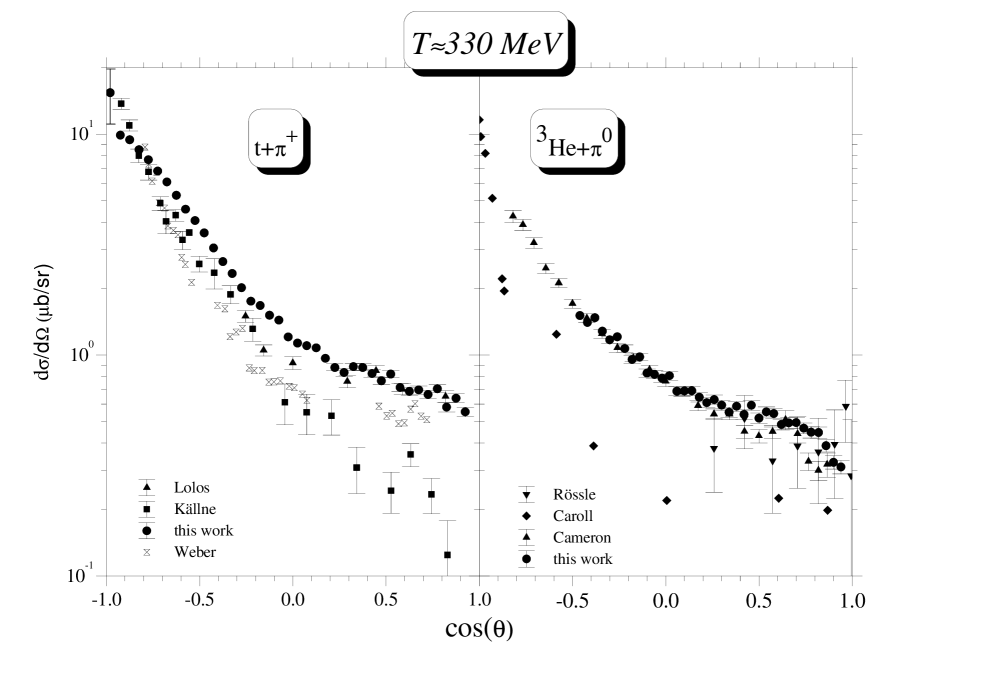
The data from Ref. [25] and Ref. [27] are from pion absorption and are transformed assuming charge symmetry as well as time reversal invariance and hence these data were transformed using detailed balance. All previous data have larger error bars than the present ones. For the charged exit channel, the older data seem to follow a steeper angular dependence than the present data. The cross sections from Källne et al. [25] for the forward angles are smaller than the present ones. For the neutral exit channel there is a striking agreement between the present data and those of Cameron et al. [9], but the data from Carroll et al. [28] differ. The data from Rössle at al. [10] are for the related reaction. They have extremely large error bars. The trend in the latter data to rise at forward angles is not seen in the present data and seems to be not statistically significant.
4.2 Forward-backward and total cross sections
In order to extract total cross sections as well as to extrapolate the present measurements, analytic functions were fitted to the angular distributions. A Legendre polynomial of fourth order and fifth order in the case of 850 MeV/c was found to yield smallest degree of freedom and the final results are from these fits. Also an exponential with a constant could account for the data, however with much larger uncertainties. This may have its origin in the different number of fitted parameters. The total cross section is obtained by integrating the fitted angular distributions over the full solid angle. Due to the ambiguity in the order of the Legendre polynomial and the corrections applied to the data close to the detector acceptance limit a systematic uncertainty shows up. In case of the emission the backward angle range causes some errors. For the two lower beam momenta the different method of measurement without coincidence compared to the forward emitted particles introduced larger error bars and a specific structure as is discussed above. The influence of this structure on the total cross section is estimated by simulations. As a result, a systematic error in addition to the fit error shows up. For 850 MeV/c no such data exist because of the coincidence requirement in the hardware trigger. The influence of the missing data was studied by truncating the corresponding triton angular distribution and the distribution from Ref. [9] suggesting a systematic uncertainty of 10. The total cross sections for both reactions are compiled in Table 1 with the first error the statistical error and the second error the systematical one as discussed. In addition, there is a systematic uncertainty of 9.1 from target thickness, beam intensity measurements and cuts during the data evaluation processes. The deduced cross section values increase with beam momentum for both reactions.
We proceed by extrapolating to and in the same way. The results are shown in Fig. 10 and Fig. 10, respectively, together with the results from Ref.’s [6, 11, 7, 9]. Only the data from Kerboul et al. [6] are direct measurements; all other data are obtained by us by extrapolation of fitted Legendre polynomials. For the distribution from Ref. [9] at a momentum of 1090 MeV/c one point, being off the distribution by almost four standard deviations, was excluded from the analysis. The best fitting Legendre polynomial had an order of 6 in this case.
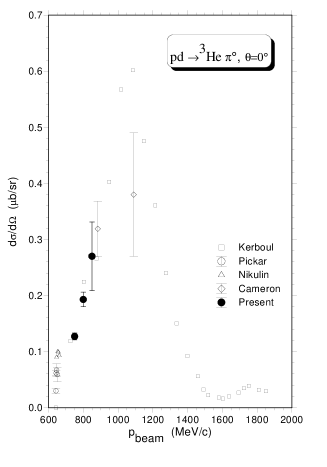
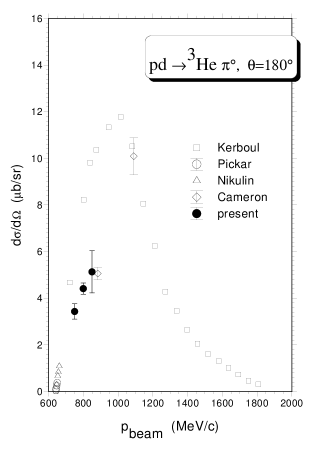
The extrapolation method leads to rather large uncertainties especially for . Unfortunately, the measurement of the cross sections for , which was foreseen to be done with the magnet spectrometer, failed, because of to thick material in the focal plane with respect to the large stopping power of . The Legendre polynomials have the tendency to underestimate the cross sections at . For these cases we show the more robust results of the exponential fits. They are in nice agreement with the data from Kerboul et al. [6]. The present backward angle results seem to be slightly smaller than the measurements by Kerboul et al. [6]. These large backward cross sections may be the origin for the too large total cross sections extracted from them by Pickar et al. [11] as discussed in the introduction. The present data agree with the result of Cameron et al. [9] as could be expected from Fig. 8
| momentum (MeV/c) | ||
|---|---|---|
| 750 | ||
| 800 | ||
| 850 |
The total cross sections are compared in Fig.’s 11 and 12 with data from Ref.’s [10, 9, 8, 7, 11] for the neutral exit channel and from Ref.’s [25, 18, 27, 29, 30, 31] for the charged exit channel. In addition to the cases mentioned above, the data from Aniol et al. [29] and Weber et al. [27] were transformed using detailed balance.
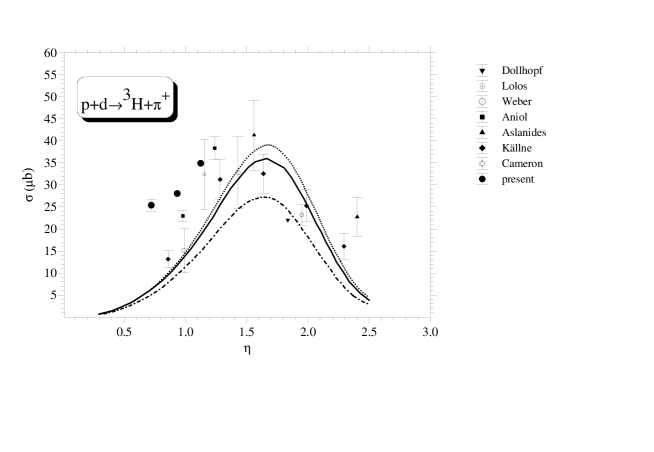
The present cross sections for the reaction seem to nicely interpolate between the near threshold data and those in the resonance region. The calculation employing the low energy parameters of the Germond–Wilkin model [4] shown as dashed curve and previously discussed in the introduction seem to come close to the present data point at 750 MeV/c bombarding momentum. Also shown is a calculation in the framework of the Locher–Weber prescription [5], which will be discussed below.
For the reaction, there are a few points in the range of the present data. Almost all of them stem from studies of negative pion absorption transformed by detailed balance assuming charge symmetry and time–reversal invariance. This disagreement was already noted by the authors of the latter data [29].
4.3 Model comparison
As discussed in the introduction, there are numerous models for the mechanism of these reactions. Here, we restrict ourselves to comparisons with published calculations for beam momenta close to the present ones or perform such calculations in the very transparent Locher–Weber model [5]. The differential cross section in this model is given by
| (6) |
with , a spin factor, a kinematical factor, and , the direct form factor and , the exchange form factor, i.e. an elastic scattering after pion emission from the incident proton. The form factors were evaluated with emphasis on the short–range components of the deuteron and the triton. This is achieved by fitting the free parameters in a Hulthén function to the deuteron–charge form factor and similarly for tritium, the parameters for the Eckart function and the 3-pole function to the tritium–charge form factor. These form factors are structure functions obtained from elastic electron scattering and should not be mixed with its component the monopole charge form factor, having a similar shape. The latter is the Fourier transform of a monopole density containing both the s-state and d-state deuteron wave functions times the sum of the proton and neutron form factors. The figure captions in Ref. [5] are somewhat confusing in this respect. It should be mentioned that the contribution of the magnetic dipole form factor to this quantity is very small. Since the experimental input into the fitting functions is rather old, we have compared these functions with newer measurements and find nice agreement for the deuteron form factor with results from Platchkov et al. [32] and for the form factor with those from Amroun et al. [33]. However, recent data from JLAB [34, 35] show that the assumed Hulthén function is too small for large momentum transfers.
We have fitted Legendre polynomials to the cross section of the elementary reaction including new data in the threshold region [3]. The energy dependence of the Legendre coefficients was fitted in 3 different but overlapping regions: threshold region, resonance region and above, although that interval is presently not of interest. Since the model does not treat the internal structure of the nuclei nor angular momenta it can not predict spin observables. One model ambiguity is the choice of the momentum of the struck nucleon. Since ignoring the Fermi motion in the deuteron leads to a wrong resonance position, the second option of Ref. [5] was chosen, i. e. ignoring of the Fermi motion in the triton. The emission angle was always assumed to be the same for both reactions.
Calculations employing the 3-pole wave function were found to be always smaller in the exponential part than those using the Eckart wave function. Here we present results only for the Eckart wave function. Such calculations are shown in Fig.’s 5, 6, and 7. A normalization factor of 1.5 was always applied. For emission, just an isospin factor of 0.5 was used. The small differences result from the different kinematics.
At 750 MeV/c, the data are larger than the calculations, whereas for the higher beam momenta the part of the angular distribution showing an exponential dependence is nicely reproduced. The strong increase in the calculations for forward angles is not supported by the data. This increase is reduced if direct and exchange contributions are added incoherently. The total cross section prediction within this model is shown in Fig. 11. It seems to work well in the resonance region, but fails in the threshold region.
In order to study the momentum range being sensitive to the present reactions we have introduced a step function in the integrals of the form factors. The results become almost independent if the truncation omits the range larger than 4, However, in this range the quadrupole form factor is already larger than the monopole form factor, thus making the D-state important which is missing in the present model.
In order to study the sensitivity of the model calculations to the form factors we have chosen the options used by Fearing [13]: again the Hulthén form for the deuteron but exponential, Gaussian, and Irving–Gunn forms for the using the range parameters from ref. [13] but the same normalization as Locher and Weber. In these calculations the same pion centre of mass momentum in the elementary as well as the reaction was assumed. Exponential and Gaussian give almost the same results as the Eckart function. The Irving–Gunn function leads to an almost symmetric angular distribution. Such a behaviour is in disagreement with the data. It is only this function which yields a different shape. The three others are very close to each other in the range up to 4 fm except for the Eckart function, which drops down for radii below the maximum at 1 fm. The resulting excitation function for the choice of an exponential form is also shown in Fig. 11. We have applied two normalizations: one to fit the present data and the same curve multiplied by 1.5 to investigate the near threshold region. The maximum is shifted towards smaller beam momenta when compared to the calculation employing the Eckart form. This is due to the assumptions about the effective energy and momentum in the subamplitude. The calculation with larger normalization yields larger cross sections than the Eckart form. However, the resulting cross section values are below the experimental points. This is similar to the results obtained by Falk [36]. His model is based on the same physical picture but more refined to also predict spin observables. The calculation underestimates the cross section data close to threshold by a factor of two, but overestimates data in the resonance region by a factor of approximately 2.6.
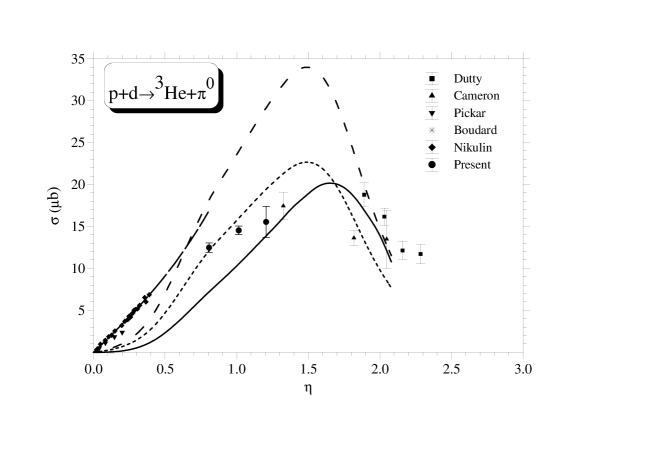
Canton and Schadow [2] performed much more rigorous calculations; again the reaction is the underlying mechanism. The three body wave function was calculated from nucleon–nucleon potentials employing three body calculations. In Fig.’s 6 and 7 the calculations are compared to the data. A normalization constant of 3 is used. The exponential behaviour at backward angles is reproduced. Forward angles are overestimated. Total cross sections as a function of the previously defined quantity are shown in Fig. 12 together with data. The calculations were performed for different nucleon–nucleon potentials: Bonn A, Bonn B, and Paris potential. The quality of the data in the resonance region does not allow discrimination between different potentials. It is surprising that in the range below all calculations with different potential choices start to merge whereas it is just this range where there are large differences in the calculations for the reaction [2]. It is interesting to note that the calculations for this reaction agree only with the experimental data when a strong final state between the deuteron and the pion is included in the calculation. The inclusion of this final state interaction increases the cross section by typically an order of magnitude which is surprising with respect to other calculations. This model also fails to reproduce the large differential cross sections shown in Figure 10.
Ueda [24] attacked the problem by splitting the many–body process into coupled multi-, three-, and two-body systems which were treated in a relativistic and unitary approach. Numerical input is obtained by adjusting potential parameters to two body scattering amplitudes: , , , , , and . A calculation without further normalization is shown in Fig. 7. It should be mentioned that a damping factor of 0.1 was applied to the otherwise too large amplitudes. The large cross sections at backward angles are reproduced. The oscillations at forward angles are not supported by the data. The success of this model may be that a lot of different graphs like and correlations (see Ref. [37]), multiple scattering effects (Ref. [13]) and three nucleon mechanism (Ref. [38]) are automatically included in this approach.
5 Isospin Symmetry
It was already pointed out by Ruderman [1] that data of the present type, i. e. differential cross sections for the two isospin related reactions, should allow for testing the validity of isospin symmetry. However, the two isospin related reactions have different Q-values leading to differences even for the same beam momentum.The ratios for the total cross sections yield for the three measurements (see Table 1). We compare the two exit channels on the level of differential cross section. The mean ratios are , and for the beam momenta of 750 MeV/c, 800 MeV/c and 850 MeV/c, respectively. However, the measured ratios are not constant, they show a trend to decrease with increasing emission angle. This may point to different shapes of the angular distributions for the two reactions. Already the different pion masses lead to trivial deviations from 2 for the ratio Eq. 8. To take this trivial deviation in some approximate way into account, we study the ratio for the differential cross sections instead at the same and the same –value. The angular distributions for the reaction at the same and -value are obtained by linear interpolating the angular distributions for the neighbouring and -values, respectively. The principal advantage of cancellation of systematical errors is lost in part by doing so and the linear interpolation may introduce another systematical error in the percent range. The results are for and for .
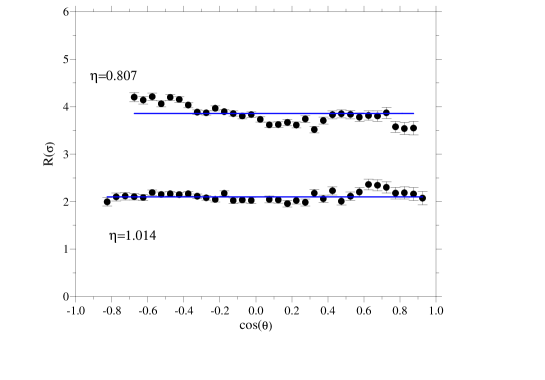
The ratios for the two reactions obtained for constant -values are shown in Fig. 13. This procedure yields for , and for , a ratio . In all cases we have corrected the data for the Coulomb effects by the usual Gamow factor being 2 to 3% depending on the momentum. All three methods lead to a weighted mean value close to two. However, it is not clear on which level one should compare. In addition, trivial effects due to different pion masses or pion or beam momenta remain. We may, therefore, compare matrix elements instead of differential cross sections. They are calculated according to
| (7) |
for a reaction . In Eq. 7 denotes the spins, the momenta of the initial and final state in the c. m. system, the total energies and the total energy squared. The matrix element is a function of the four momentum squared and is measured in fm3MeV. Eq. 7 is the relativistic formulation of the well known non-relativistic result (see Eq. 4.8 in Ref. [39]).
Such elimination of the phase–space factor from the data should lead to a more rigourous result as was pointed out by Silverman et al. [17]. The ratio of the matrix elements squared are , and for the same total energy , and for the same , and and for the same -values. It is interesting to note that the correction is smallest (less than 1%) for constant . It is always the measurement at 850 MeV/c which has a ratio much smaller than 2. The influence of this measurement on the results for constant or constant is small. If one neglects this one ratio, the mean values are , and for constant , and , respectively. Which criterion is the best is not clear. The latter two methods suffer from different measurements and the interpolation procedure resulting in some systematic error being at least of the order of the statistical error.
One may inspect the matrix elements directly. This is done in Fig. 14.
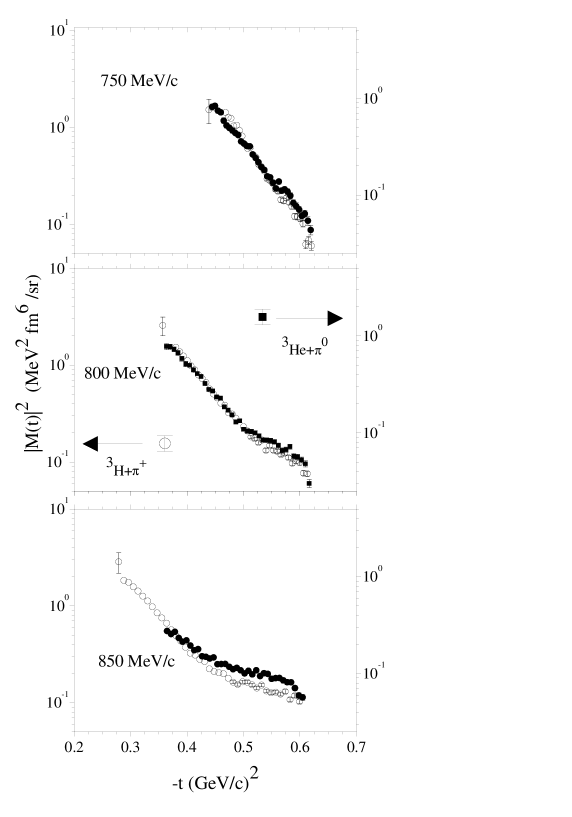
The matrix elements for the lowest beam momentum show an almost exponential dependence on the four–momentum transfer squared. For the highest momentum, an additional component for large–momentum transfer shows up, the same as the differential cross sections. The data definitely show a dependence on the beam momenta. This is in contrast to the conjecture by Silverman et al. [17] that the invariant matrix element squared is independent of the beam energy which, by the way, is not supported by any theory.
The y-axis for each beam momentum are adjusted to each other for the two reactions by a factor of two, in order to get an estimate of the validity of isospin symmetry. There is a common tendency in the data: the matrix element for the reaction is smaller than the isospin corrected one for the reaction for small momentum transfer and larger for large momentum transfer. This behaviour becomes more pronounced with increasing beam momentum. This may have its origin in different slopes for different and , the data decrease with increasing pion momentum. This leads to a t-dependence of the ratio
| (8) |
for data obtained at the same beam momentum.
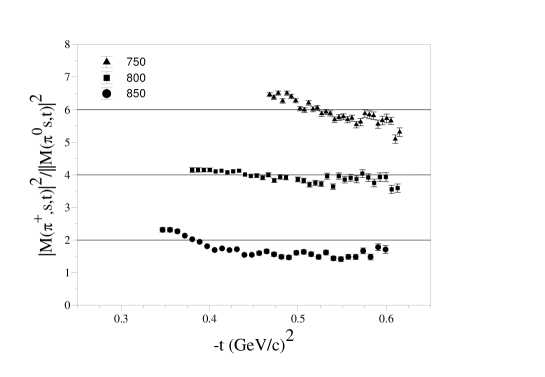
The ratios, not Coulomb corrected, show an decrease with increasing momentum transfer which may have its origin in different kinematics. The ratio for 850 MeV/c is flat for high momentum transfers and in this region much smaller than two. Whether these effects result from interferences with Coulomb effects or are due to increasing importance of resonance excitation with increasing bombarding energy needs further studies.
6 Conclusion
In summary, we have measured simultaneously the two reactions and in the intermediate region between the near threshold and the resonance range. A liquid deuterium target with very thin walls reduced empty–target corrections to a negligible level. By the present method problems due to normalization to beam current, target thicknesses, solid angle, dead time corrections etc. are avoided. It is the first time that the ratio of the two reactions is studied over a large angular range. The differential cross sections as well as the total cross sections for the reaction bridge the previous gap between data in the threshold region and the resonance region. However, for the reaction, a discrepancy with data for the time–reversed reaction shows up. This was already mentioned by Aniol et al. [29] and may have its origin in the differences between initial and final–states due to Coulomb effects in the two reactions.
It is found that models based on the input of cross sections or amplitudes yield total cross sections for the reactions which are close to cross sections scaled down by factors of 80 and 160 for the reaction and reaction, respectively. Since these data follow a different energy dependence than the present data, the calculations do the same. The enhancement of the calculated differential cross sections for large momentum transfer is not supported by the present data. It seems that none of the models discussed above is able to account for the experimental data over a large energy range on an absolute base. It is worthwhile to mention that the S-wave model of Locher and Weber [5] agrees best with the data in a range where the D-wave in the deuteron contributes most strongly.
The deduced isospin ratio of up to for the differential cross sections is smaller than the one found by Silverman et al. [17] of . The measured ratio of the matrix elements squared for the two lower beam momenta of is in agreement with the result obtained by Harting et al. [15] at a beam energy of 591 MeV. At this energy the differences in the kinematics are expected to be small. Köhler [19] estimated that, if the effect of the Coulomb force in the wavefunction is reduced, the ratio changes from 2 to for 600 MeV. Introducing such an additional correction leaves almost no room for isospin symmetry breaking. Such calculations for different beam momenta and with modern wavefunctions will be helpful in answering the question on the sensitivity of isospin symmetry breaking in the present two reactions. Further measurements will improve the present error bars.
7 Acknowledgement
We are grateful to the COSY operation crew for their efforts making a good beam. Support by BMBF Germany (06 MS 568 I TP4), Internationales Büro des BMBF (X081.24 and 211.6), SCSR Poland (2P302 025 and 2P03B 88 08), and COSY Jülich is gratefully acknowledged.
References
- [1] M Ruderman, Phys. Rev. 87 (1952) 383
- [2] L. Canton, G. Cattapan, G. Pisent, W. Schadow, J. P. Svenne, Phys. Rev. C 57 (1998) 1588; L. Canton and W. Schadow, Phys. Rev: C 56 (1997) 1231
- [3] M. Drochner et al., Nucl. Phys. A 643 (1998) 55
- [4] J.-F. Germond and C. Wilkin, J. Phys. G 16 (1990) 381
- [5] M. P. Locher and H. J. Weber, Nucl. Phys. B 76 (1974) 400
- [6] C. Kerboul et al., Phys. Lett. B 181 (1986) 28
- [7] V. N. Nikulin et al., Phys. Rev. C 54 (1996) 1732
- [8] A. Boudard et al., Phys. Lett. B214 (1988) 6
- [9] J. M. Cameron et al., Nucl. Phys. A 472 (1987)718
- [10] M. Dutty, Diploma thesis, Freiburg 1981 and E. Rössle et al., Proc. Conf. on Pion Production and Absorption in Nuclei (Edt. R. D. Bent), AIP Conf. Proc. 79 (1982)171
- [11] M. A. Pickar et al., Phys. Rev. C 46 (1992) 397
- [12] A. M. Bernstein, Phys. Lett. B442 (1998) 20 and references therein
- [13] H. W. Fearing, Phys. Rev. C 16 (1977) 313 and references therein
- [14] A. V. Crewe et al., Phys. Rev. 118 (1960) 1091
- [15] D. Harting et al., Phys. Rev. 119 (1960) 1716
- [16] J. W. Low et al., Phys. Rev. C 23 (1981) 1656
- [17] B. H. Silverman et al., Nucl. Phys. A 444 (1985) 621
- [18] J. M. Cameron et al., Phys. Lett. 103B (1981) 317
- [19] H. S. Köhler, Phys. Rev. 118 (1969) 1345
- [20] V. Jaeckle, K. Kilian, H. Machner, Ch. Nake, W. Oelert, P. Turek, Nucl. Instruments and Methods in Physics Research A 349 (1994) 15
- [21] M. Betigeri et al., Nuclear Instr. Methods in Physics Research 421 (1999) 447
- [22] W. Garske, Ph. D. Thesis, Universität Münster (2000)
- [23] H. Machner et al., Nucl. Instr. Methods for Physics Research A 437 (1999) 419
- [24] T. Ueda, Nucl. Phys. A 505 (1989) 610
- [25] J. Källne, J. E. Bolger, M. J. Devereaux, S. L. Verbeck, Phys. Rev. 24 (1981) 1102
- [26] G. J. Lolos et al., Nucl. Phys. 386 (1982) 477
- [27] P. Weber et al., Nucl. Phys. A534 (1991) 541
- [28] J. Caroll et al., Nucl. Phys. A305 (1978) 502
- [29] K. A. Aniol et al., Phys. Rev. C 33 (1986) 1714
- [30] E. Aslanides et al., Phys. Rev. 39 (1977) 1654
- [31] W. Dollhopf et al., Nucl. Phys. A 217 (1977) 381
- [32] S. Platchkov et al., Nucl. Phys. A 510 (1990) 740
- [33] A. Amroun et al., Nucl. Phys. A 579 (1994) 596
- [34] L. C. Alexa et al., Phys. Rev. Lett. 82 (1999) 1374
- [35] D. Abbott et al., Phys. Rev. Lett. 82 (1999) 1379
- [36] W. R. Falk, Phys. Rev. C 50 (1994) 1574 and C 61 034005
- [37] A. M. Green and M. E. Sainio, Nucl. Phys. A 329 (1979) 477
- [38] J. M. Laget and J. F. Lecolley, Phys. Lett. B 194 (1987) 177
- [39] D. H. Perkins, Introduction to High Energy Physics, Addison–WesleyPubl. Company 1987