Discovery of Long-Lived Shape Isomeric States which Decay by Strongly Retarded High-Energy Particle Radioactivity
Abstract
The reaction 28Si + 181Ta has been studied at ELab=125 and 135 MeV. Coincidences between high energy particles and various X- and -rays from abnormally long-lived states were observed. e.g. 7.8-8.6 MeV -particles with -rays of a superdeformed band, 5.1-5.5 MeV -particles with X- and -rays of W, Re, and Pt, and 3.88 MeV particles (interpreted as protons) with 185.8 keV -rays. The data are interpreted in terms of the production of long-lived (t1/2 of several months) high spin isomeric states in the second well of the potential in the parent nuclei, which decay to the normal states in the daughters, and in the third well of the potential, which decay to the second well.
PACS numbers: 23.60.+e, 21.10.Re, 21.10.Tg, 27.80.+w
I Introduction
The first evidence for a new kind of long-lived isomeric states was obtained in actinide fractions [1, 2] produced via secondary reactions in a CERN W target which had been irradiated with 24-GeV protons [3]. Isomeric states with t1/2 0.6 y and 30 d (104 - 105 times longer than the expected half-lives of the corresponding ground states) were found in neutron-deficient 236Am and 236Bk nuclei, respectively. About 3x10⁵ atoms of 236Am and 4x10⁴ atoms of 236Bk were produced in the isomeric states, and decayed by the or electron capture processes. The character of these states was not clear: they are far from closed shells where high spin isomers are usually found, and they have very long lifetimes as compared to the known shape isomers.
In addition [2, 4, 5], some new particle groups were found in the decay of various actinide fractions separated from the same W target. For example, an unambiguous 5.14 MeV -particle group with t1/2 4 y was seen in the Bk source [1, 2, 4, 5, 6]. This half-life is a factor of 2x10⁶ – 3x10³ too short [7] for the normal -decay of Bk – Pu nuclei. It was very difficult to understand such an enhancement. Furthermore, 3.0 and 4.0 MeV particle groups were seen from the Am source in coincidence with Lα1 X-rays in the Am region [2]. Since the relationship between the particle energies and their lifetimes deviate by about 23 and 12 orders [4] from the systematics [7] of -particles, it was assumed [4] that they were protons of unknown origin.
The clue to the understanding of the above mentioned findings has been obtained recently in several studies [8, 9] of the 16O + 197Au reaction at ELab = 80 MeV, where similar isomeric states and particle decays were found. An isomeric state which decays by emitting a 5.20 MeV -particle with t1/2 90 m has been found in 210Fr. Since this half-life is longer than the known half-life of the ground state of 210Fr, it was concluded that a long-lived isomeric state had been formed in this nucleus. A t1/2 of 90 m for 5.20 MeV -particles in 210Fr is enhanced by a factor of 3x10⁵ as compared to normal transitions [7, 8]. However, this group was observed in coincidence with -rays which fit predictions for a super-deformed band [8]. Therefore the effect of large deformations of the nucleus on the -particle decay was calculated and found [8] to be consistent with the observed enhancement. It was argued [8] that since the isomeric state decays to a high spin state, it should also have high spin, and since it decays by enhanced -particle emission to state(s) in the second well of the potential, it should be in the second well itself.
The predicted [10, 11] excitation energies of the second minima in the evaporation residue nuclei and their daughters produced by the 16O+197Au reaction are above the proton separation energies. Therefore a search for long-lived proton decays has been performed [9] using the same reaction. Two long-lived proton activities with half-lives of about 6 h and 70 h were found [9] with proton energies of 1.5 – 4.8 MeV with a sharp line at 2.19 MeV. This energy may correspond to a predicted transition [10] from the second minimum in 198Tl to the ground state of 197Hg with Ep = 2.15 MeV. The superdeformed state in 198Tl may be produced in an alpha decay chain of transitions from shape isomeric states to shape isomeric states starting from 210Fr. It should be noted that a long-lived high-spin isomeric state in the second minimum of the potential in 241Pu has been predicted by S. G. Nilsson et al. [12] back in 1969.
The present work reports on the discovery of new long-lived isomeric states, produced by the 28Si + 181Ta reaction at bombarding energies of 125 and 135 MeV, which decay by strongly hindered -particle and proton transitions. The lower energy is about below the Coulomb barrier. A fusion cross section of about 10 mb is predicted for this energy using a coupled-channel deformation code [13] with deformation parameters =0.41 for 28Si and =0.26 for 181Ta [14],***The value for 181Ta was taken as the average from the corresponding values of 180Hf and 182W. and allowing for 2+ and 3- excitations in 28Si. Only 2 b is predicted when no deformations are included in the calculations. For 135 MeV the corresponding predicted fusion cross sections are 95 mb with deformations and 40 mb without. At bombarding energies of 125 and 135 MeV, the compound nucleus is formed at excitation energies of 42.1 and 50.8 MeV, respectively. Preliminary results of this work have been published before [15, 6, 16].
II Experimental Procedure
In three irradiations, 2.5 mg/cm2 Ta targets followed by stacks of C catcher foils were bombarded with a 28Si beam obtained from the Pelletron accelerator in Rehovot. Irradiations I and II were performed with a 125 MeV 28Si beam and irradiation III with 135 MeV. Carbon catcher foils of 200 g/cm2 and 60 g/cm2 were used in order to catch the evaporation residue nuclei and their daughters. In all experiments the average beam intensity was about 11 pnA and the total dose about 1x10¹⁶ particles. Long period off-line measurements were carried out in the laboratory in Jerusalem, using the irradiated catcher foils as sources. In the present paper we summarize the results of the particle- coincidence measurements.†††- correlation measurements were performed with 60 g/cm2 C catcher foils situated in between two 300 g/cm2 Si detectors, but no correlation events with t 10 s could be significantly established. The preliminarily claimed correlations [15] cannot presently be ruled out to be due to other physical or electronic background effects. At longer correlation times the number of random events was too large. A 450 mm2, 300 m thick, Si surface barrier detector and a 500 mm2, 10 mm thick, thin window Ge(Li) detector were used for these measurements. The Si detector was calibrated using the 3.18 MeV -particle group of a 148Gd source and an accurate pulse generator. The Ge(Li) detector was calibrated using the X- and -rays of a 57Co source. The source was sandwiched between the Si and the Ge detector. Two 0.01 inch thick Be foils separated the source from the Ge detector. The first foil was the window for the vacuum chamber which included the source and the Si detector, and the second one the window of the Ge detector. The transparency of the two Be windows together was close to 100% for gamma-rays with Eγ 10 keV. The solid angle of the Si detector was about of 4 sr and of the Ge(Li) detector . The peak-to-total ratio of the Ge(Li) detector was 100% up to about 120 keV and decreased gradually to 22% at 250 keV. Its FWHM energy resolution was about 900 eV. The intrinsic resolution of the Si detector was about 25 keV. The full line widths for -particles of 5.0 to 8.6 MeV were 0.52 to 0.34 MeV, respectively, with a 200 g/cm2 C foil, and the corresponding values for the 60 g/cm2 foil were 0.16 to 0.10 MeV. The resolving time of the coincidence system was 1 s. The coincidence events together with the singles particle events were recorded event by event with a time accuracy of 1 ms.
III Results
A Singles and Coincident Events
Figs. 1 and 2 show typical singles particle and -ray spectra obtained at 125 MeV bombarding energy. Figs. 3 and 4 show similar spectra obtained at 135 MeV beam energy. From the measured -particle and -ray energies and lifetimes, production cross sections for various evaporation residue nuclei, with estimated errors of 25%, were deduced and are summarized in table 1. (Cross sections for some isomeric states (see below), are also given in table 1.)
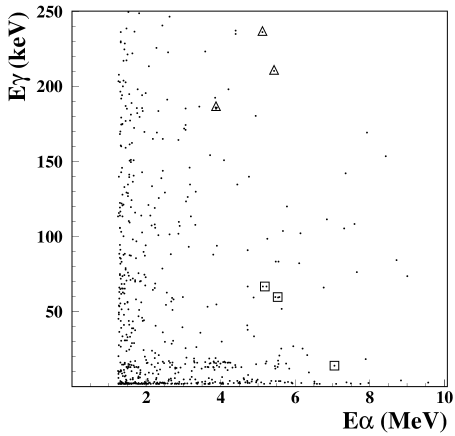
Figs. 5 and 6 give respective - coincidence plots from measurements I and II, corresponding to irradiations I and II. Figs. 7 and 8 are one dimensional projection plots on the -particle axis of figs. 5 and 6, respectively, for E 25 keV. Fig. 9 presents a particle- coincidence spectrum from measurement III, corresponding to irradiation III.‡‡‡During the first 77 d after irradiation I was completed, a search for proton activity using the E-E system of Ref. [9] was performed and gave negative results with an upper limit of about 0.5 nb for half-lives of between 20 hours to 70 days. On the other hand, in the 135 MeV experiment (fig. 9) we most probably saw protons in the particle- coincidences. (See further below). The estimated numbers of random coincidences in the 3 – 10 MeV particle energy and 10 – 250 keV -energy are 5.4 x 10⁻², 4.4 x 10⁻², and 0.4 in figs. 5, 6, and 9, respectively. Some of the coincidence events in figs. 5, 6 and 9, between 5-6 MeV -particles and various -rays, may perhaps be due to a contamination from an emanated 212Pb source from 228Th, which was used in the same chamber about 4 months earlier [9]. Despite the long time delay to our present long term measurements of 77 to 235 days, and careful cleaning of the chamber, we might have picked up some residual contamination. Also, indication for K X-rays of Rn is seen in this region. While in principle their origin may be from some reaction products, they also may be from the decay of 223Ra, which belongs to the 235U chain. Although it is not likely, but because of this ambiguity, we will not try to make a claim about this region. A two-dimensional background measurement, taken for 8 days, before the 212Pb source was used in the chamber, gave zero events in the whole region of 3.5 – 10 MeV particles and 0 – 250 keV ’s.
It is seen in figs. 5 and 6, and figs. 7 and 8, that while the region of -particles of 6 – 8 MeV is relatively empty, coincidence events are seen between various -rays and -particles of 8 – 9 MeV. In fig. 5, 13 coincidence events between 7.99 - 8.61 MeV -particles and various -rays of E 20 keV are observed, where 8 of them fall within a narrow range of 190 keV particle energy, between 8.42 - 8.61 MeV. (The estimated -particle full line width for the 200 g/cm2 C foil is around 340 keV). From the intensities of the singles in the - and -ray spectra (339 -particles and 2.14x10⁷ gamma-rays in 76.8 days), and the resolving time of 1 s of the coincidence system, the total number of random coincidences in the 8 - 9 MeV region was estimated to be 2.2x10⁻³. In fig. 6 one finds 8 coincidence events between 8.19 – 9.01 MeV, where 5 of them fall within 70 keV, between 8.55 – 8.62 MeV, and one at 9.01 MeV. (The -particle full line width for a 60 g/cm2 C foil is about 100 keV). The corresponding estimated total number of random coincidences between 8 to 9 MeV is 1.4x10⁻³. One does not see such concentration of events in the same energy region in fig. 9 which was taken for about 2.7 times longer period than figs. 5 and 6. 3 events are seen in the 8 - 9 MeV region in fig. 9 which sets an upper limit on the background in figs. 5 and 6 to be aroud 1 count as compared to the respective 13 and 8 counts seen experimentally. It was estimated that in the 8 – 9 MeV range of -particles, at most 0.8 events in fig. 5 and 0.3 events in fig. 6 may be due to the contamination mentioned above of coincidences between and -rays from 212Bi and the 8.78 MeV -particles from 212Po (t1/2 = 0.3 s).
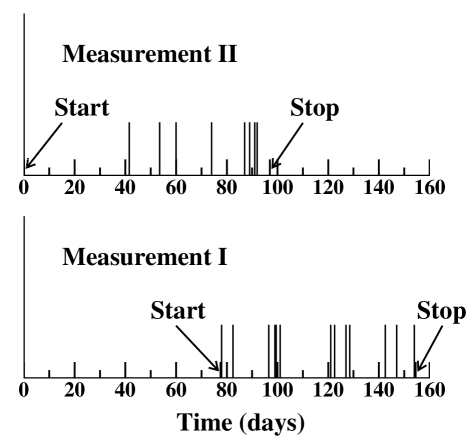
Fig. 10 shows time sequence plots for the - coincidences with -energies of 8–9 MeV obtained in measurements I and II and seen in figs. 5 and 6, respectively. In measurement II a growth in the intensity of the 8–9 MeV group was found from the beginning up to 97 days after the end of irradiation. In measurement I no significant change in decay rate was observed between 77 to 154 days and, by binning the data, t1/2 40 days was estimated for the lower limit of the decaying half-life. An additional measurement, taken about 4.5 y after the one presented in fig. 5 and measurement I of fig. 10, gave 0 counts in 22.0 d. An upper limit for the half-life of t1/2 2.1 y is deduced from this measurement.
B Rotational Bands and Sum Events
Table 2(a) and fig. 11 show that almost all the coincidence events in figs. 5 and 6 with 7.8-8.61 MeV -particles (the encircled ones) fit very nicely with a J(J+1) law assuming Ex = 4.42xJ(J+1) keV and J = 1. This fit is very significant from a statistical point of view [8]. All the gamma-rays in fig. 5 (7 out of 7 events), and almost all of them in fig. 6 (6 out of 7 events), which are above 90 keV, fit, to within 0.5 keV on the average, with this formula. The probability for 13 out of 14 events which are distributed evenly (for instance due to Compton effect from higher energy gamma-rays), to fall into 13 specified energy positions, within 1 keV is:
p13(1-p)(14-13) = 4.1 x 10⁻⁸.
p is equal to 36x1.0/(250-90). 36 is the number of possible gamma-transitions between states of both integer and half integer spins with Ex = 4.42 x J(J+1), in the range of 90 to 250 keV. (The four low energy events of Eγ 60 keV in fig. 5 and the one event in fig. 6 which do not fit with the J(J+1) rule may be due to Compton events). It is also seen in fig. 6 and in table 2(b) that the -rays of the 3 coincidence events in the region of 6 - 7 MeV -energy of 6.16 MeV - 176.1 keV, 6.94 MeV - 207.4 keV and 6.41 MeV - 242.3 keV, fit with 20 19 (176.4), 47/2 45/2 (207.3) and 55/2 53/2 (242.6) J J-1 transitions, assuming Ex = 4.41xJ(J+1) keV. The probability in this case that this fit is accidental due to a chance coincidence of evenly distributed events is 1.2x10⁻³, taking into account that p = 18x0.47/(250-170). 18 is the number of possible gamma-transitions in the range of 170 to 250 keV, and 0.47 keV is twice the average deviation from the specified energies. (This probability increases to 1.1x10⁻² if, instead of 0.47 keV, the value which was used before of 1.0 keV is assumed in the calculation). It should be mentioned that rotational constants around 4.4 keV correspond to superdeformed bands [SDB] in this region of nuclei [8].
In fig. 9 one sees about 10 scattered events in the 6.5 – 9 MeV region. Some of them may also fit with a J(J+1) law. However, the statistical significance of the fit in this case is not so good and we will not discuss them further.
The appearance in table 2a of both integer and half-integer spins at low -ray energies indicates that bands in both even and odd nuclei were formed.§§§It should be mentioned that identical bands in neighboring nuclei are known [17]. (At high energies the observed transitions are probably sum events. See the following paragraphs.) 207Rn, produced via pn evaporation, and its daughters, are, from the kinematic point of view, the best candidates for the half-integer transitions. The 8.42 MeV -particle in coincidence with a photon of 67.1 keV (seen in fig. 5 and table 3 below), which fits with Kα1 X-ray of Pt (known energy 66.832 keV), may indicate that the -transition is from 195Hg to 191Pt. 195Hg is the daughter after 3 -particle decays from 207Rn.
It should be mentioned that the high energy -rays (above about 120 keV, table 2) are most probably sum events rather than photo-peak events. If, for instance, the three coincidence events in fig. 6 at Eγ of 247.0 (2 events) and 225.3 keV are photo-peak events, then 9.55.5 Compton events below 120 keV (the position of the Compton edge) should have been seen in coincidence with -particles of 8.55-8.61 MeV, but only one event is seen. Similarly if the -rays which are in coincidence with 6-7 MeV -particles, seen in the same figure and mentioned above, are photo-peak events, then 7.6 Compton events should have been seen in this -energy range at Eγ 120 keV, while only one event is seen. On the other hand, for a de-excitation of a superdeformed band with J = 1, a measured energy which fits a transition between high-spins, may be due to many sum combinations of lower energy transitions between lower spins, for which low-energy Compton events should not be observed. For instance, an energy of 225.4 keV which fits a 51/2 49/2 transition (assuming Ex = 4.42J (J+1) keV, table 2) may be due to one of 17 different combinations of 3-fold events, if only the first 14 levels of the band up to maximum spin of 27/2, and maximum transition energy of 119.3 keV are considered, for which the photo-peak to total ratio is 100%. (119.3 (27/2 25/2) + 92.8 (21/2 19/2) + 13.3 (3/2 1/2) = 225.4, or 84.0 (19/2 17/2) + 75.1 (17/2 15/2) + 66.3 (15/2 13/2) = 225.4 are two examples out of these 17 possible combinations). Because of the large solid angle of the -detector (0.16) and the large number of possible 3-fold combinations, the probability P3 to see a 3-fold event is larger than the probability P1 to see a 1-fold event. (These probabilities for the above example are: P1 = ’(1-)(N-1) = 0.042(1-0.16)24 = 6.4 x 10⁻⁴, and P3 = n33(1-)N-3 = 17x0.163(1-0.16)10 = 1.2x10⁻², about 20 times larger. ’ is the photo-peak efficiency of the detector for the particular energy, is the geometrical efficiency, N is the number of transitions in the band counting from the level to which the -particle is decaying, and n3 is the number of 3-fold combinations).
Many combinations of 2- or 4- fold events of a half-integer spin band will give energies which fit with those of a band of an integer spin. For instance, the two events at 247.0 keV (table 2) which fit in energy to a 28 27 transition, and the 186.5 keV event which fits with a 21 20 transition, may be due to such combinations, since the -particle energy is the same as that of the half-integer transitions of 225.3 and 171.8 keV, and therefore they presumably belong to the same band. (In an integer-spin band of J = 1 various combinations of 2-, 3- and 4-fold events of low energy transitions have large efficiencies and give energies which fit with those of transitions between higher spins. This property, both for half-integer and integer spin bands, does not exist for J = 2 transitions).
As shown above the detection of sum events which are energetically degenerate with the diagram line leads to a substantially increased effective detection efficiency (dependent, however, on the maximum available spin) for this energy. The minimum spin which is consistent with the data is 19/2. The largest efficiency of the detector (which corresponds to the smallest production cross section), taking into account 2- and 4-fold sum events of transitions between half-integer spins in order to get the 247.0 keV transition, is obtained with a spin of 35/2. The lower limit for the production cross section estimated from Irradiation II and taking into account the detector efficiency for various possible combinations of sum events, as described above, is about 130 nb (table 1).¶¶¶Previously [15, 16], it was assumed that the 247.0 (2 events), 225.3 (2 events) and 191.7 keV events, which are in coincidence with 8-9 MeV -particles, are photo-peak events due to known transitions in 195Hg and 197Tl. However, in this case 12.66.3 Compton events below 120 keV should have been seen in Fig. 6 in coincidence with -particles of 8.55-8.62 MeV, but only one event is seen. ∥∥∥In principle one may think that the observed -energies are Compton events due to higher energy -rays. But then the probability [8] to have two events in the same position (within the energy resolution) is only a few percent, and this occurred twice, at 247.0 (fig. 6) and 225.3 keV (figs. 5 and 6).
As shown above, the observation in table 2 of gamma rays which fit in energies with transitions between high spin SDB states is consistent with various sums of gamma rays due to transitions between lower spin states with J = 1. Since the intensity of the characteristic X-rays seen in figs. 5 and 6 in coincidence with 8-9 and 6-7 MeV -particles is very low, the observed -rays should be due to E1 transitions, with quite low conversion factors, rather than M1 ones. Such transitions have been seen before [8] and were predicted for SD wells in nuclei around Z = 86 and N = 116 [18, 19, 20].
C Coincidences between -Particles and Characteristic X-Rays and Identified -Rays
In order to identify some of the coincidence events seen in figs. 5, 6, and 9 at lower particle energies below 6 MeV, we first looked on groups of events. The existence of groups of 3 or 2 coincidence events in clean regions indicates that they are probably not background. Secondly, one looks on their accurately measured photon energies. At low energies the observed photon may be either an X-ray or a -ray. The energies of the characteristic X-rays of the elements are known very well [23]. The Kα1 X-rays of the various elements of the evaporation residue nuclei and their daughters are separated one from another by about 2 keV, where the value of a Kα1-line of an element with Z protons is about the same as the value of the Kα2-line of an element with Z+1 protons. If the measured energy turns out to be very close to a known X-ray energy, then it is reasonable to assume that the observed photon is an X-ray rather then a -ray. (In the cases found by us and discussed below the deviations from the known values are from 0.03 to 0.28 keV, while the width of one channel in the -spectrum is about 0.24 keV and the FWHM is about four channels). The X-ray may be emitted if the -particle is decaying to an excited state which decays by conversion electrons. Such a process is followed by emitting characteristic X-rays of the daughter nucleus. The Z-value of the daughter is thus determined. In order to determine its A-value we tried to identify the -rays which are in coincidence with -particles of about the same energy. A consistency is obtained when the -ray fit in energy with the measured value, belongs to an isotope of the determined element, and it is consistent with known or expected values of the conversion factors, and also with the decay scheme.
In several cases, as seen below, some of the observed events have been identified as due to characteristic X-rays (the events surrounded with squares in figs. 5, 6 and 9) and as known -transitions in various nuclei (the events surrounded with triangles in figs. 5, 6 and 9). In fig. 6 two coincidences between about 5.50 MeV -particles and 61.1 and 59.4 keV photons are seen, and fit with Kα1 and Kα2 X-rays of Re of 61.140 and 59.718 keV. At about the same -energy two 144.0 keV events are observed and can be identified with a known transition in 186Re. This identification is supported by the observation in fig. 5, in the same -energy range, of coincidence events with respective 59.7 keV and 140 keV X- and -rays. The first fits with Kα2 of Re, and the second with a transition in 186Re, which precedes the above 144.0 keV transition. A coincidence between 5.45 MeV -particles and 59.4 or 59.7 keV photons may in principle be also due to the known decay of 241Am of 5.486 MeV and 59.54 keV . However, we did not use and never had in our laboratory a 241Am calibration source. Under these circumstances the observation of the 61.1 keV photon, which fits very nicely with Kα1 of Re, and which is very far off (1.56 keV) from the -rays of 241Am, and of the two consecutive -rays of 186Re, suggests that the two events at about 59.6 keV are due to Kα2 of Re and not due to 241Am. A 59.6 keV X-ray may in principle be also due to Kα1 of W of 59.3182 keV. Here also the observation of the other X-rays and -rays suggest that it is Kα2 of Re rather than Kα1 of W. Out of total number of 3 X-rays, one is expecting to see 1.9 Kα1 events and 1.1 Kα2 events. The observation of 1 event in the first case and 2 in the second, is well within the statistical error.
In fig. 9, for -particles between 5.18 and 5.53 MeV, groups of two and three events with photon energies of 66.8 keV and 59.6 keV, respectively, are seen. They may correspond to the known Kα1 X-rays of Pt of 66.832 keV and of W of 59.318 keV of W. At the same corresponding -energies known -rays of 189Pt and 183W are observed. Here the three 59.6 keV events are more likely to be due to Kα1 of W, rather than Kα2 of Re. If they were Kα2 of Re then 5.2 events of Kα1 at 61.140 keV are expected. The observation of zero events when 5 are expected is unlikely. On the other hand, if the 3 observed events are Kα1 X-rays of W, then 1.7 events of Kα2 of W at 57.98 keV are expected. The observation of zero events when 1.7 are expected is well within the statistical errors.
As mentioned above and seen in table 3, about the same -energy corresponds to two different decays. One leads to 186Re and was obtained in the ELab = 125 MeV experiment, and the other presumably leads to 183W and was obtained in the ELab = 135 MeV experiment. As seen below (section IVA), these data are interpreted as due to transitions from the second well of the potential in the parent nuclei to the normal states in the daughters. There is nothing against having about the same -particle energy in two different transitions. Because of the low statistics we consider the identifications mentioned above as tentative only, where the identification of 186Re is better than of the other.
The results are summarized in table 3 together with possible reaction channels and corresponding decay chains which lead to the observed transitions. The deduced production cross sections (with an accuracy of about a factor of 2) are given in table 1, columns 3 and 5. In general lower limits were deduced since the branching ratios along the decay chains are not known.
Some coincidence events between 6.17 – 9.01 MeV -particles and identified X-rays with no corresponding -rays were seen. They are also given in table 3.
D Evidence for Proton Radioactivity
A very well defined coincidence group of three events is seen in fig. 9 at an average particle energy of 3.88 MeV and -energy of 185.8 keV. Because of the low energy of the particles and the very narrow total width of 40 keV, one may conclude that the particles are protons. (The total estimated widths at this energy are 55 keV for protons and 630 keV for -particles. The estimated half-life for 3.88 MeV -particles decaying to, for instance, 194Hg is about 1x10⁸ y [7]). The 185.8 keV -rays fit with a known transition in 204Rn (table 3). The production cross section of this group is given in table 1.
IV Discussion
A Transitions from Superdeformed to Normal States
The Eα values for the g.s. to g.s. transitions for 190Ir 186Re; 187Os 183W and 193Hg 189Pt mentioned in table 3 are 2.74, 2.662 and 2.927 MeV [22], respectively. The corresponding observed -energies of 5.43, 5.53 and 5.18 MeV (table 3) are clearly due to decay of isomeric states in the parent nuclei. The estimated half-lives for normal -particles of these energies [7] are 2.9x10³; 3.5x10² and 1.2x10⁶ s. The observed lifetimes of several months, which may be due to combined lifetimes along the long decay chains, are retarded by 3 and 4 orders of magnitude in the first and second case, respectively.
From the above mentioned measured -energies the lower limits for the excitation energies of the isomeric states in the parent nuclei 190Ir, 187Os and 193Hg (see table 3) are deduced to be 3.1; 3.0 and 4.5 MeV, respectively. (Lower limits are deduced since the -decay may proceed through a higher excitation energy than the one seen experimentally). Extrapolated and interpolated predicted energies [10, 11] for the second minima of 4.1 [10] or 4.2 [11]; 3.4 [10] or 3.6 [11]; and 4.2 [10] or 4.6 [11] MeV, respectively, are also given in table 3. The observed energies of the isomeric states and the predicted positions of the second minima seem to be in the same range of excitation energies. This suggests that the isomeric states in these cases are in the second well of the potential, and that the transitions are from the superdeformed well in the parent nuclei to less deformed or normal states in the daughters. These are the last transitions after several decays, presumably from isomeric state to isomeric state, all within the second wells along the decay chain. For instance, 190Ir in the isomeric state may be produced after 6 decays, 4 and 2+ or EC decays, all from superdeformed to superdeformed states (see table 3).******More complicated situations where the evaporation residue nucleus is produced in the third (hyperdeformed) well of the potential, and then decays to the second well by -particle or even by proton emission, is in principle not impossible. Since the last step of the chain is a decay to a relatively high spin state, it seems that the originally produced isomeric state in the evaporation residue nucleus has high spin, and that the transitions from mothers to daughters along the decay chain are between high spin states.
B Transitions from Superdeformed to Superdeformed States?
We now discuss the three coincidence events seen in fig. 6 and mentioned above (Secion III.B. and table 2b) of 6.16 MeV – 176.1 keV; 6.94 MeV – 207.4 keV and 6.41 – 242.3 keV. These events appeared 96, 68 and 78 days respectively, after the end of irradiation, and their lifetimes therefore are of the order of several months. As shown above, the energies of the first two -rays fit very nicely with SDB transitions between half-integer spins, where the most probable candidates are 207Rn, produced by the pn evaporation process, and its daughters. The coincidence event of a 6.17 MeV -particle with 79.1 keV photon (fig. 5 and table 3) which fits with Po Kα1 X-rays of 79.290 keV, suggests that the transitions mentioned above with 6 – 7 MeV -particles might be from isomeric state(s) in 207Rn to the SDB states in the second well of the potential in 203Po. (The half-life of the ground state of 207Rn is 9.3 m). The measured -particle energies are in the predicted range for the transition from the second minimum in 207Rn to the second minimum in 203Po of 6.2 [10] or 6.9 [11] MeV.
Similarly the energies of 7.16 MeV (fig. 6; ELab = 125 MeV) and 7.05 MeV (fig. 9; ELab = 135 MeV) -particles in coincidence with Lβ1(At) (see table 3) may correspond to the predicted -particle transitions between the second minima of 206Frs.m. and 202Ats.m. (3n reaction) of 6.9 [10] or 7.3 [11] MeV, and of 205Frs.m. to 201Ats.m. (4n reaction) of 7.0 [10] and 7.2 [11] MeV, respectively.
In both cases discussed in the present subsection (IV.B.), while the -energies are consistent with this picture, the very long lifetime may indicate that the internal structure of the parent isomeric states and the final rotational SDB states are different.
C Proton Transition from a Superdeformed to a Normal State?
For the 3.88 proton group (Section III.D. above), if the identification given in table 3 is correct, the excitation energy of the isomeric state in 205Fr is 6.7 MeV (see table 3). This is quite high as compared to 3.9 [10] or 5.0 [11] MeV predicted for the second minimum, and may indicate that the origin of the isomeric state in this case is different.
D Hyperdeformed to Superdeformed Transitions
The most striking result is the -particle group around 8.6 MeV which was found in coincidence with SDB transitions (figs. 5, 6, 7, 8, and table 2a). As mentioned above the appearance of -transitions between half-integer spins shows that most of these transitions are in an odd A nucleus, where 207Rn and its daughters are most probable candidates from the reaction kinematic point of view.††††††As shown in Section III.B. above, the high energy integer spin transitions of 247.0 and 186.5 keV (table 2a) are presumably due to sum combinations of half-integer transitions as well. The observation of a coincidence event between a 8.42 MeV -particle (which is, within the experimental spread for -particles, consistent with 8.6 MeV for 200 g/cm2 C catcher foil) and a Kα1 X-ray of Pt (fig. 5 and table 3) indicates that the transition may be from 195Hg (produced after 3 -decays from 207Rn) to 191Pt. However, transitions from other Hg isotopes produced by fewer -decays, which are followed by several + or EC decays cannot be excluded.
The predicted [7] half-life for normal 8.6 MeV -particles is below 1 s. Therefore in principle the -rays of the SDB transitions may either precede or follow the 8.6 MeV -particles.‡‡‡‡‡‡In all the cases discussed above the first possibility is excluded since the lifetime of the -particles is always much longer than 1s, and they could not be detected in coincidence with -rays which precede them. In the case where the -rays come first, the -particles are due to either a transition from the second minimum in the parent nucleus to the second minimum in the daughter, or from the second minimum in the parent to normal states in the daughter. However in the first case the energy of 8.6 MeV is much larger than the predicted 3.3 MeV in 195Hgs.m. 191Pts.m. transition [10, 11], and 6.3 [10] or 6.9[11] in 207Rns.m. 203Pos.m. transition. On the other hand in the second case of an -transition from the second minimum to normal states, the -particle lifetime will most probably be retarded, and the 8.6 MeV -particles will not be in coincidence within 1 s with the SDB transitions. (Furthermore, the predicted transition energy from the second minimum to the ground state in 195Hgs.m. 191Ptg.s. is about 7.2 MeV [10, 11] and in 207Rns.m. 203Pog.s. is 6.3 [10] or 6.9 MeV [11]. These values are also not in accord with the experimental value of 8.6 MeV).
It is therefore reasonable to assume that the 8.6 MeV -particles decay first and then are followed by the SDB -rays, similar to the situation in all the other cases discussed above. Let us first consider the case where the isomeric state is in the second well of the parent nucleus which decays by the 8.6 MeV -particles to the SDB in the daughter. One faces here two problems, namely the very large hindrance factor of the -particles, and their high energy. The hindrance factor of the -particles is in the range of 1016 (t1/2 40 d as compared to the predicted value of 1.4 x 10⁻¹⁰ s assuming 2 = 0.7 [8]). As for the energy, if, for instance, the 8.6 MeV -particles decay to a SDB state of spin 27/2 in 191Pt at Ex = 865 keV (E0 = 4.42 keV), and taking into account the predicted excitation energy of the second minimum in 191Pt at about 4.1 MeV [10, 11], and the Qα(g.s.g.s.) value for 195Hg of 2.190 MeV [22], the isomeric state in 195Hg turns out to be at about 11.6 MeV above the g.s. Assuming an excitation energy of the second minimum in 195Hg of about 5.2 MeV [10, 11], the above energy of 11.6 MeV corresponds to an excitation energy of about 6.4 MeV above the second minimum, which seems unlikely. (In the same way, about 5.0 and 3.0 MeV excitation energies above the second minimum are respectively deduced for more neutron-rich Hg isotopes and for 207Rn, which is unlikely as well.)
It seems reasonable to conclude that the large hindrance factor might be due to another barrier transition, as, for instance, from the third well (the hyper-deformed well) [24, 25, 26] to the second one.******It should also be mentioned that a superdeformed minimum on the oblate side, which might decay to the prolate superdeformed minimum via triaxial shapes, has been predicted in 236Cm at = –0.63 and Ex = 8.2 MeV, using Hartree-Fock calculations [27]. It should be mentioned that an extrapolated value of about 11.5 MeV is obtained for the excitation energy of the third minimum in 195Hg from the predictions of Ref. [25]. This value is in accord with the deduced value mentioned above of about 11.6 MeV.*†*†*†The retardation of the -events of 6-7 MeV discussed in section IV.B. above is unlikely to be due to transitions from the third minimum, as its predicted excitation energy of about 18.8 MeV (extrapolated from Ref.[26]) comes out far from the data of 7.8 or 10.3 MeV (table 3). The large production cross section of the isomeric state which decays by the 8.6 MeV -particles of about 130 nb, as compared to the production of the isomeric states in the second minima of a few nb (see table 1), may also indicate that its origin is from the third minimum, which can presumably be produced more easily at bombarding energies below the Coulomb barrier.
It is also seen in table 1 that while the highest cross section for the production of the normal evaporation residue nuclei is about a factor of 60 larger at 135 MeV as compared to 125 MeV, the production of the isomeric states in the second minima is about the same at these two bombarding energies, whereas there is an exceptionally large cross section at 125 MeV for the 8.6 MeV -particle group which is in coincidence with the SDB transitions.
V Summary
In summary, evidence for long-lived isomeric states with lifetimes of up to several months, with abnormal decay properties, was obtained. Relatively high energy -particles of 5.1-5.5 MeV were tentatively found in the usually non--emitting nuclei, 187Os, 190Ir and 193Hg, and interpreted as due to transitions from the second well of the potential in the parent nuclei to less deformed or normal states in the daughters. The observed transitions are the last in long chains of up to 6 steps of -particle and or EC transitions, presumably within the second well itself.
Long-lived 6 – 7 MeV -particles, in coincidence with SDB -rays, were found with energies consistent with transitions from the second minimum in the parent nucleus to the second minimum in the daughter. The reason for their long lifetimes though is not clear.
A 3.88 MeV long-lived proton group was found. Its state of origin is not entirely clear.
By far the most exciting observation is the very high energy and strongly retarded (t1/2 40 d) 8.6 MeV -particle group in coincidence with SDB transitions, which is interpreted as due to a long-lived isomeric state in 195Hg at Ex 11.6 MeV, and is consistent with a transition from the third (hyperdeformed) well of the parent nucleus to the second (superdeformed) well in the daughter.
The production cross sections of the isomeric states in the second well were about the same at ELab = 125 (10% below the barrier) and at ELab = 135 MeV, while on the average a factor of 15 – 60 larger cross section was found for the 8.6 MeV group at 125 MeV.
The existence of such long-lived isomeric states, with lifetimes much longer than those of their corresponding ground states, and with preferential production cross sections at relatively low bombarding energies, may add new considerations regarding the stability and the production mechanism of heavy and superheavy elements [3, 28, 29, 30]. In particular it should be mentioned that the extra-push energies needed for the production of such nuclei in their superdeformed and hyperdeformed wells are much smaller than expected for producing them in their normal states [31].
VI Acknowledgements
We acknowledge the support of the accelerator crew of the Weizmann Institute at Rehovot, and the technical assistance of S. Gorni, O. Skala and the electronic team of the Racah Institute. D.K. acknowledges the financial support of the DFG. We are grateful to N. Zeldes and J. L. Weil for very valuable discussions.
REFERENCES
- [1] A. Marinov, S. Eshhar and D. Kolb, Phys. Lett. B191, 36 (1987).
- [2] A. Marinov, S. Eshhar and J. L. Weil, Proc. Inter. Symp. on Superheavy Elements, Lubbock, Texas, 1978, edited by M. H. K. Lodhi (Pergamon, New York, 1978), p. 72.
- [3] A. Marinov, C. J. Batty, A. I. Kilvington, G. W. A. Newton, V. J. Robinson and J. D. Hemingway, Nature 229, 464 (1971).
- [4] A. Marinov, S. Eshhar and D. Kolb, Fizika 19, Supplement 1, 67 (1987).
- [5] A. Marinov, 6th Adriatic Int. Conf. Nucl. Phys., Frontiers of Heavy-Ion Physics, 1987 Eds. N. Cindro, W. Greiner and R. Ćaplan, (World Scientific 1987), p. 179.
- [6] A. Marinov, S. Gelberg, and D. Kolb, Int. Symp. on Exotic Nuclear States, Debrecen, Hungary, 1997, Eds. Zs. Dombrádi, Z. Gásci and A. Krasznahorkay (akadémiai Kiadó, Budapest, APH N.S., Heavy Ion Physics 7, 47 (1998).
- [7] V. E. Viola Jr. and G. T. Seaborg, J. Inorg. Nucl. Chem. 28, 741 (1966).
- [8] A. Marinov, S. Gelberg and D. Kolb, Mod. Phys. Lett. A11, 861 (1996).
- [9] A. Marinov, S. Gelberg and D. Kolb, Mod. Phys. Lett. A11, 949 (1996).
- [10] W. Satula, S. Ćwiok, W. Nazarewicz, R. Wyss and A. Johnson, Nucl. Phys. A529, 289 (1991).
- [11] S. J. Krieger, P. Bonche, M. S. Weiss, J. Meyer, H. Flocard and P.-H. Heenen, Nucl. Phys. A542, 43 (1992).
- [12] S. G. Nilsson, G. Ohlén, C. Gustafson and P. Möller, Phys. Lett. 30B, 437 (1969).
- [13] J. Fernández-Neillo, C. H. Dasso and S. Landowne, Code CCDEF, Comp. Phys. Comm. 54, 409 (1985).
- [14] S. Raman, C. H. Malarkey, W. T. Milner, C. W. Nestor, Jr. and P. H. Stelson, ADNDT 36, 1 (1987).
- [15] A. Marinov, S. Gelberg and D. Kolb, Physics of Unstable Nuclear Beams, São Paulo, Brazil, 1996, Eds. C. A. Bertulani, L. F. Canto and M. S. Hussein, (World Scientific, 1996), p. 181.
- [16] A. Marinov, S. Gelberg and D. Kolb, , Dubna, Russia,1997, Eds. Yu. Ts. Oganessian R. Kalpakchieva World Scientific, 1998, p. 437.
- [17] F. S. Stephens et al., Phys. Rev. Lett. 65, 301 (1990).
- [18] S. berg, Nucl. Phys. A520, 35c (1990).
- [19] J. Höller, and S. berg, Z. Phys. A336, 363 (1990).
- [20] W. Nazarewicz, P. Olanders, I. Ragnarsson, J. Dudek and G. A. Leander, Phys. Rev. Lett. 52, 1272 (1984).
- [21] K.-H. Schmidt, C.-C. Sahm, K. Pielenz and H.-G. Clerc, Z. Phys. A316, 19 (1984).
- [22] G. Audi, O. Bersillon, J. Blachot and A. H. Wapstra, Nucl. Phys. A624, 1 (1997).
- [23] R. B. Firestone, V. S. Shirley, C. M. Baglin, S. Y. F. Chu and J. Ziplin, Table of Isotopes, John Wiley and Sons, 1996.
- [24] W. M. Howard and P. Möller, ADNDT 25, 219 (1980).
- [25] W. Nazarewicz, Phys. Lett. B 305, 195 (1993).
- [26] S. Ćwiok, W. Nazarewicz, J. X. Saladin, W. Plóciennik and A. Johnson, Phys. Lett. B 322, 304 (1994).
- [27] D. Kolb and A. Marinov, Proc. Int. Conf. Nucl. Phys., Florence, Vol. 1, p. 92 (1983).
- [28] A. Marinov, S. Eshhar, J. L. Weil and D. Kolb, Phys. Rev. Lett. 52, 2209 (1984); 53, 1120(E) (1984).
- [29] A. Marinov, S. Gelberg and D. Kolb, in 6th Int. Conf. on Nuclei Far from Stability and 9th Int. Conf. on Atomic Masses and Fundamental Constants, Bernkastel-Kues, Germany, Inst. Phys. Conf. Ser. No. 132, p. 437 (1992).
- [30] K. Kumar, Superheavy Elements, Adam Hilger, Bristol and New York, 1989.
- [31] J. P. Blocki, H. Feldmeier and W. J. Swiatecki, Nucl. Phys. A459, 145 (1986).
| Reaction | g.s.(b) | i.s.(nb) | g.s.(b) | i.s.(nb) |
|---|---|---|---|---|
| 125 MeV | 125 MeV | 135 MeV | 135 MeV | |
| 3n | a | b | ||
| p2n | 4.5 | b | ||
| 4n | 274 | d | ||
| p3n | 101 | a | ||
| 5n | c | |||
| p4n | c | |||
| 2n | a | |||
| pn | a |
a Lower limit is given since the branching ratios
along the decay chain (table 3) are not known.
b It was
impossible to distinguish between the 3n and the p2n reactions.
The value given was deduced assuming that the relevant observed
activity is due to this reaction channel only.
c It was
impossible to distinguish between the 5n and the p4n reactions.
The value given was deduced assuming that the relevant observed
activity is due to this reaction channel only.
d Based on
the coincidence group of the 3.88 MeV protons with 185.8 keV
-rays and assuming that the -rays are from
204Rn (see text).
| Eα | Eγ(expt.)a | Eγ(cal.) | E | Transitionb |
| (MeV) | (keV) | (keV) | (keV) | |
| a) Eα = 7.8 - 8.6 MeV; Ex = 4.42 x J(J+1) keV | ||||
| 7.81 | 25.9 | 26.5 | –0.6 | 32 |
| 8.52 | 40.1 | 39.8 | +0.3 | 9/27/2 |
| 8.21 | 52.9 | 53.0 | –0.1 | 65 |
| 8.53c | 97.9c | 97.2 | +0.7 | 1110 |
| 8.19 | 118.4 | 119.3 | –0.9 | 27/225/2 |
| 7.88 | 123.4 | 123.8 | –0.4 | 1413 |
| 8.37 | 141.3 | 141.4 | –0.1 | 1615 |
| 7.99 | 145.6 | 145.9 | –0.3 | 33/231/2 |
| 8.51 | 171.8 | 172.4 | –0.6 | 39/237/2 |
| 8.60 | 186.5 | 185.6 | +0.9 | 2120 |
| 8.07 | 212.9 | 212.2 | +0.7 | 2423 |
| 8.59d | 225.3d | 225.4 | –0.1 | 51/249/2 |
| 8.61e | 247.0e | 247.5 | –0.5 | 2827 |
| b) Eα = 6.0 - 7.0 MeV; Ex = 4.41 x J(J+1) keV | ||||
| 6.16 | 176.1 | 176.4 | -0.3 | 2019 |
| 6.94 | 207.4 | 207.3 | +0.1 | 47/245/2 |
| 6.41 | 242.3 | 242.6 | -0.3 | 55/253/2 |
a The peak to total ratio was 100% up to about
120 keV and
reduced
gradually to 22% at 250 keV.
b The transitions between
the maximum possible spins are given.
At relatively high energies the observed -rays are most probably sum
events due to various combinations of lower energy transitions in
the band which, because of the J(J+1) law, fit in energy to
calculated transitions between higher energies. (see text).
c Average of 2 events: 8.47 MeV in coincidence with
97.4 keV in the first measurement and 8.58 MeV
in coincidence with 98.3 keV in the second measurement.
d Average of 2 events: 8.61 MeV in coincidence
with 224.9 keV in the first measurement and 8.57 MeV
in coincidence with 225.7 keV in the second
measurement.
e Average of 2 events in the second
measurement of 8.62 MeV in coincidence with 246.5 keV
and 8.60 MeV in coincidence with 247.5 keV
.
| Eγ(Meas. No.) | Eα,p | Isotope | Transition | Reaction | E(AZ) | E |
|---|---|---|---|---|---|---|
| keV | MeV | Decay | MeV | MeV | ||
| Time/da | Chain | S; K | ||||
| 61.1(II) | 5.48 | Kα1(Re) | ||||
| 31.1 | ||||||
| 59.6(x2)(I; II) | 5.45 | Kα2(Re) | ||||
| 7.4; 107.2 | ||||||
| 144.0(x2)(II) | 5.43 | 186Re | 330(?)b186 | 3n | 3.1(190Ir) | 4.1d; 4.2d |
| 60.2; 88.8 | (5+)(6)- | 4, | ||||
| E1; 100% | 2+(EC)c | |||||
| 141.0(I) | 5.29 | 186Re | 471(?)b330(?)b | 3n | 3.2(190Ir) | 4.1d; 4.2d |
| 130.2 | (4+)(5+) | 4, | ||||
| M1+E2 | 2+(EC)c | |||||
| 66.8(x2)(III) | 5.18 | Kα1(Pt) | ||||
| 13.9; 58.6 | ||||||
| 236.2(III) | 5.12 | 189Pt | 2291.82056.1 | p3n; 4n | 4.53 (193Hg) | 4.2e; 4.6e |
| 139.5 | (+)(-) | |||||
| (E1) | — ; +(EC)c | |||||
| 59.6(x3)(III) | 5.53 | Kα1(W) | ||||
| t1/2 = 90 | ||||||
| 210.3(III) | 5.43 | 183W | 308.999.1 | 2n | 3.04(187Os) | 3.4d; 3.6d |
| 168.4 | -- | |||||
| E2; 100% | +(EC)c | |||||
| 70.9(II) | 9.01 | K(Hg) | ||||
| 89.7 | ||||||
| 67.1(I) | 8.42 | K(Pt) | ||||
| 81.7 | ||||||
| 79.1(I) | 6.17 | K(Po) | ||||
| 133.5 | ||||||
| 13.9(II) | 7.16 | L(At) | ||||
| 64.6 | ||||||
| 13.9(III) | 7.05 | L(At) | ||||
| 127.8 | ||||||
| 185.8(x3)(III) | 3.88(p) | 204Rn | 2219.02032.8f | 4n | 6.7(205Fr) | 3.9e; 5.0e |
| t1/2 = 120 | (9-)(8+) | – | ||||
| E1; 55% | ||||||
| SDB(II)g | 6 - 7 | 203Po | SDB | pn | 7.8h;10.3i(207Rn) | 6.8d; 9.9e |
| t1/2 = 53 | table 2(b) | — | ||||
| SDB(I; II)j | 8.6 | 191Ptk | SDB | pn | 11.6(195Hg)k | 11.5(IIImin)l |
| t 40 | table 2(a) | 3 |
a For a group of three events the half-lives as
estimated according to the formulas of K.-H. Schmidt et al. [21]
are given.
b The excitation energy in 186Re is not
certain [23].
c The order of the decay is not known.
d Extrapolated value.
e Interpolated value.
f
The identification given in the table is not certain as explained
in the text.
g See text and table 2(b) for the
-eneries of this band.
h Estimated excitation
energy in 207Rn assuming Eα=6.5 MeV, a predicted
Ex of the second minimum in 203Po of 6.6 MeV [10], and
decay to a SDB state with a spin of 27/2 at excitation energy
above the second minimum of 863 keV.
i As comment (h) above
except that Ex of the second minimum in 203Po was taken
at 9.1 MeV as predicted in Ref. [11].
j See table 2(a) for
the -energies of this band.
k See text.
l
Extrapolated value for the excitation energy of the third minimum
from Ref. [25] is given.