On-Off Intermittency in Time Series of Spontaneous Paroxysmal Activity
in Rats with Genetic Absence Epilepsy
Abstract
In the present paper we report on the on-off intermittency phenomena observed in time series of spontaneous paroxysmal activity in rats with genetic absence epilepsy. The method to register and analyze the electroencephalogram with the help of continuous wavelet transform is also suggested.
pacs:
05.45.-a, 05.45.Gg, 52.35.-g, 52.35.MwDynamic behavior of complex neuronal ensembles is a topic comprising a streamline of current researches worldwide. In this article we study the behavior manifested by epileptic brain, in the case of spontaneous non-convulsive paroxysmal activity. For this purpose we analyzed archived long-term recording of paroxysmal activity in animals genetically susceptible to absence epilepsy, namely WAG/Rij rats. We first report that the brain activity alternated between normal states and epilepsy paroxysms is the on-off intermittency phenomenon which has been observed and studied earlier in the different nonlinear systems.
I Introduction
Dynamic behavior of complex neuronal ensembles is a topic comprising a streamline of current researches worldwide. Brain considered as a composition of neuronal ensemble is a challenging subject for nonlinear dynamics. Revelation of intrinsic dynamic regularities of brain, under normal and pathological conditions, can shed more light upon origination and evolution of brain diseases Tass:2003_NeuroSynchro .
In computational neuroscience one can use theoretical approaches, based on models of single neurons Velarde:2002_NeuronModel , which can be further linked with each other Nekorkin:2000_Neuro . Lattices and chains of such elements, modeling particular brain regions and nuclei Kazantsev:2003_NeuronLattice , are the next advance in theoretical approximation of cunning brain anatomy. Moreover, the networks of nonlinear elements Chavez:2005_Networks_PRL ; Hwang:2005_Newtwork_PRL are also the interesting objects to be studied. Unambiguously, results obtained in computational neuroscience should be compared with facts yielded by experimental neuroscience.
Application of methods developed in modern nonlinear dynamics to experimental time series is an additional approach to understanding of brain functions Tass:1998_NeuroSynchro ; Rosenblum:2001_HandbookBiologicalPhysics ; Boccaletti:2005_Chaos_TSS . Particularly, estimation of functional interaction between brain regions by the means of quantification of a directionality and strength of functional coupling calculated from local field potentials (i.e., electroencephalogram, EEG) Smirnov:2005_CouplingDirection may be noted.
The present work was aimed to diagnose the type of dynamic behavior manifested by epileptic brain, in the case of spontaneous non-convulsive paroxysmal activity. For this purpose we analyzed archived long-term records of paroxysmal activity in animals genetically susceptible to absence epilepsy, namely WAG/Rij rats Luijtelaar:1986 . We report that this paroxysmal activity is on-off intermittency Platt:1993_intermittency ; Heagy:1994_intermittency ; Boccaletti:2000_IntermitLagSynchro .
II Methods
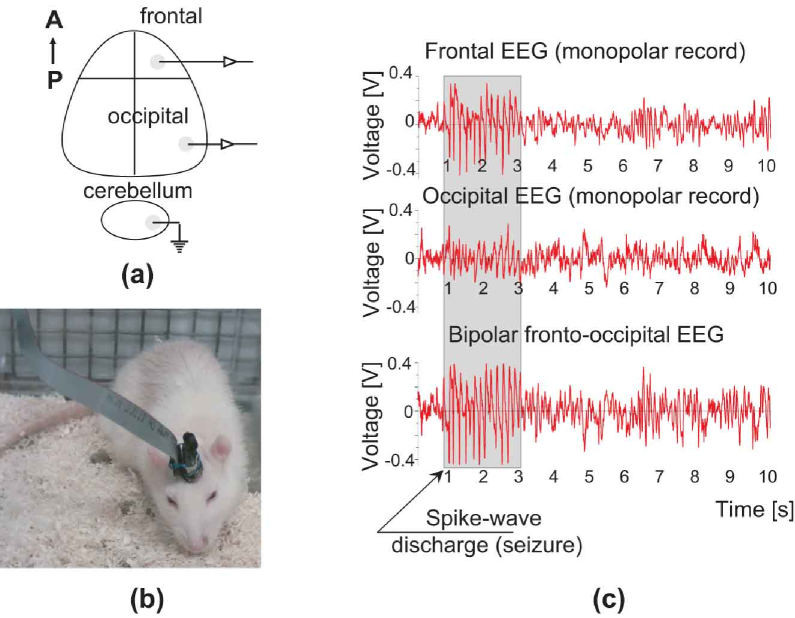
The animals (6 females, weighing 230–250 g, 5–6 months old and 5 males, weighing 250–300g, 5–6 months old) were chronically implanted with electrodes (stainless screws), let to post-surgery recovering and habituation to experimental camera (see 1, a). Paroxysmal activity was quantified from EEG registered in freely moving animals by means of automatic routine followed by an expert assessment as described elsewhere Luijtelaar:1986 . The duration of EEG registration varied from 6 hours up to 4 days. An example of EEG fragment containing background activity of low amplitude interspersed with absence paroxysms of relatively high voltage is given in Fig. 1, b. Absence paroxysms are manifested as generalized over the brain cortex synchronous spike-wave discharges (SWDs) with abrupt onset and ending Luijtelaar:1986 .
Together with the traditional approach mentioned above we have also used the continuous wavelet transform alkor:2003_WVTBookEng ; Daubechies:1992_WVTBook ; Kaiser:1994_Wvt ; Torresani:1995_WVT to select the fragments corresponding to the absence epilepsy paroxysms from recorded electroencephalograms because the continuous wavelet transform is the powerful tool for the analysis of nonlinear dynamical system behavior. In particular, the continuous wavelet analysis has been used for the detection of synchronization of chaotic oscillations in the brain Lachaux:2000_WVTSynchro ; Lachaux:2002_BrainCoherence ; Quyen:2001_WVTvsHilbert , cardiovascular human system Hramov:2006_Prosachivanie , chaotic laser array DeShazer:2001_WVT_LaserArray , etc. Continuous wavelet transform has also been used to study the time scale synchronization Hramov:2004_Chaos ; Aeh:2005_SpectralComponents ; Aeh:2005_TSS:PhysicaD . Since the fragments of electroencephalogram corresponding to the normal brain dynamics and absence epilepsy paroxysms seem to be quite different the continuous wavelet transform is the convenient mathematical tool for the different types of the brain activity to be distinguished.
Obviously, the brain activity alternated between normal states and epilepsy paroxysms may be considered as the intermittent behavior. Therefore, let us term the low-amplitude fragments of electroencephalogram (corresponding to the “normal” brain state) as the laminar phases and the high-amplitude fragments (corresponding to the absence epilepsy paroxysms) as the turbulent ones.
The core idea of the method of the division of time series into the laminar and turbulent phases by means of the continuous wavelet transform is the following. The continuous wavelet transform of chaotic time series is given by
| (1) |
where is the wavelet–function related to the mother–wavelet as
| (2) |
The time scale corresponds to the width of the wavelet function , and is shift of wavelet along the time axis, the symbol “” in (1) denotes complex conjugation. It should be noted that the time scale is usually used instead of the frequency of Fourier transformation and can be considered as the quantity inversed to it.
The Morlet–wavelet Grossman:1984_Morlet
| (3) |
has been used as a mother–wavelet function. The choice of parameter value provides the relation between the time scale of wavelet transform and frequency of Fourier transformation.
The wavelet surface
| (4) |
describes the system’s dynamics on every time scale at the moment of time . The value of indicates the presence and intensity of the time scale mode in the time series at the moment of time .
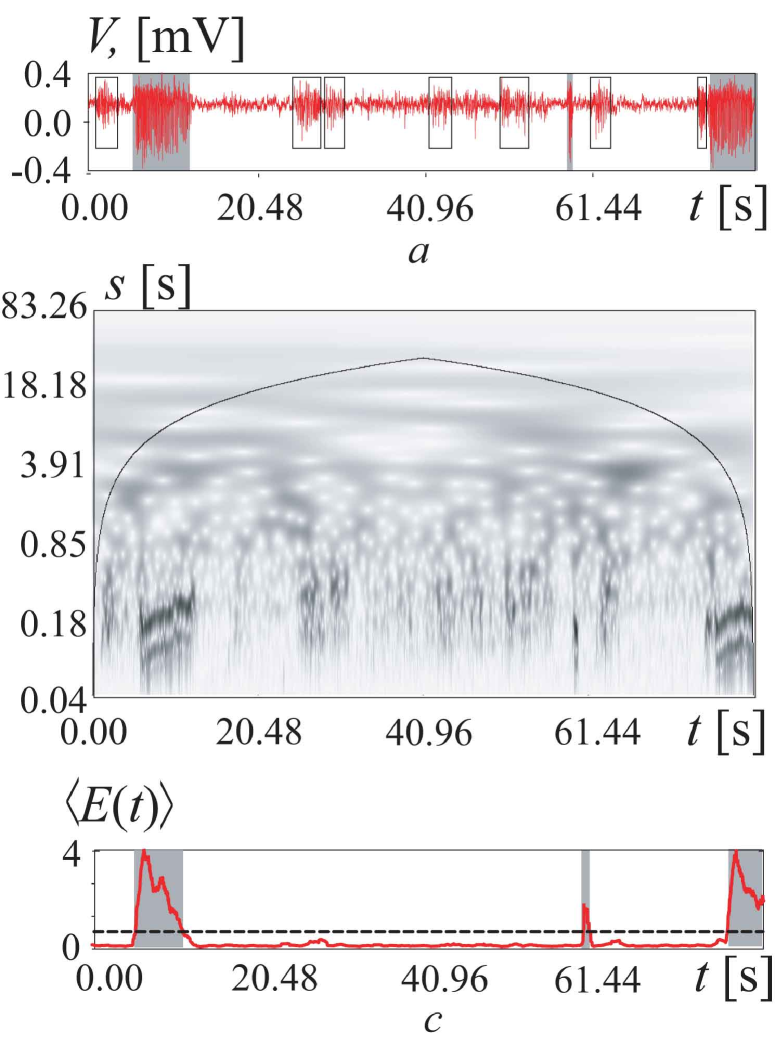
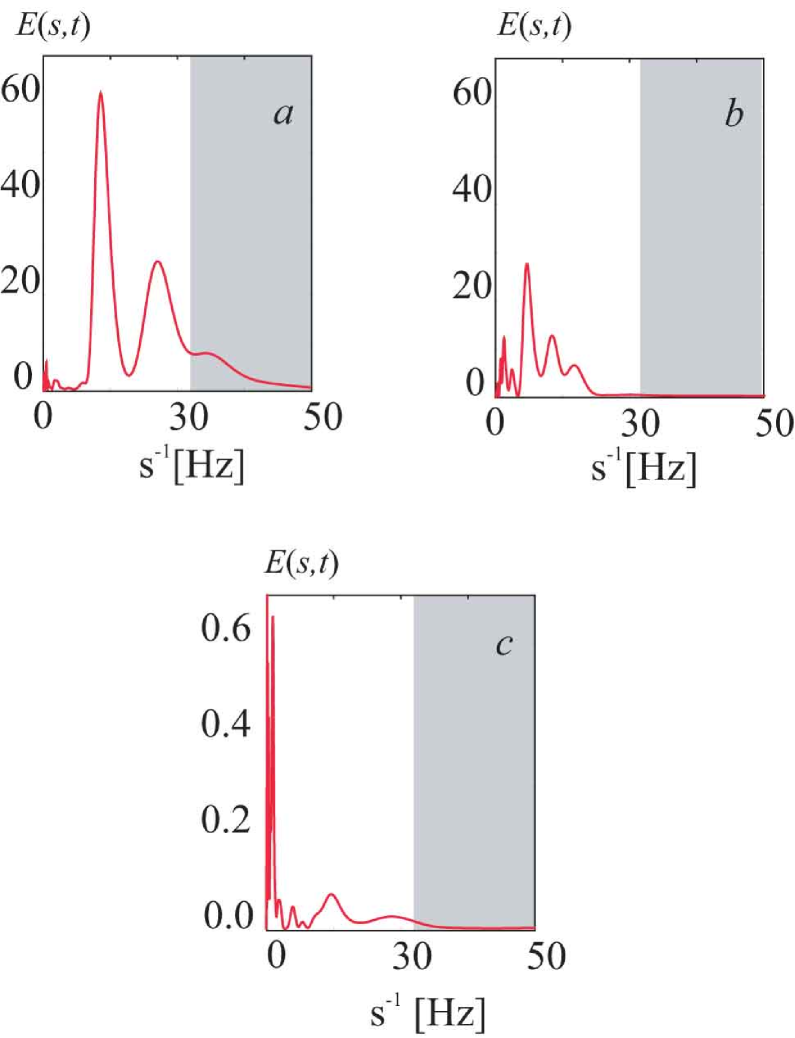
Fig. 2, a show the fragment of electroencephalogram consisting of the laminar phases alternated with turbulent ones (marked by gray rectangles) corresponding to the epilepsy paroxysms, allocated by a method of expert estimations. Fig. 2, b demonstrate the result of the calculation wavelet surface (4) for the fragment of electroencephalogram which shown in Fig. 2, a. As one can see in Fig. 2, b, wavelet surface structures in the field of turbulent and laminar phases are essentially different. Since the laminar and turbulent phases are characterized by the different distributions of the energy over time scales (Fig. 3) the instantaneous distribution of the energy of the wavelet spectrum averaged over the characteristic interval ( ms, ms) of the time scales
| (5) |
may be used as a criterion which allows distinction between different types of brain activity. Indeed, averaged energy of turbulent phases exceeded a certain threshold , while laminar phases did not reach this threshold level and is below . Therefore, we had a reliable threshold to extract laminar and turbulent phases (see Fig. 2, c). Duration of each phase was measured, and analysis was performed at the presence of the ordered correspondence between phases. More specifically, we studied distribution of laminar phases. Presence of intermittent behavior was detected with analysis of EEG time series.
III Results
Continuous wavelet transform of EEG was used to establish frontiers between normal and epileptic EEG. Hundredfold difference in wavelet spectral energy was sufficient for reliable identification periods of non-epileptic and epileptic EEG (see Section II and Fig. 2, a–c). In general, automation of EEG analysis allowed retrospective evaluation of expert assessments. It appeared that expert estimates were completely congruent to the outcomes of wavelet transform. Therefore, results of continuous wavelet transform analysis were convenient and we may recommend using this mathematical tool for others who needs to make a selection between such kinds of the EEG activity.
Transition between normal and paroxysmal brain activity (laminar and turbulent phases correspondingly) was not random, but it revealed a clear intermittent behavior. More details on selection of EEG representing laminar and turbulent phases could be found in section II, one essential note is that normal EEG was best extrapolated to laminar phase and epileptic activity (SWDs) — to turbulent phase.
We found that the alternation of regimes of normal EEG and paroxysmal activity (SWDs) fits well to on-off intermittency Platt:1993_intermittency ; Heagy:1994_intermittency being observed in many systems Hramov:2005_IGS_EuroPhysicsLetters ; Boccaletti:2000_IntermitLagSynchro . This conclusion is based mainly on the analysis of the distribution of lengths of experimental laminar phases. Since in absence epilepsy paroxysmal activity clearly depends on the circadian periodicity Luijtelaar:1988 (i.e. it follows the light-dark cycle with night maximums), we analyzed datasets for light and dark time periods separately.
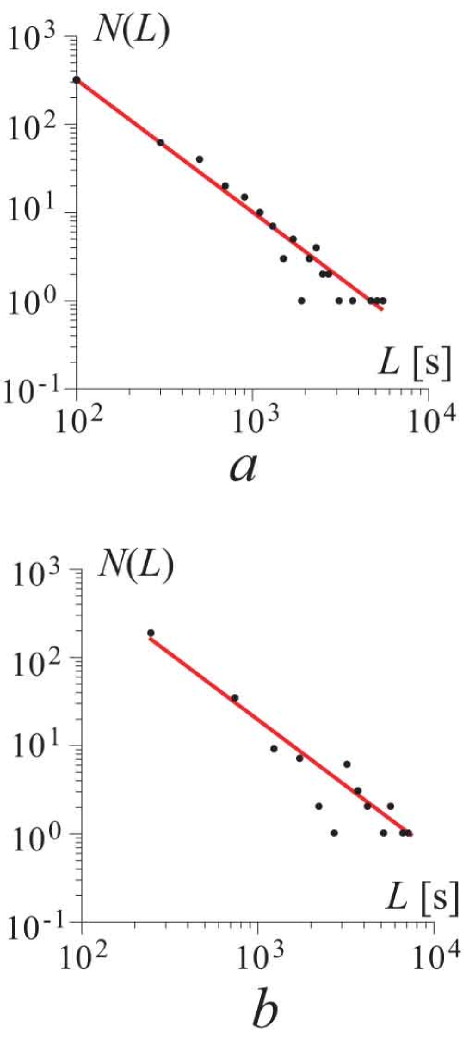
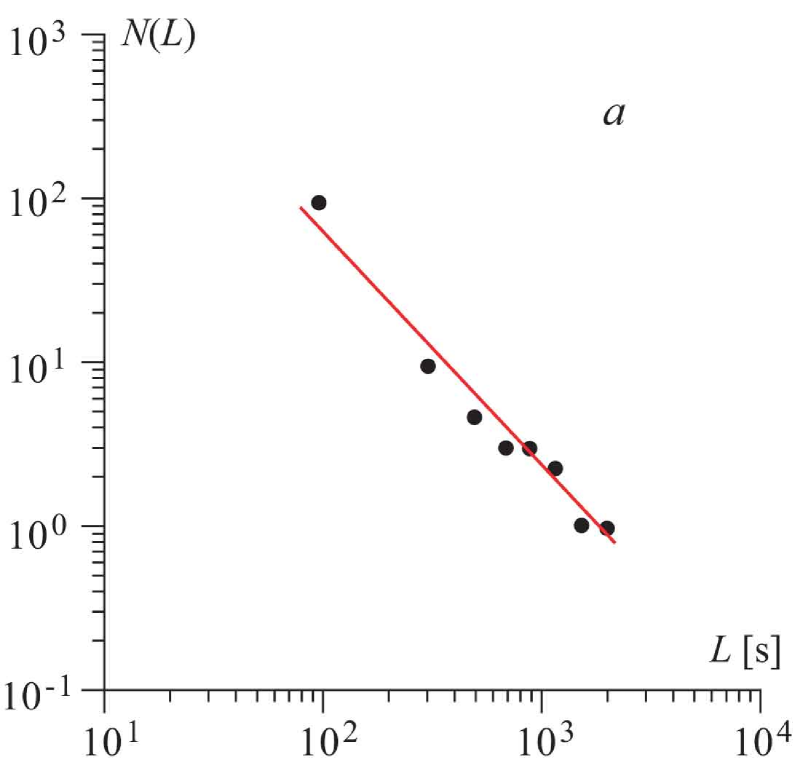
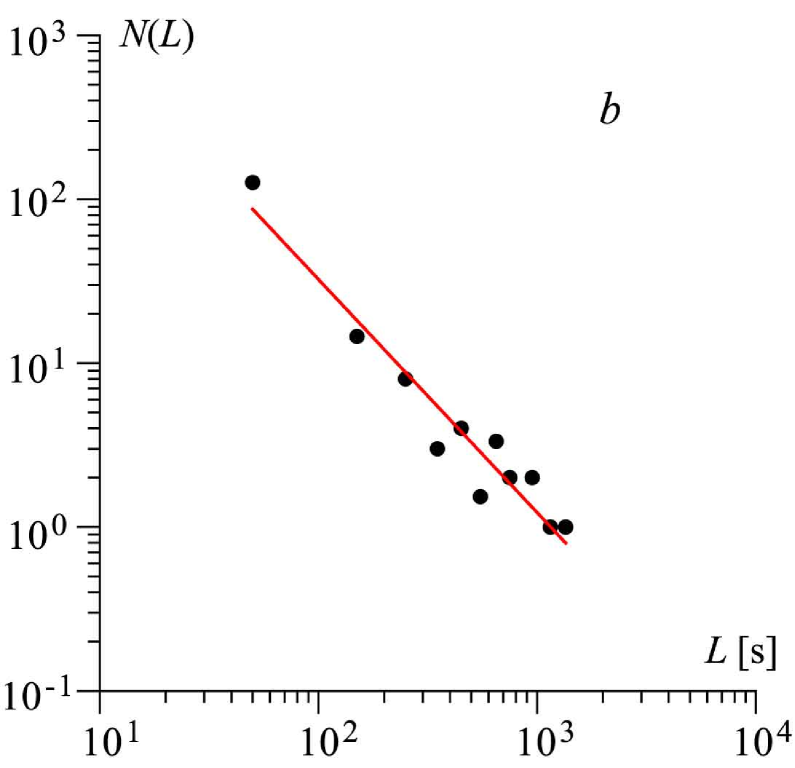
Fig. 4, a,b shows the distributions of laminar phase lengthes corresponding to the dark and light periods, respectively. These distributions have been obtained from cumulative data registered during 4 days recording made in the same rat.
The distribution of the laminar phases lengths for the case of on-off intermittency is known to follow the power law
| (6) |
where and are the parameters of power distribution (exponent of power and normalization factors, respectively), with (see, for details Platt:1993_intermittency ; Heagy:1994_intermittency ).
As one can see in Fig. 4, the experimental distribution (shown by black circles) in the log-log scale is close to the straight line corresponding to the power law with the exponent . The approximation of the experimental data has been found by the least square method. It is important, that on-off intermittent behavior has been diagnosed both in dark and light periods, while the intensity of paroxysmal activity was significantly different. As it is known, absence epilepsy paroxysms in WAG/Rij rats are more abundant during the night time compared to the day time Luijtelaar:1986 . This explains why the length of laminar phases showed lower average compared to . However, this decrease of do not breach the power law with . The same results were observed for all analyzed data sets obtained in freely moving drug-naive WAG/Rij rats of both sexes (6 females and 5 males). Based on that, we conclude that the intermittent behavior found in time series of paroxysmal activity in WAG/Rij rats is indeed in concordance with regularities known for on-off intermittency.
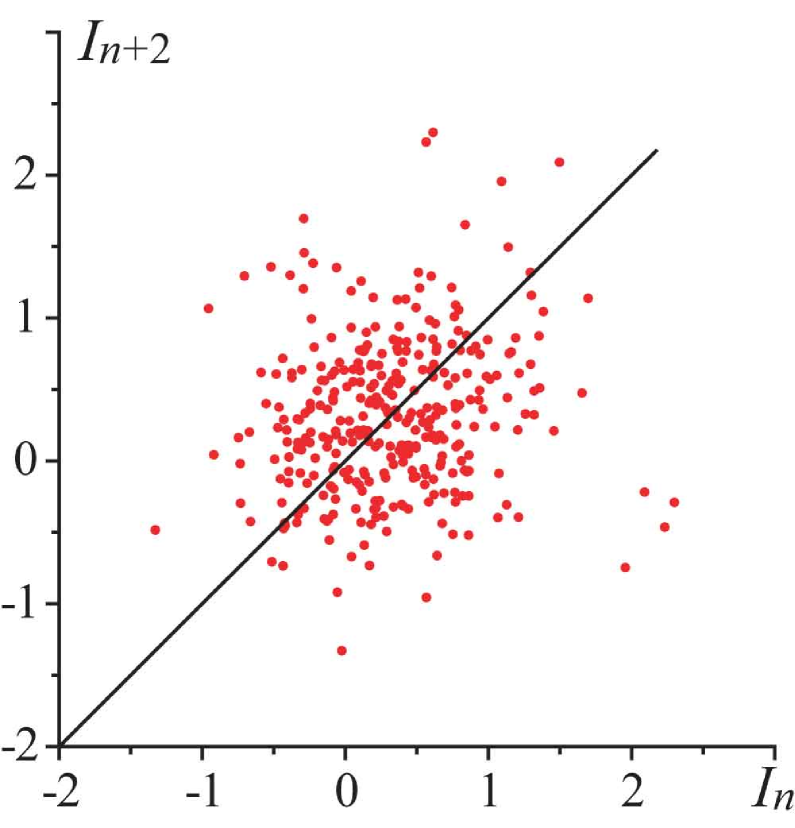
The power law with the exponent is known to be also observed in the case of the intermittency–III for the distribution of the short laminar phases (see, e.g., Berge:1988_OrderInChaos ). Since the presence of the intermittency–III may be revealed easily by the analysis of the second return map in the same way as it was done in Dubois:1983_IntermittencyIII we have checked whether the experimental distribution of laminar phases in the electroencephalogram being under consideration is the intermittency–III. In Fig. 5 the second return map obtained from the electroencephalogram is shown. One can easily see, that this map can not be approximated by the cubic polynomial taking place in the case of the intermittency–III. Therefore, we make a decision that the brain activity alternated between normal states and epilepsy paroxysms is the on–off intermittency.
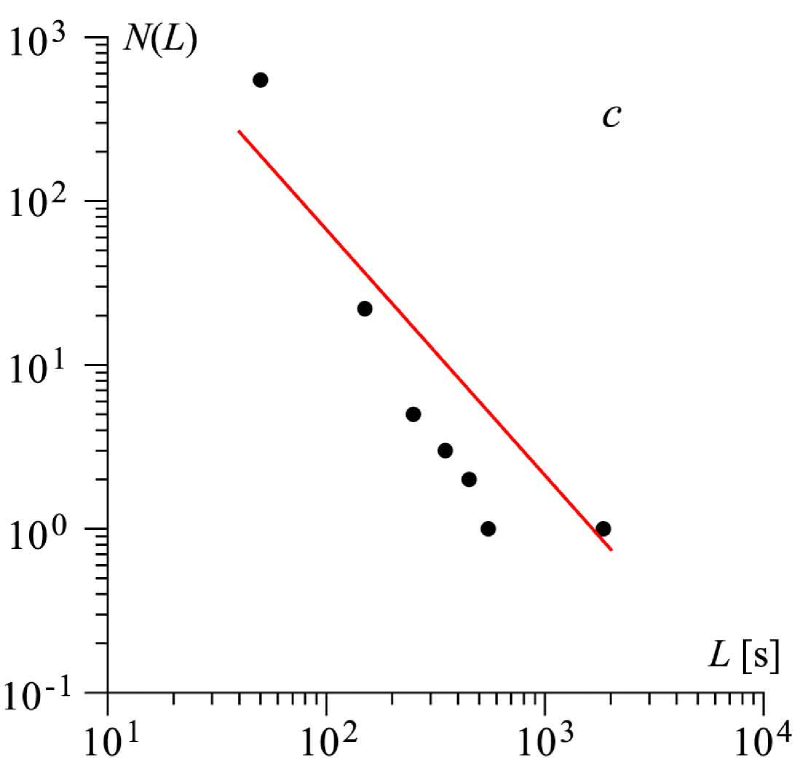
We have found that in absence epilepsy, occurrence of EEG paroxysms was not random, and spontaneous absence epilepsy could be considered as an intermittent brain disorder. Mechanisms which trigger epileptic seizures have still been poorly understood, yet some external influences have been known to enhance or diminish paroxysmal activity. In order to characterize how pharmacological treatment influences dynamic properties of epileptic activity, we injected a pro-absence drug, vigabatrin, in different doses. As it is known, vigabatrin is good especially in the treatment of generalized epilepsies Appleton:1995_Vigibatrin , but it has an opposite effect in absence epilepsy Manning:2003_Pharmacology . Vigabatrin causes dose-dependent increase in number and duration of spike-wave epileptic discharges Vergnes:1984_Epilepsy , which are characteristic for absence epilepsy. After injection of vigabatrin we tested intermittency of laminar and turbulent phases for the presence of on-off pattern. It was found that in lower doses (, mg) vigabatrin changed mean length of laminar phases, so that intervals with normal EEG activity decreased. However, distortion of laminar phases after injection of low-doses of vigabatrin did not disrupt to the power law with the exponent (see Fig. 6, a,b). Pattern of on-off intermittency in drug-injected animals was similar to that in drug-free animals (Fig. 4). In general, low-doses of vibabatrin did not alter global dynamic of epileptic activity. Injection of vigabatrin in higher dose ( mg) disrupted on-off intermittency pattern of EEG activity (see Fig. 6, c), also lengths of laminar phases were more randomly and did not correlate with exponent. This may imply that high-doses of vibabatrin influenced transition from laminar to turbulent states so that intermittency got another (probably, more complex) pattern compared to that in drug-free animals and the animals injected with vigabatrin in lower doses.
IV Conclusion
In conclusion, we report that the behavior of the epileptic brain in the case of spontaneous non-convulsive paroxysmal activity is the on–off intermittency. We evaluate temporal aspects of brain activity, in particular, relationship between two vitally important states: spontaneous paroxysmal (epileptiform) activity and non-paroxysmal (normal) activity. We state that paroxysmal (turbulent) and non-paroxysmal (laminar) states exhibited on-off intermittency with exponential rate . Such a regularity was typical for all experimental animals in the both light and dark time periods. This clearly non-random behavior of EEG dynamic in macro-scale may imply a powerful intrinsic mechanism controlling occurrence of epileptic activity.
The obtained results may contribute to development of a more general theory of epileptogenesis. It is known that one of the mechanisms underlying on-off intermittency is a co-existence of two different processes with one serving as a bifurcation parameter for another (for details see Platt:1993_intermittency ; Heagy:1994_intermittency ). To this end, a feasibility of a paroxysm onset in the rats with genetic an absence epilepsy can be modulated by some (yet unknown) slow process, which in this way “governs” the occurrence and elimination of epileptiform events. Taking into consideration that in WAG/Rij rats the paroxysmal activity is aggravating with age Coenen:1987 , we can hypothesize some acceleration of the second process with corresponded decrease of its time scope. Hopefully, we will be able to deduce this putative governing process from a special seria of experiments. Further investigations can be of clinical interest because this way may lead us to effective tools by which one can suppress epileptogenesis.
Acknowledgements
We thank Professors G.D. Kuznetsova, Dmitry I. Trubetskov and Dr. Svetlana V. Eremina for the support, Alexander A. Tyshchenko and Olga I. Moskalenko for the help in the numerical calculations. This work has been supported by the Russian Foundation for Basic Research (grant 05–02–16286), the program of support of the leading scientific schools (NSh–4167.2006.2) and by a special grant “Fundamental sciences for medicine” from the Presidium of Russian Academy of Sciences. A.E.H. and A.A.K. also thank “Dynasty” Foundation and ICFPM for financial support. A.E.H. acknowledges support from CRDF, Grant No. Y2–P–06–06.
References
- (1) Tass P.A. et al. Synchronization tomography: A method for three-dimensional localization of phase synchronized neuronal populations in the human brain using magnetoencephalography. Phys. Rev. Lett., 90(8):088101, 2003.
- (2) Velarde M.G., Nekorkin V.I., Kazantsev V.B., Makarenko V.I., Llina’s R.R. Modeling inferior olive neuron dynamics. Neural Networks, 15(1):5–10, 2002.
- (3) Nekorkin V.I., Kazantsev V.B., Velarde M.G. Spike-burst and other oscillations in a system composed of two coupled, drastically different elements. Eur. Phys. J. B, 16:147, 2000.
- (4) Kazantsev V.B., Nekorkin V.I., Binczak S., Bilbaut J.M. Spiking patterns emerging from wave instabilities in a one-dimensional neural lattice. Phys. Rev. E, 68:017201, 2003.
- (5) Chavez M., Hwang D.-U., Amann A., Hentschel H.G.E., Boccaletti S. Synchronization is enhanced in weighted complex networks. Phys. Rev. Lett., 94:218701, 2005.
- (6) Hwang D.-U., Chavez M., Amann A., Boccaletti S. Synchronization in complex networks with age ordering. Phys. Rev. Lett., 94:138701, 2005.
- (7) Tass P.A. at al. Detection of n:m phase locking from noisy data: Application to magnetoencephalography. Phys. Rev. Lett., 81(15):3291–3294, 1998.
- (8) Rosenblum M., Pikovsky A., Kurths J., Schafer C., Tass P. Phase synchronization: from theory to data analysis. In Handbook of Biological Physics, pages 279–321. Elsiver Science, 2001.
- (9) Chavez M., Adam C., Navarro, Boccaletti S., Martinerie J. On the intrinsic time scales involved in synchronization: a data-driven approach. Chaos, 15(023904), 2005.
- (10) Smirnov D.A., Bodrov M.B., Velazquez J.L.P., Wennberg R. A., Bezruchko B. P. Estimation of coupling between oscillators from short time series via phase dynamics modeling: Limitations and application to eeg data. Chaos, 15:024102, 2005.
- (11) van Luijtelaar E.L, Coenen A.M. Two types of electrocortical paroxysms in an inbred strain of rats. Neurosci. Lett, 70(3):393–397, 1986.
- (12) Platt N., Spiegel E.A., Tresser C. On–off intermittency: a mechanism for bursting. Phys. Rev. Lett., 70(3):279–282, 1993.
- (13) Heagy J.F., Platt N., Hammel S.M. Characterization of on–off intermittency. Phys. Rev. E, 49(2):1140–1150, 1994.
- (14) Boccaletti S., Valladares D.L. Characterization of intermittent lag synchronization. Phys. Rev. E, 62(5):7497–7500, 2000.
- (15) Koronovskii A.A., Hramov A.E. Continuous wavelet analysis and its applications. Moscow, Fizmatlit, 2003.
- (16) Daubechies I. Ten lectures on wavelets. SIAM, Philadelphija, 1992.
- (17) Kaiser G. A friendly guide to wavelets. Springer Verlag, 1994.
- (18) Torresani B. Continuous wavelet transform. Paris: Savoire, 1995.
- (19) Lachaux J.P. et al. Studying single–trials of the phase synchronization activity in the brain. Int. J. Bifurcation and Chaos, 10(10):2429–2439, 2000.
- (20) Lachaux J.P. et al. Estimating the time-course of coherence between single-trial brain signals: an introduction to wavelet coherence. Neurophysiol. Clin., 32(3):157–174, 2002.
- (21) Quyen M.L.V. et al. Comparison of hilbert transform and wavelet methods for the analysis of neuronal synchrony. J. Neuroscience Methods, 111:83–98, 2001.
- (22) Hramov A.E., Koronovskii A.A., Ponomarenko V.I., Prokhorov M.D. Detecting synchronization of self-sustained oscillators by external driving with varying frequency. Phys. Rev. E, 73:(accepted), 2006.
- (23) DeShazer D.J., Breban R., Ott E., Roy R. Detecting phase synchronization in a chaotic laser array. Phys. Rev. Lett., 87(4):044101, 2001.
- (24) Hramov A.E., Koronovskii A.A. An approach to chaotic synchronization. Chaos, 14(3):603–610, 2004.
- (25) Hramov A.E., Koronovskii A.A., Kurovskaya M.K., Moskalenko O.I. Synchronization of spectral components and its regularities in chaotic dynamical systems. Phys. Rev. E, 71(5):056204, 2005.
- (26) Hramov A.E., Koronovskii A.A. Time scale synchronization of chaotic oscillators. Physica D, 206(3–4):252–264, 2005.
- (27) Grossman A. and Morlet J. Decomposition of Hardy function into square integrable wavelets of constant shape. SIAM J. Math. Anal., 15(4):273, 1984.
- (28) Torrence C., Compo G.P. A practical guide to wavelet analysis. Bulletin of the American Meteorological Society, 79:61, 1998.
- (29) Hramov A.E., Koronovskii A.A. Intermitted generalized synchronization in unidirectionally coupled chaotic oscillators. Europhysics Lett., 70(2):169–175, 2005.
- (30) Luijtelaar E.L, Coenen A.M. Epilepsy Res., 2(5):331–336, 1988.
- (31) Berge P., Pomeau Y., Vidal Ch. L’Ordre Dans Le Chaos. 1988.
- (32) Dubois M., Rubio M., Bergé P. Experimental evidence of intermiasttencies associated with a subharmonic bifurcation. Phys. Rev. Lett., 51:1446–1449, 1983.
- (33) Appleton R.E. Vigabatrin in the management of generalized seizures in children. Seizure, 4:45–48, 1995.
- (34) Manning J.P., Richards D.A., Bowery N.G. Pharmacology of absence epilepsy. Trends Pharmacol Sci., 24(10):542–549, 2003.
- (35) Vergnes M., Marescaux C., Micheletti G., Depaulis A., Rumbach L., Warter J.M. Enhancement of spike and wave discharges by gabamimetic drugs in rats with spontaneous petit-mal-like epilepsy. Neurosci Lett., 44(1):91–94, 1984.
- (36) Coenen A.M, Van Luijtelaar E.L. The WAG/Rij rat model for absence epilepsy: age and sex factors. Epilepsy Res., 1(5):297–301, 1987.