Front explosion in a periodically forced surface reaction
Abstract
Resonantly-forced oscillatory reaction-diffusion systems can exhibit fronts with complicated interfacial structure separating phase-locked homogeneous states. For values of the forcing amplitude below a critical value the front “explodes” and the width of the interfacial zone grows without bound. Such front explosion phenomena are investigated for a realistic model of catalytic CO oxidation on a Pt(110) surface in the 2:1 and 3:1 resonantly-forced regimes. In the 2:1 regime, the fronts are stationary and the front explosion leads to a defect-mediated turbulent state. In the 3:1 resonantly-forced system, the fronts propagate. The front velocity tends to zero as the front explosion point is reached and the final asymptotic state is a 2:1 resonantly-locked labyrinthine pattern. The front dynamics described here should be observable in experiment since the model has been shown to capture essential features of the CO oxidation reaction.
pacs:
82.40.Bj,82.40.Np,05.45.JnI Introduction
Catalytic surface reactions are a large class of chemical reactions with important applications. They are often accompanied by oscillations, and a rich variety of wave patterns, as well as chemical turbulence, can be observed in such systems Ertl ; Rotermund . An extensively studied surface reaction is CO oxidation on single crystals of platinum. When the reaction takes place on the crystallographic plane Pt(110), a structural phase transition in the top layer of the substrate is coupled to the reaction, making oscillations and excitability possible. These kinetic regimes are well reproduced by the theoretical model of Krischer, Eiswirth and Ertl Krischer where reaction-induced surface reconstruction is taken into account. The bifurcation analysis of this model shows that it has a supercritical Hopf bifurcation Krischer . Moreover, in a region of parameter space the uniform oscillations in this system may be unstable with respect to the modulational Benjamin-Feir instability, leading to the spontaneous development of turbulence Falcke . Therefore, in the vicinity of the Hopf bifurcation, the CO oxidation reaction approximately obeys the complex Ginzburg-Landau equation (CGLE) Kuramoto . Experimentally, it may be difficult to maintain the reaction so close to the bifurcation line that the oscillations have a harmonic character and their amplitude is small. Nonetheless, many qualitative features of the wave patterns typically found in the CGLE are also observed in the CO oxidation reaction on Pt(110) under oscillatory conditions. In particular, the spontaneous development of amplitude turbulence through the nucleation of spiral wave pairs has been found in this system Science ; BertramPREexp ; BertramJPC . Thus, the CO oxidation reaction on Pt(110) provides an opportunity to experimentally investigate the general phenomena of spatiotemporal chaos in weakly nonlinear oscillatory reaction-diffusion systems.
To control the CO oxidation reaction, the partial pressure of CO in the gas above the catalytic surface can be modulated in time by varying the dosing rate of CO into the reaction chamber. The modulation of the CO pressure changes reaction conditions in the same way in all surface elements and, therefore, its effect is global. By making the modulation dependent on the properties of monitored patterns, global feedback can be introduced in the reaction system. Suppression of chemical turbulence and development of new, feedback-induced wave patterns, including regimes of intermittent spatiotemporal chaos, have been experimentally observed Science ; BertramPREexp ; Beta and theoretically investigated Science ; BertramPRETheor for the CO oxidation reaction.
Alternatively, external periodic modulation of the partial CO pressure can be applied, leading to a periodic forcing of this chemical reaction. In experiments Eiswirth1988 , entrainment of CO oscillations by such periodic forcing has been detected, but spatially-resolved observations of concentration wave patterns on the platinum surface were not then possible. Subsequently, spatially-resolved experiments on periodic forcing of chemical turbulence in this reaction were performed BertramJPC . In addition to full entrainment with uniform oscillations, regimes with oscillating cells or labyrinthine patterns, and cascades of amplitude defects characteristic of spatiotemporal intermittency, were observed. Effects of periodic forcing have also been experimentally investigated in the oscillatory Belousov-Zhabotinsky reaction petrovnature ; linPRE ; linPRL , where uniform oscillations are, however, always stable and spontaneous development of turbulence is not known.
Previous theoretical studies faradaypaper ; physicaDpaper of fronts separating different phase-locked states in the periodically forced CGLE have shown that, under the conditions of the Benjamin-Feir instability, such fronts may undergo ”explosions” as the forcing amplitude is decreased. When such an explosion occurs, the interfacial region separating the two locked states grows and eventually fills the entire medium with a turbulent phase. Similar phenomena were also found in coupled map lattice models klop ; klp .
In this paper, the effects of front explosions under 2:1 and 3:1 resonant forcing are studied in the realistic model of CO oxidation on Pt(110) for parameter values typical for the experiments on this chemical reaction where non-harmonic oscillations with substantial amplitudes are observed. As we show, front explosions occur in very different ways in these two resonant regimes. Our work provides a framework for future experimental studies of front explosions in the CO oxidation reaction.
II Periodically Forced Surface Reaction
Model
We consider the realistic model Krischer of catalytic CO oxidation on a Pt(110) surface. The model takes into account adsorption of CO and O2 molecules, reaction, desorption of CO molecules, the structural phase transition of the Pt(110) surface, and the surface diffusion of adsorbed CO molecules. Letting and represent the surface coverage of CO and O at position , respectively, and the local fraction of the surface area found in the non-reconstructed form, the reaction-diffusion equations giving the time evolution of these fields are
| (1) |
All three fields can vary in the interval from and we define for future reference. For an explanation and specification of the values of the parameters see Table 1. Although certain features, such as surface roughening, faceting, formation of subsurface oxygen, and the effects of internal gas-phase coupling are not taken into account, this model has proven to be remarkably successful in describing most aspects of the experimental observations on this system. In particular, it is able to capture oscillations in the CO oxidation process seen under some experimental conditions.
| Impingement rate of CO | ||
| CO desorption rate | ||
| Reaction rate | ||
| Impingement rate of O2 | ||
| Phase transition rate | ||
| 1.0 | CO sticking coefficient | |
| 0.6 | Oxygen sticking coefficient | |
| on the phase | ||
| 0.4 | Oxygen sticking coefficient | |
| on the phase | ||
| 0.35, 0.05 | Parameters for the | |
| structural phase transition | ||
| CO diffusion coefficient | ||
| O2 partial pressure | ||
| Base CO partial pressure |
We are interested in situations where the catalytic surface reaction is subjected to external periodic forcing. Experimentally, it is convenient to periodically modulate the CO partial pressure . Consequently, we assume in this paper that varies according to the equation
| (2) |
where is the amplitude of the forcing and the frequency of the forcing. The base value of partial CO pressure is . In the present study the parameter values of the partial pressures are chosen such that in the absence of forcing uniform oscillations are unstable with respect to small perturbations and chemical turbulence spontaneously develops in the unperturbed system. The reaction itself is oscillatory with period s for .
Numerical simulations of the model were performed using a first-order finite difference scheme for the spatial discretization with a grid resolution of m. For the temporal discretization an explicit Euler scheme with a fixed time step s was used. The system size was mm2 and no-flux boundary conditions were imposed.
Fronts separating resonantly locked states
We suppose that when periodic forcing is applied to the system it is locked in an resonance. In this case there are distinct phases of the oscillation. Chemical fronts separating pairs of these resonantly locked states can be formed by a suitable choice of initial conditions. In particular, in a two-dimensional domain, we choose initial conditions such that the left and the right half planes are homogeneous but in two different phases, respectively, and separated by a small interfacial zone where the field values are chosen at random.
Under conditions where the unforced system is Benjamin-Feir unstable and the forcing amplitude is sufficiently large, such initial conditions generate a front separating the homogeneous phases which has the form of an interfacial zone delineated by left and right profiles. The situation is depicted in Fig. 1.
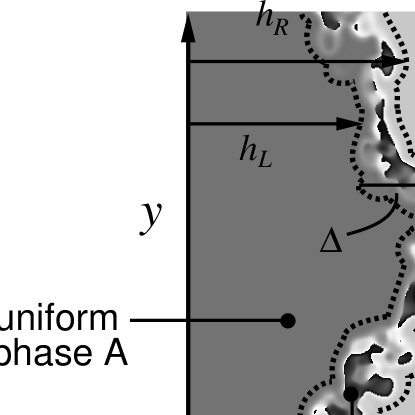
We let and (see Fig. 1). Here and are the concentration fields in the two mode locked states that the front separates and is a small numerical value which is chosen to be 0.01 in the simulations presented below. We can thus define the interfacial zone as .
The dynamics of the front can be analyzed in terms of several quantities that characterize its structure. The instantaneous intrinsic thickness of the interfacial zone at position along the front is given by
| (3) |
The spatial average of the intrinsic thickness may be computed from
| (4) |
where, henceforth, the angle brackets will refer to a spatial average along . We also define the instantaneous position of the front at a point along the front by
| (5) |
and the instantaneous mean position as . After a transient time, the phase front dynamics is observed to enter a statistically stationary regime where the temporal average of the time derivatives of and are independent of time. These quantities are called the front velocity and the interface growth rate , respectively. If then the interface has an average finite thickness which is denoted by .
Studies of the 3:1 resonantly forced complex Ginzburg-Landau equation have shown that if the amplitude of the forcing is reduced, a critical value is reached where the average thickness of the interfacial zone is no longer finite. For such values of the forcing, when the system starts from the two-phase initial conditions described above, the interfacial zone grows to fill the entire domain. We term this phenomenon a “front explosion”. We now investigate this phenomenon for the resonantly forced catalytic surface oxidation reaction.
III 2:1 forcing
In this section we study the front dynamics when the system is close to the 2:1 resonance, i.e., and, hence, . In the 2:1 resonance regime we have two distinct equivalent phases that differ by a phase shift of . An example of a front separating the two phase states is shown in the left panel of Fig. 2.
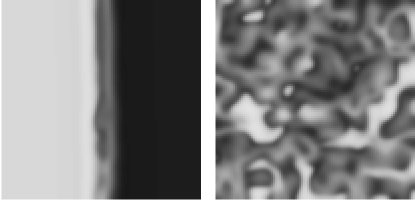
The front is stationary with finite average width . As the amplitude of the forcing is decreased we observe that grows and, for amplitudes lower than a critical value, the interfacial zone grows without bound and the front explodes. An example of an exploding front is shown in Fig. 3.
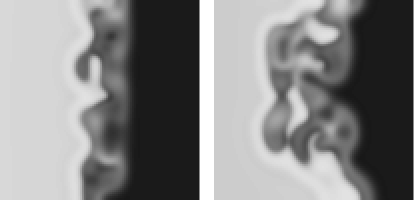
In this case the turbulent zone grows to fill the finite domain leading to turbulent dynamics in the entire system as shown in the right panel of Fig. 2.
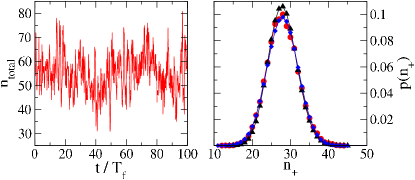
The turbulent state that emerges when the interfacial zone explodes has the characteristics of defect-mediated turbulence, where the dynamics of a pattern is dominated by the rapid motion, nucleation and annihilation of point defects (vortices or dislocations) coullet89 . A defect is characterized by its integer topological charge (or winding number) which is defined by mermin79 , where is the local phase and the integral is taken along a closed curve surrounding the defect. A topological defect, thus, corresponds to a point in the medium where the local amplitude is zero and the phase is not defined. In the CGLE only topological defects with are observed and that is also the case here. In Fig. 4 (left panel) we see that the number of defects fluctuates about a statistically stationary average value. The probability distribution of defects with positive topological charge shown in the right panel of this figure has an approximate Gaussian form. This is in accord with a simple model of defect dynamics based on rate equations and taking into account no-flux boundary conditions gil90 ; daniels02 . The model predicts a modified Poissonian distribution which, in the limit of large mean defect numbers, converges to a Gaussian.
A quantitative characterization of the transition from a stationary front with finite width () to an exploding front ( and ) is given in Fig. 5 which plots both and versus the forcing amplitude .
The transition occurs at a critical value which coincides, within the numerical resolution, with a bifurcation leading to the coexistence and bistability of homogeneous oscillatory states and turbulent states. The homogeneous oscillatory states become unstable only for values of much smaller than , namely at .
There are number of interesting features of the dynamics as the system approaches the front explosion point. Approaching from above, the front explosion is preceded by a period-doubling bifurcation at . Fig. 6 shows that the bifurcation occurs in the homogeneously oscillating domains as well as in the interfacial zone. This is in accord with the behavior of a single oscillator close to the 2:1 resonance. The phase diagram showing its states as a function of the forcing frequency and amplitude near the 2:1 resonance is given in Figure 7. As the forcing amplitude is increased at one crosses a parameter region where period doubling occurs. For the spatially distributed system, within this period-doubled or 4:1 regime, the interface dynamics undergoes further period-doubling bifurcations into chaos before the front explodes (see Fig. 6). Here is the area of the interfacial zone.
Note that in the 4:1 regime two different types of fronts can exist, namely and fronts. Here, we have focused on the fronts since they directly correspond to the () fronts present in the 2:1 regime. Simulations show that fronts do not explode at . They are stationary even below and do not become unstable within the 4:1 regime.
Phase fronts can also be observed for random initial conditions. As long as , the turbulent phase is unstable and homogeneous domains separated by phase fronts are nucleated. If these fronts are sufficiently curved they are not stationary but propagate. In a finite system as considered here, this can eventually lead to the generation of a spatially homogeneous state without any fronts. Interestingly, fronts survive much longer than fronts.
Most of the results presented in this section do not qualitatively depend on the exact forcing frequency as long as is close to . Restricting ourselves to the range of forcing frequencies present in Fig. 7, only the features of the dynamics as the system approaches the front explosion point from above depend on . If is too small, the period doubling of the dynamics within homogeneous domains and interfacial zones is absent. If is too large, a cascade of period doubling bifurcations can be observed in the homogeneous domains as well. In general, increases with increasing detuning from the resonance.
IV 3:1 forcing
Near the 3:1 resonance where () the front dynamics exhibits a number of features which differ from those described above for the 2:1 resonance. In the 3:1 resonance regime the broken translational symmetry gives rise to three distinct phases that differ by a phase shifts of ; consequently, fronts separating any two of these three phases will propagate with finite velocity . For sufficiently large forcing amplitudes, these propagating fronts are nearly planar with only small transverse structure.
As the forcing amplitude decreases, the front width increases in magnitude and, for amplitudes lower than a critical value , the interfacial zone grows without bound and the front explodes. When the interfacial zone exhibits unbounded growth, the mean velocity of the front is zero, . A simulation of an exploding front is shown in top two panels of Fig. 8.
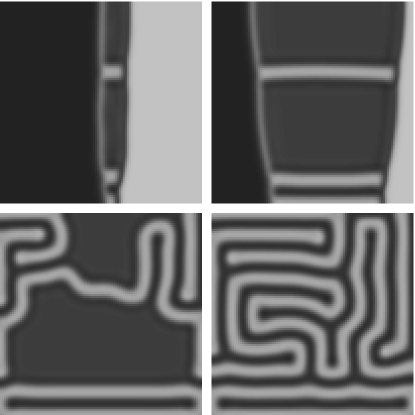
In contrast to the exploding front in the 2:1 resonantly forced regime, the expanding interfacial zone does not display spatio-temporal turbulent dynamics, instead, a labyrinthine patterns develops. This can be seen in bottom two panels of Fig. 8 which shows the formation of a labyrinthine pattern after the interfacial zone fills the simulation domain. Examination of the local dynamics indicates that the labyrinthine pattern is locked 2:1 to the applied forcing.
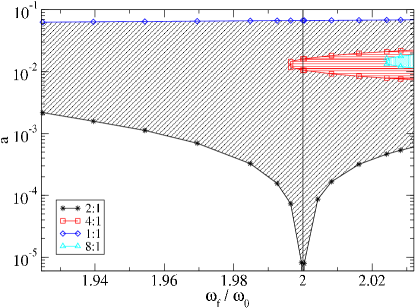
Insight into origin of this behavior can be obtained by considering the dynamics of a resonantly forced single oscillator. The phase diagram showing its states as a function of the forcing frequency and amplitude near the 3:1 resonance is given in Fig. 9. This phase diagram has a number of features that differ from those of the 2:1 Arnold tongue shown earlier in Fig. 7. The period doubling region within the Arnold tongue does not intersect the line. In addition, there is a region, indicated by the cross pattern, where there is bistability between 3:1 and 2:1 locking.
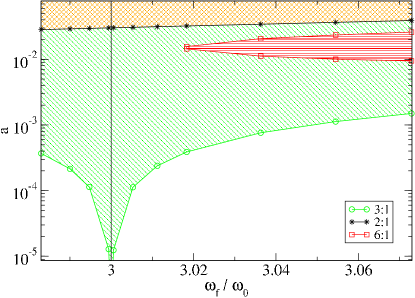
In the spatially extended system, the values of the forcing amplitude used to obtain the exploding front are well within the area of bistability and coexistence of 3:1 and 2:1 states for a single oscillator, suggesting the possibility of appearance of a 2:1 resonantly locked state as observed in the simulation. Of course, the single oscillator phase diagram does not provide information on the spatial structure of the pattern and the Arnold tongue for the spatially distributed system may display a richer structure. Our simulation result confirms the existence of a 2:1 state with a labyrinthine pattern within the 3:1 resonance tongue.
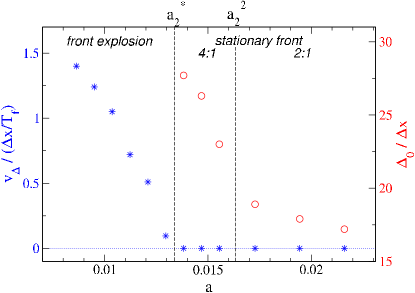
The front explosion can again be characterized quantitatively by plotting the mean interfacial width, , the growth rate of the mean interfacial width, , and the mean front velocity, as a function of the forcing amplitude. The data in Fig. 10 shows that there is a transition from a propagating front with and to an exploding front with and at a critical value .
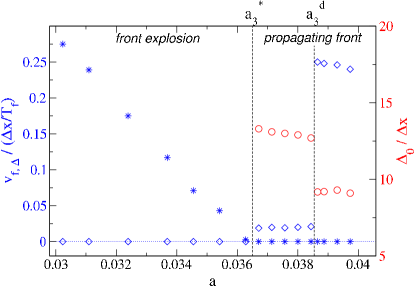
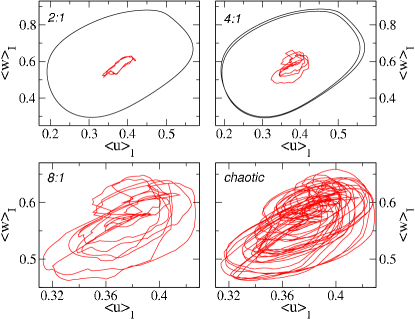
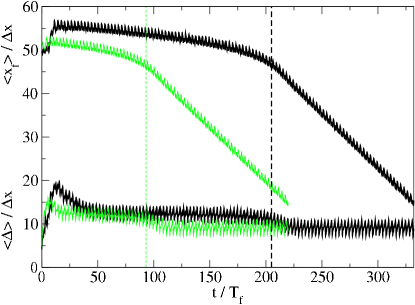
This figure also shows that there are a number of interesting features of the dynamics in the vicinity of the front explosion. Approaching from above, the front explosion is preceded by a transition of the front itself. At , the front velocity suddenly drops while the width of the interfacial zone increases. As is reduced for , the width increases and the front velocity decreases up to the transition point where . The sudden change in and at is signalled by behavior of the transient time needed to establish the interface. Figure 11 plots the temporal evolution of the average width and location of the interfacial zone for and different values of the forcing amplitude. For both values of the forcing amplitude two regimes may be distinguished in the figure. For short times a relatively thick and slowly propagating front is observed which persists for a transient time indicated by the dashed lines in the figure. For times , the front transforms into a faster moving thin front. The evolution of the interfacial zone for is very similar to that observed for . As approaches from above, the transient time increases as shown in the figure. For , no evidence for a finite has been found. Thus, these data suggest that transient time diverges at leading to a distinctly different front types below and above .
Another interesting feature of the dynamics in the vicinity of the front explosion is that, approaching from above, the front explosion is preceded by a sequence of period-doubling and inverse period-doubling bifurcations in the dynamics of the interfacial zone characterized by the behavior of . Depending on the value of , is locked either 3:1 or 6:1 to the forcing; however, there is no period-doubling bifurcation of the homogeneous oscillations outside the interfacial zone in contrast to the case of 2:1 forcing. This observation is expected, based on the phase diagram for a single oscillator given in Fig. 9 which does not show a period-doubling bifurcation close to the 3:1 resonance.
Finally, we observe that if random initial conditions are chosen, labyrinthine patterns form for while homogeneous domains locked 3:1 to the forcing and separated by phase fronts occur for . In the latter case, due to the propagation of the fronts, these inhomogeneous states generally evolve to homogeneous asymptotic states in a finite system.
V Conclusions and Discussion
The results presented in this paper show that while front “explosions” occur in a realistic model for catalytic CO surface oxidation reactions, a number of new phenomena are observed. In the 3:1 regime of the resonantly forced CGLE, when the underlying unforced system is Benjamin-Feir unstable faradaypaper ; physicaDpaper , and also for the period-3 piecewise linear coupled maps klop ; klp , propagating fronts have a turbulent interfacial zone separating homogeneous resonantly-locked states. The interfacial zone grows in this case as a power law when the magnitude of the forcing amplitude is decreased. In the CO oxidation reaction, on the other hand, the interfacial zone in the propagating front is much more structured and front explosion leads to the formation of a labyrinthine pattern with 2:1 locking. Investigations of the front explosion dynamics in the 2:1 regime of the CGLE with the Benjamin-Feir instability reveal propagating Bloch fronts with a turbulent interfacial zone which grows without bound beyond a certain critical value of the forcing amplitude chris . In both the 2:1 CGLE and in period-2 coupled maps, poorly-characterized front explosions of stationary fronts have also been observed. In the 2:1 resonantly forced CO surface oxidation reaction, the stationary front separating the two homogeneous resonantly locked states has a turbulent interfacial zone. As the forcing amplitude is decreased, beyond a critical value the interfacial zone grows without bound leading to a defect-mediated turbulent state.
Although spatially-resolved experiments with periodic forcing of the CO oxidation reaction have already been performed BertramJPC , the behavior of fronts was not studied. To create a front, special initial conditions are needed, which were not implemented in these experiments where forcing was always applied starting from the turbulent initial state. An additional difficulty was that, in the experiments, the frequency of uniform oscillations in absence of forcing could not be exactly measured, because such oscillations were unstable and led to turbulence. In these experimental investigations, the attention was focused on qualitative properties of different patterns induced by forcing. Remarkably, irregular stripe patterns with the 2:1 locking were found then for high forcing frequencies corresponding to 3:1 forcing BertramJPC . Such irregular stripe patterns were interpreted as labyrinthine patterns affected by strong surface anisotropy. In the present theoretical study, we have indeed found that the 2:1 locked labyrinthine patterns should exist under 3:1 resonant forcing in the CO oxidation system.
Our analysis of front explosions provides a theoretical framework for future experimental studies of the CO oxidation reaction under resonant periodic forcing. Generally, it provides an example of the front explosion phenomena for a system with non-harmonic oscillations and more complex dynamics, different from the ideal situation described by the complex Ginzburg-Landau equation.
Acknowledgements: The research of RK was supported in part by a Humboldt Research Award of the Alexander von Humboldt-Stiftung (Germany), and the Natural Sciences and Engineering Research Council of Canada.
References
- (1) R. Imbihl and G. Ertl, Chem. Rev. 95, 697 (1995)
- (2) H. H. Rotermund, Surf. Sci. Rep. 29, 265 (1997)
- (3) K. Krischer, M. Eiswirth, G. Ertl, J. Chem. Phys. 96, 9161 (1992)
- (4) M. Falcke, A. Engel, J. Chem. Phys. 101, 6255 (1994)
- (5) Y. Kuramoto, Chemical Oscillations, Waves, and Turbulence (Springer, Berlin 1984)
- (6) M. Kim, M. Bertram, M. Pollmann, A. von Oertzen, A. S. Mikhailov, H. H. Rotermund, G. Ertl, Science 292, 1357 (2001)
- (7) M. Bertram, C. Beta, M. Pollmann, A. S. Mikhailov, H. H. Rotermund, G. Ertl, Phys. Rev. E 67, 036208 (2003)
- (8) M. Bertram, C. Beta, H. H. Rotermund, G. Ertl, J. Phys. Chem. B 107, 9610 (2003)
- (9) C. Beta, M. Bertram, A. S. Mikhailov, H. H. Rotermund, G. Ertl, Phys. Rev. E 67, 04624 (2003)
- (10) M. Bertram, A. S. Mikhailov, Phys. Rev. E 67, 036207 (2003)
- (11) M. Eiswirth, G. Ertl, Phys. Rev. Lett. 60, 1526 (1988)
- (12) V. Petrov, Q. Ouyang and H.L. Swinney, Nature (London) 388, 655 (1997).
- (13) A. L. Lin, A. Hagberg, A. Ardelea, M. Bertram, H. L. Swinney and E. Meron, Phys. Rev. E 62, 3790 (2000).
- (14) B. Marts, A. Hagberg, E. Meron, and A. L. Lin, Phys. Rev. Lett. 93, 108305 (2004).
- (15) C. J. Hemming and R. Kapral, Faraday Discussions 120, 371 (2002).
- (16) C. J. Hemming and R. Kapral, Physica D 168, 10 (2002).
- (17) R. Kapral, R. Livi, G.-L. Oppo and A. Politi, Phys. Rev. E 49, 2009 (1994).
- (18) R. Kapral, R. Livi and A. Politi, Phys. Rev. Lett. 79, 122 (1997).
- (19) P. Coullet, L. Gil and J. Lega, Phys. Rev. Lett., 62, 1619 (1989).
- (20) N. Mernin, Rev. Mod. Phys., 51, 591(1979).
- (21) L. Gil, J. Lega and J. L. Meunier, Phys. Rev. A, 41, 1138 (1990).
- (22) K. E. Daniels and E. Bodenschatz, Phys. Rev. Lett., 88, 034501 (2002).
- (23) C. Hemming, PhD Thesis, University of Toronto, 2003.