Suppression of Complex Spiral–Wave Activity in an Ionic Model of Cardiac Tissue by Weak Local Stimulations
Abstract
On the basis of a quite realistic ionic Fenton–Karma model of the cardiac tissue we consider the problem of defibrillation by a local weak forcing. In contrast to other systems, this model accurately reproduces the most essential mesoscopic properties of the cardiac activity. It is shown that suppression of spiral–wave turbulent dynamics in the heart tissue may be realized by a low-voltage local non-feedback electrical stimulation of monophasic and biphasic shapes. After stabilization the medium goes to a spatially homogeneous steady state.
pacs:
05.45.Gg, 47.54.+r, 82.40.BjCardiovascular diseases (CVDs) are responsible for more than 4 million deaths each year in Europe (over 1.5 million deaths in the EU) and account for about 30% of life-span loss in Europe (over 30% in the EU) Stat . A major group of CVDs involves disturbances of the normal cardiac rhythm (cardiac arrhythmias). The extreme form of cardiac arrhythmias and the prevalent mode of the sudden death among patients with CVDs is ventricular fibrillation (VF), which is a fast developing disturbance of spatially organized contraction of ventricles that is a consequence of abnormalities of electrical conduction in the heart muscle. Following to the contemporary conjecture, VF is produced by a multiple wavelet re-entry, which is spiral waves in 2D and scroll waves in 3D ZJ (i.e. by spatio–temporal chaos or spiral–wave turbulence).
Since VF, sustained for only a few minutes, leads to death, an immediate intervention is required. In emergency care medicine the application of high–energy electrical stimulation through the patient’s chest is commonly used to suppress the fibrillation and restore the normal rhythmicity of the heartbeat. However, high–energy shock can cause the necrosis of myocardium or give rise to functional damage manifested as disturbances in atrioventricular conduction.
The application of electrical pulses for the termination of fibrillations is also used in implantable cardioverter defibrillators (ICDs). These devices surgically implanted into the bodies of high–risk cardiac patients and initiating low–power electrical pacing pulses automatically when they detect a dangerous activity. However, in the case of complex arrhythmias (but not fibrillation), some patients may also undergo the ICD action. As a consequence, such patients additionally have a severe pain. Therefore, a very important factor in the design of modern ICDs is decreasing the stimulation amplitude in order to avoid a painful high energy shock and damage to the heart itself and surrounding tissues. Thus, there is high demand in clinics on alternative methods of defibrillation which would work with lower voltages.
The recent research takagietal may provide an alternative to the conventional ICD therapy by terminating re-entrant arrhythmias with the field strengths that are 5 to 10 times (or delivered energy 25-100 times) weaker than usual defibrillation shocks. However, the method used in takagietal is valid only for the high–risk cardiac patients who had previous myocardial infarctions (“heart attacks”).
Theoretical studies suggest that low-energy defibrillation protocols are also possible at exploiting the dynamical properties of re-entrant waves under electrical forcing, known as feedback-driven resonant drift biktashev . However, the major problem in practical use of the resonant drift is the change of the resonant frequency with the position of rotating wave, in particular, close to unexcitable boundaries.
The qualitatively different approach of low-amplitude suppression the complex dynamics of nonlinear systems by application of perturbations without feedback was firstly proposed in alos and mathematically substantiated in loshi . Recently this method was tested on a model of the Belousov-Zhabotinsky reaction and showed its validity kovlos . The same parametric controlling but involving the feedback was used in alsam . Although parametric (non-feedback) suppression or (feedback) controlling leads to the stabilization of complex dynamics, it is not realizable for the electrical defibrillation. The only application seems to be in formulating drug therapies which modify ionic currents in order, for example, to prevent alternans (beat-to-beat alternation in the action potential duration) which is presumably one of the causes of breakup of a single rotating wave into multiple re-entrant waves (see, e.g. echekar ; stoscol ; allexot ).
The recent investigations of the active medium theory offer new opportunities for the electrical defibrillation: The amplitude of the external stimulation can be essentially decreased and the turbulent regime in excitable systems may be suppressed by a sufficiently weak periodic external forcing applied globally gray or locally LCV ; VCL ; LVys ; Zhang . By this manner, it is possible not only to suppress spatio–temporal chaos and stabilize the media dynamics, but also reestablish the initial cardiac rhythm, because after stabilization the medium goes to a spatially homogeneous steady state.
In the present paper, on the basis of a realistic cardiac model we resolve the problem of suppressing the fibrillative activity by a low-voltage local non-feedback electrical stimulation of monophasic and biphasic shapes. In contrast to FitzHugh-Nagumo type models, this model accurately reproduces such mesoscopic characteristics as action potential duration (APD), restitution and conduction velocity (CV) found in cardiac tissue. It turns out that APD (CV) is a function of both the previous APDs (CVs) and the time between excitations, also known as the diastolic interval (DI) or recovery time ZJ .
In our investigations we used a three variable simplified ionic model (SIM) of the cardiac action potential, so–called Fenton-Karma equations fentonkarma ; fentonetal :
| (1) |
where is a dimensionless membrane potential; are a fast and a slow ionic gates, respectively; is a diffusion tensor which is a diagonal matrix in our case (isotropic simulations); , , are scaled ionic currents corresponding to the , , currents, respectively; is a standard Heaviside step function (other functions, equations for the ionic currents and parameter values see in fentonetal ). The parameters correspond to the steep APD restitution (fitted to accurately represent the APD restitution in the full Beeler-Reuter model) with breakup close to the tip.

The SIM supports many different mechanisms of spiral wave breakup into complex re-entrant activity. Our numerical simulations were performed in a 2D grid of elements corresponding to the tissue size of cm. We used periodic boundary conditions, which correspond to the torus topology. This geometry is more close to a real geometry of ventricles than a sheet of tissue (Neumann boundary conditions) and allowed us to exclude wave attenuation. As a measure of the suppression of turbulent effectiveness it is convenient to compute a number of phase singularities (PSs), i.e. tips of re-entrant waves, which can be detected by a number of various techniques zhuchkovaclayton ; clayzhuchpan . We used the method described in bray .
During numerical analysis we have found that an initial archimedean spiral wave breaks into complex turbulent pattern after approximately 500 ms (see Fig.1). Chaotic system states of 500, 600, 700 ms were considered as initial ones for all our suppression attempts. To find the suppression effect, we added the external almost point periodic forcing of the frequency and the amplitude to the media. So, to stabilize the spatio–temporal chaotic dynamics we generated in the medium a single pacemaker (external electrode).

The shape of external stimulation is one of the key factors strongly influencing on the suppression effectiveness. The defibrillation shocks used in the clinical practise are of rectangular monophasic and biphasic shapes. In the contrast to defibrillation by pulses (a single shock or series of shocks), applied to the entire muscle or quite large part of it, we applied periodic stimulation of the same mono(bi)phasic waveforms (Fig.2) to a point of a medium ( nodes). Optimal values of () vary as for monophasic and for biphasic stimuli. We took for the monophasic stimulation and for the biphasic waveform.


The important problem is to select stimulation amplitudes. To determine the highest possible values of corresponding to experimentally observable shock-induced variations of membrane potential, we applied single stimuli of various amplitudes and durations. For the monophasic waveform duration of influence, was 40 ms, which corresponds to ms, for the periodic stimulation. For the biphasic stimulation duration of the positive influence, was 100 ms (ms, ). Fig.3 shows membrane potential at a pacemaker site as a function of time for both stimulation shapes and three amplitudes. To ensure experimentally observed values of membrane potential for suppression we took for both waveforms. Larger stimulation amplitudes produce the positive shock-induced variations of membrane potential larger than the maximal observed value of 100 mV fastrohrideker . Because the cardiac membrane potential varies as mV, the maximal positive value of membrane potential after applying shock is about 130 mV. Determination of the lowest amplitude corresponding to the effective suppression is a task of the future research.
We have measured the APD restitution curves obtained by two successive S1 and S2 stimuli of various amplitudes and durations (we use the 80% cutoff () when calculating restitutions). It was found that the APD restitution curves are the same for all stimuli and exactly look like one in Fig.4 in fentonetal . However, the S1-S2 interval of various stimuli is different to get the smallest DI of 43 ms. It is less when stimulation amplitudes and/or durations are greater. This means that the stimulation of larger amplitude and/or duration excites the heart tissue being in relative refractory state earlier. This inverse dependence of the refractory period on amplitude and duration of excitation phase does not appear in FitzHugh-Nagumo type models.
Consider the problem of detecting the excitation frequencies, which provide the effective stabilization. Since a search of the suppression frequencies at random is ineffective, it is necessary to select the frequency of the stimulation close to the maximal possible frequency for a given medium.
To find such frequencies, one can measure the period of target waves emitted by the created source (electrode) as a function of its own period and then choose values in the frequency intervals near the maxima of the frequency dependence. As is known, if there are several co-existing sources of periodic waves in an excitable medium, the interaction of waves leads to suppression of the sources with a longer period by a source with a shorter period biktashev . This was firstly formulated in gelfandtsetlin and is caused by the destructive interaction of colliding waves in media, which mutually annihilate. If the leading source is an external electrode, it can suppress re-entry subject to the correct choice of its frequency and shape of stimulation.
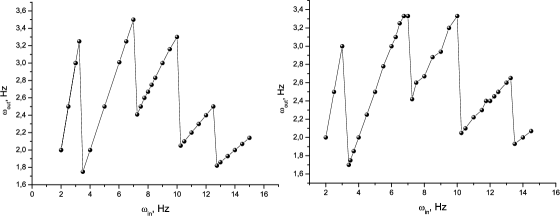
Thus, to find the suppression frequencies we generated pacemakers in quite small media volumes and determined the frequency of the target waves as a function of the pacemaker frequency (Fig.4). One can expect that the spatio-temporal chaos can be suppressed by the point external perturbation in the frequency intervals corresponding to maxima of these dependencies.
First, we tried to suppress complex activity by monophasic stimulation with Hz, corresponding to the frequency maxima on the left–hand side of Fig.4. It was found that although the suppression phenomenon was observed for Hz and Hz, it strongly depends on the suppression onset. For example, the monophasic forcing of Hz leads to the stabilization of chaotic dynamics if it starts at 500 ms, but suppression is unsuccessful if the suppression onset is 600 ms (Fig.5). Vice versa, stimulation with Hz started at 600 ms was successful. Suppression of turbulence by stimuli with Hz failed for all considered three initial conditions (500 ms, 600 ms, 700 ms). This phenomenon is connected with the initial orientation of spiral tips with respect to the excitation source and remans to be explored.

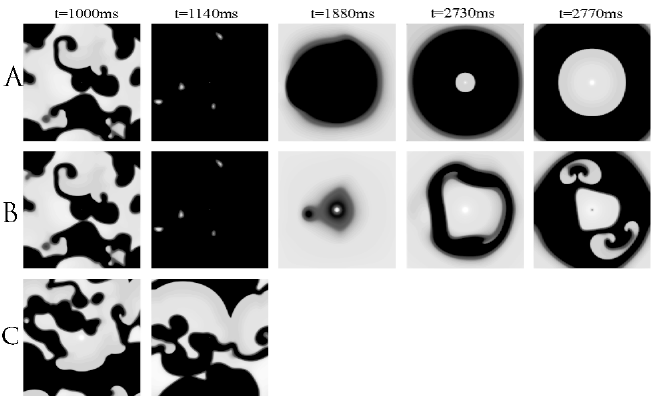
Second, we forced the system by the biphasic stimulation with Hz corresponding to the frequency maxima on the right–hand side of Fig.4. Again, the perturbation with Hz was unsuccessful. But, in contrast to the monophasic stimulation, biphasic forcing leads to the stabilization of complex dynamics by stimuli with Hz started at 500 ms and by stimulation with Hz started at 600 ms. Because the frequency interval corresponding to the second maximum on the right–hand side of Fig.4 is a quite wide, it is rather complicated to select the appropriate value of the stimulation frequency. Fig. 6 shows susceptibility to its choice. There is time evolution of the excitation pattern during biphasic stimulation started at 600 ms with close frequencies 7.25 Hz (panel A), 7 Hz (panel B) and 6.75 Hz (panel C). The panel A corresponds to the successful suppression (just an external pacemaker remained), B — to the recovered turbulence, C — to the unsuccessful suppression. As it was predicted, the patterns of the suppressed and recovered turbulence until suppressing spiral-wave activity were similar due to the small difference in the stimulus length, but creation of new spirals from an external pacemaker in the latter case (panel B) was unexpected.
It should be noted that stimulation with Hz started at 600 ms (resulting in recovered turbulence when ) leads to the effective suppression at doubling the stimulation amplitude. However, trebling the amplitude is not helpful (Fig 7). So, there is a nonlinear dependence on the stimulation amplitude.
Thus, although the suppression effectiveness strongly depends on the stimulation frequency, amplitude and initial conditions (suppression onset), it was found that for the correctly chosen these values the re-entrant waves can be easily eliminated. It should be noted that the amplitude of the excitation is by three orders of magnitude less than used in ICDs. Such low-voltage defibrillation has a great advantage because it does not require knowledge of the re-entry frequency. Moreover, in the case of VF, all the rotating waves are suppressed simultaneously and the initial cardiac rhythm can be reestablished. By these reaosns, probably the described new defibrillation strategy may be realizable in practice.
References
- (1) The statistical report European Cardiovascular Disease Statistics http://www.heartstats.org/ http://www.ehnheart.org/
- (2) D.P. Zipes and J. Jalife, “Cardiac Electrophysiology — from Cell to BedSide”, 4th edition, W.B. Saunders, Philadelphia (2004).
- (3) S. Takagi, A. Pumir, D. Pazo, I. Efimov, V. Nikolski, and V. Krinsky, Phys. Rev. Lett. 93, 058101 (2004).
- (4) V.N. Biktashev. In: Computational Biology of the Heart. Ed. A.V. Panfilov and A.V. Holden, pp. 137-170 (1997).
- (5) V.V. Alekseev and A. Loskutov, Sov. Phys.-Dokl. 32, 270 (1987).
- (6) A. Loskutov and A.I. Shishmarev, CHAOS 4, 351 (1994).
- (7) N.A. Kovaleva and A. Loskutov. Dokl.-Phys. Chem. 396, 105 (2004).
- (8) S. Alonso, F. Sagues, and A.S. Mikhailov, Science 299, 1722 (2003).
- (9) B. Echebarria and A. Karma, CHAOS 12, 923 (2002).
- (10) A.T. Stamp, G.V. Osipov, and J. J. Collins, CHAOS 12, 931 (2002).
- (11) D. Allexandre and N. F. Otani, Phys. Rev. E 70, 061903 (2004).
- (12) R.A. Gray, CHAOS 12, 941 (2002).
- (13) A. Loskutov, R.V. Cheremin, and S.A. Vysotsky, Dokl.-Phys. 50, 490 (2005).
- (14) S. A. Vysotskiy, R. V. Cheremin and A. Loskutov, J. of Physics: Conf. Ser. 23, 202 (2005).
- (15) A.Loskutov and S.A.Vysotsky, JEPT Letters 86, No9 (2006).
- (16) H. Zhang, Zh. Cao, Ning-Jie Wu, He-Ping Ying, and G. Hu, Phys. Rev. Lett. 94, 188301 (2005).
- (17) F. Fenton and A. Karma, CHAOS 8, 20 (1997).
- (18) F. Fenton, E.M. Cherry, H.M. Hastings, and S.J. Evans, CHAOS 12, 852 (2002).
- (19) E.Zhuchkova and R. Clayton, Lect. Notes for Comput. Sci. 3504, 246 (2005).
- (20) R. Clayton R., E. Zhuchkova, and A. Panfilov, Progr. in Biophys. and Molecular Biol. 90, 378 (2006).
- (21) M.-A. Bray and J.P. Wikswo, IEEE Transact. on Biomed. Eng. 49, 1086 (2002).
- (22) V.G. Fast, S. Rohr, and R.E. Ideker, Am. J. Physiol. Heart. Circ. Physiol. 278, H688 (2000).
- (23) I.M. Gelfand and M.L. Tsetlin, Dokl. Akad. Nauk SSSR 131, 1242 (1960).