Synchronization and clustering in electroencephalographic signals
Abstract
The degree of synchronization and the amount of dynamical cluster formation in electroencephalographic (EEG) signals are characterized by employing two order parameters introduced in the context of coupled chaotic systems subject to external noise. These parameters are calculated in EEG signals from a group of healthy subjects and a group of epileptic patients, including a patient experiencing an epileptic crisis. The evolution of these parameters shows the occurrence of intermittent synchronization and clustering in the brain activity during an epileptic crisis. Significantly, the existence of an instantaneous maximum of synchronization previous to the onset of a crisis is revealed by this procedure. The mean values of the order parameters and their standard deviations are compared between both groups of individuals.
keywords:
Synchronization, electroencephalographic signals, epilepsy.PACS:
05.45.-a, 89.75.Kd, , ,
1 Introduction
In recent years there has been substantial interest in the description of neural processes and electroencephalographic (EEG) signals in the context of nonlinear dynamics and deterministic chaos [1, 2, 3]. Nonlinear dynamics opens new windows for the understanding of EEG signals since the neural activity involves nonlinear mechanisms at the microscopic level. The complexity of the behavior of neural systems reflects the effects of those underlying nonlinear mechanisms. In particular, the occurrence of synchronization in EEG signals associated to various brain disorders, such as epilepsy and migraine, has been the focus of much attention [4, 5]. Synchronization phenomena are expected to play a major role in establishing the communication between different regions of the brain [6, 7].
The phenomenon of chaotic synchronization takes place when the phase space trajectories of two or more coupled chaotic systems, initially evolving on different attractors, eventually converge to a common trajectory [8, 9]. A related phenomenon is dynamical clustering; it consists of the formation of differentiated subsets of synchronized elements in a coupled system [10]. Experimental observation of dynamical clustering in coupled electrochemical systems has been reported [11].
This article presents a procedure that allows to characterize the amount of synchronization and clustering occurring on coupled chaotic oscillators subject to common noise and applies these concepts to EEG signals from healthy subjects and epileptic patients. In Section 2, a theoretical model consisting of a set of globally coupled chaotic Rössler oscillators and subject to an external noise is introduced. Synchronization and the formation of clusters, i.e., synchronized domains, under the effect of noise are studied in this model. Two order parameters are introduced in order to characterize the synchronization and the formation of clusters, i.e., synchronized domains, under the effect of noise in this system. We calculate these order parameters for different values of the coupling strength between the oscillators. The data base of EEG signals used in this study is described in Section 3; it consists of a group of ten healthy subjects and a group of ten epileptic patients, including one EEG signal of a patient experiencing an epileptic crisis. In Section 4, we perform the analysis of synchronization and cluster formation in the EEG signals from the data base. The analysis yields quantitative indices that characterize the changes of complexity in the brain activity of healthy and epileptic subjects. Conclusions are presented in Section 5.
2 Globally coupled Rössler oscillators subject to external noise
The R ssler equations constitute a paradigmatic dynamical model that exhibits chaos. For some parameter values, these equations give rise to a chaotic attractor possessing fractal properties. In order to introduce the concepts used in the characterization of EGG signals, we consider a theoretical model consisting of system of globally coupled R ssler oscillators and subject to an external noise described by the following equations [12]:
| (1) |
where , and are the state variables of oscillator ; with ; is the number of oscillators; represents the strength of the coupling amount the oscillators; is the source of noise acting on oscillator , with mean value and correlation ; and is the amplitude of the noise. The mean value of the variables is given by
| (2) |
with similar expressions for and . The addition of noise in Eq. (1) is relevant because we wish to establish a valid comparison between the behavior of this dynamical model and that of physiological systems which usually present noise and fluctuations, as in the case of EEG signals. The values of the parameters , and employed here are , and for which the individual R ssler oscillators are chaotic.
A cluster is defined as a subset of the population of oscillators which are synchronized among themselves. However, the presence of noise in a system of interacting elements usually prevents perfect synchronization. In practice, we consider that a pair of elements and belong to a cluster if the distance in phase space between them, defined as
| (3) |
is less than a threshold value , i.e., . The choice of should be appropriate for achieving differentiation between closely evolving clusters.
To characterize the amount of synchronization and the formation of clusters in a system of coupled chaotic elements such as Eq.(1), two different order parameters can be introduced [13, 14]. The first one, , is defined as the fraction of pairs of elements which are separated by a distance at time ,
| (4) |
where is the step function such that for , and for . The second order parameter, , is the fraction of elements which at time have at least one other element located at a distance ,
| (5) |
The last term in Eq.(5) is the fraction of elements whose distance to any other element is greater than . Total synchronization corresponds to . On the other hand, if all the population of oscillators is distributed in clusters, we have while , since the clusters may be separated [12]. If some elements are in clusters but others remain loose, then .
System (1) with and noise of amplitude was integrated by using a fourth-order Runge-Kutta method with time increments , starting from random initial conditions. Noise was introduced through a reliable random number generator.
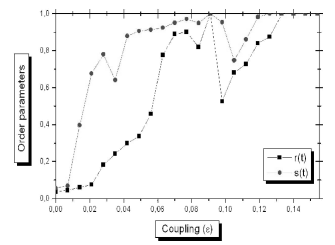
Figure 1 shows the order parameters and as functions of at time . The threshold for cluster differentiation was set at , a value for which both and reach statistically stationary values. For small values of , both and are less than , indicating that not all oscillators are forming clusters. In the interval , increases more rapidly than ; this indicates that the oscillators tend to synchronize and to form clusters. For , it is found , and therefore the elements are totally synchronized and forming a single cluster. For both order parameters definitively reach their maximum values and the system is totally synchronized.
3 Data base of EEG signals
The EEG data base used in this study consist of records from healthy subjects and epileptic patients. One of the epileptic records belongs to an individual who experienced a spontaneous convulsive crisis during the EEG recording. The record of the EEG signal from each individual was done over channels connected to scalp electrodes according to the international system . The potentials were measured with respect to a reference level consisting of both ears short-circuited. The signal was digitalized at a sampling frequency of Hz and conversion of bits, and filtered to bandwidth between and Hz.
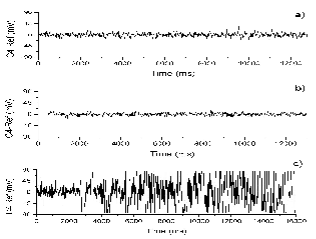
Figure 2 shows the records from the channel C4 of the EEG signals corresponding to a healthy subject, an epileptic patient without crisis, and an epileptic patient just before and during a crisis, respectively.
4 Results
In order to characterize the synchronization and cluster formation in the EEG signals for each individual, we have employed the order parameters and introduced in Sec. 2. At time (ms), the values of and were calculated for each EEG signal comprised of channels. The value of used corresponded to of the standard deviation of each EEG signal. This value of is enough to discriminate different clusters in the EEG signals.
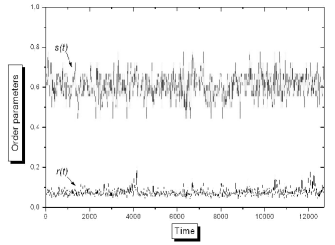
Figure 3 shows the order parameters and for a healthy individual. The parameter exhibits relatively small values indicating desynchronization among the different channels. The parameter reaches higher values that suggest the presence of some clusters. The maximum value reached by is . The analysis of the EEG signals from the others healthy subjects shows similar results to those shown in Figure 3.
Figure 4 shows the order parameters and for a epileptic patient experiencing a spontaneous epileptic crisis. The corresponding EEG signal is shown in Figure 2(c). The intervals where the amplifier was saturated were excluded for the calculation of and . Note that the parameter reaches a maximum value just two seconds before the beginning of the epileptic crisis, while at the onset of the crisis this parameter has a value of . Several maxima of are observed during the crisis. These maximum values of are greater than those reached in EEG signals from healthy subjects. Similarly, the parameter in Figure 4 also exhibits a maximum value of at two seconds before the onset of the crisis. In addition to this precursory maximum, the parameter shows several maxima during the epileptic crisis. Most of these maxima correspond exactly to the maxima of the parameter . This can be interpreted as the occurrence of intermittent synchronization in the brain activity during an epileptic crisis.
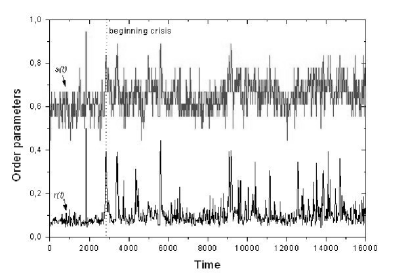
Figure 4 reveals the occurrence of a synchronization maximum at two seconds prior to the beginning of the epileptic crisis. However, this is not evident from the observation of the EEG signal from the patient, shown in Figure 2.c. This feature shows the potential that the use of nonlinear dynamics techniques has in the analysis of physiological signals and how these techniques can contribute to the prediction and diagnostics of some pathologies.
The parameters and calculated from the EEG signals from healthy subjects and epileptic patients not experiencing crisis show a similar behavior. This might be due to the fact that these patients were being treated with drugs.
| Healthy Subjects | Epileptic patients | Epileptic patient | |
|---|---|---|---|
| without crisis | with crisis | ||
| 0.075 | 0.076 | 0.110 | |
| 4.12 | 2.62 | 4.06 | |
| 0.607 | 0.604 | 0.646 | |
| 4.28 | 3.98 | 6.14 |
Table 1 displays the mean values , , and standard deviations and of the parameters and over time and over the population of healthy subjects, epileptic patients without crisis at the time of recording and the epileptic patient experiencing a crisis. In Table 1, note that the mean value clearly differentiate an epileptic patient with crisis from the other groups. The value of does not unambiguously distinguish between epileptic patients without crisis and healthy subjects; however the value of the standard deviation in the former group is about twice the value corresponding to healthy subjects.
5 Conclusions
Globally coupled systems, such as Eqs. (1), constitute theoretical models containing the essential ingredients that allow the emergence of synchronization and the formation of clusters in dynamical systems consisting of many interactive elements. The central hypothesis of this article is that the brain can also be described as a dynamical system formed by mutually coupled nonlinear elements (neurons), and therefore the collective propierties of the brain are susceptible to be analyzed through nonlinear dynamics techniques. With this aim, we have quantified the amount of synchronization and clustering in EEG signals by using order parameters previously introduced in the context of coupled chaotic oscillators.
In the case of the epileptic patient experiencing a crisis, the order parameters and show a series of instantaneous maxima in time which are absent in the evolution of those parameters in both healthy subjects and epileptic patients without crisis. The maxima of indicate instantaneous increases in synchronization. During an epileptic crisis the mean value is greater than those values corresponding to healthy subjects and to epileptic patients without crisis. The standard deviation is an order of magnitude less in the epileptic patient in crisis with respect to healthy subjects and to epileptic patients without crisis. These results suggest that the epileptic crisis can be interpreted as a collective dynamical state characterized by the presence of a high degree of synchronization between different zones of the brain.
A relevant finding of the present work is the presence of precursory maxima in both parameters and just before the onset of the epileptic crisis shown in Figure 4, while the corresponding EEG signal does not show apparent changes at that moment. Our results suggest that the use of nonlinear dynamics techniques as tools to characterize EEG signals can contribute to a better understanding and diagnostic of some brain pathologies and, as we have shown, they may help in the prediction of epileptic events. Nonlinear dynamics techniques can also contribute to characterize other types of physiological signals.
Acknowledgments
This work was supported by grant No. C-1285-04-05-A from Consejo de Desarrollo Cient fico, Humanístico y Tecnológico of Universidad de Los Andes, by CeCalCULA, and by Hospital San Juan de Dios, Mérida, Venezuela
References
- [1] P. E. Rapp, T. Bashore, J. Martinerie, A. Albano, I. Zimmerman and A. Mess, Brain Topography 2 (1989) 99.
- [2] M. C. Casdagli, L. D. Iasemidis, R. S. Savit, R. L. Glimore, S. N. Roper and J. C. Sacklelares, Eletroencephalogr. Clin. Neurophysiol. 102 (1997) 98.
- [3] A. Babloyantz, Chaotic dynamics in brain activity. Dynamics of sensory and cognitive processing by the brain. Berlin: E. Basar (Eds.), Springer, 1988.
- [4] M. LeVan Quyen et al., Physica D 127 (1999) 250.
- [5] L. Angelini et al., Phys. Rev. Lett. 93 (2004) 038103.
- [6] C. Gray et al., Nature (London) 338 (1989) 334.
- [7] M. LeVan Quyen et al., Lancet 357 (2001) 183.
- [8] H. Fujisaka and T. Yamada, Prog. Theor. Phys. 69 (1983) 32.
- [9] L. M. Pecora and T. L. Carroll, Phys. Rev. Lett. 64 (1990) 821.
- [10] K. Kaneko, Physica D 75 (1994) 55.
- [11] W. Wang, I. Z. Kiss and J. L. Hudson, Chaos, 10 (2000) 248.
- [12] D. H. Zanette and A. S. Mikhailov, Phys. Rev. E 62 (2000) 7571.
- [13] D. H. Zanette and A. S. Mikhailov, Phys. Rev. E 57 (1998) 276.
- [14] S. C. Manrubia and A. S. Mikhailov, Phys. Rev. E 60 (1999) 1579.