Estimation of a Noise Level Using Coarse-Grained Entropy of Experimental Time Series of Internal Pressure in a Combustion Engine
Abstract
We report our results on non-periodic experimental time series of pressure in a single cylinder spark ignition engine. The experiments were performed for different levels of loading. We estimate the noise level in internal pressure calculating the coarse-grained entropy from variations of maximal pressures in successive cycles. The results show that the dynamics of the combustion is a nonlinear multidimensional process mediated by noise. Our results show that so defined level of noise in internal pressure is not monotonous function of loading.
keywords:
Spark ignition engine, combustion, noise estimation1 Introduction
The cycle-to-cycle combustion variability has been a subject of interest for many years [1, 2, 3, 4, 5, 6, 7, 8, 9, 10, 11, 12]. It is possible that many different disturbances influence the process making it stochastic but in case of high sensitivity on the process conditions one should also consider appearance of chaotic behaviour [2, 3, 4, 7, 8, 9, 10, 11]. The pressure signal can be used to control the engine combustion [15]. Its variations might originate from a complex dynamics leading, presumably with some stochastic component, to non-periodic behaviour. Thus, the crucial problem is to understand the nonlinear dynamics of the process observing the internal pressure inside the cylinder. In the present note we discuss experimental results of a direct measurement of internal pressure and analyse its time series using the coarse grained entropy method [13]. The method has been already used successively by Kaminski et al. [12] to examine the dynamics of combustion in a four cylinder combustion engine to examine the influence of an spark advance angle on cycle-to-cycle variations of heat release. In this paper we present analysis of pressure concerned to a single cylinder engine. Experimental works have been performed in the Engine Laboratory at University of Trieste.
The paper is organised as follows. After the present introduction we will discuss experimental facilities in Sec. 2. Following Sec. 3 is devoted to analysis of pressure time series. In this section we show the experimental results and perform their initial analysis. In Sec. 4 we present the methodology of noise level estimation and we finally apply the coarse-grained entropy method to internal pressure time series. At the end we provide conclusions in the last Sec. 5.
2 Experimental Facilities
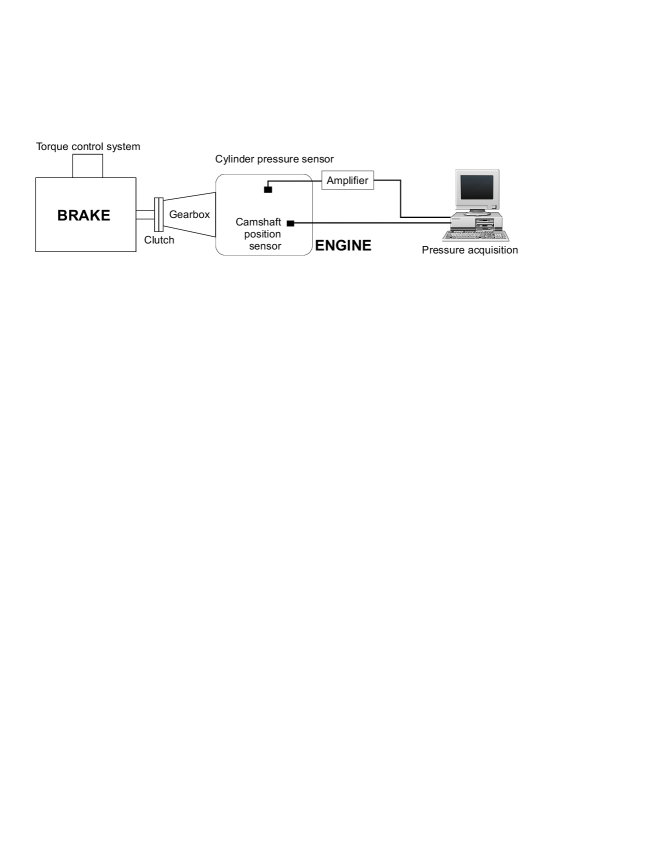
Tests were carried out on a SI - four stroke, single cylinder, Aprilia/Rotax engine. The instrumentation which was used during our test is schematically presented in Fig. 1.
The pressure sensor Kistler 6053C, was preferred for its small dimensions. Mounting the pressure sensor was a complex task because of the cylinder head profile. The sensor was placed in the relatively small available space, which remains between the five valves areas. It was centrally positioned, having the active part very closed to the spark plug electrodes. As the upper end of the sensor, stays under the cylinder head cover, a protective tube for the connecting cable was mounted.
The encoder (Lika C58L), due to the engine configuration, was fixed on the camshaft.
This solution generates complications regarding signal processing. Because of the transmission chain, there is no rigid connection between the engine crankshaft and the encoder shaft, therefore synchronisation problems may appear. To overcome this, before each testing session, motored engine tests were accomplished, to determine the shifting between the encoder trigger and pressure maximum peak.
The reference level for the cylinder pressure was established using the intake pressure signal, acquired with an inductive pressure sensor. Before each test session, this sensor was calibrated using a simple system containing: a piston pump which creates the calibration pressure, a high precision manometer, a signal amplifier which amplifies the sensor output and a voltmeter [14].
| number of measured pressure consecutive in averaging procedure | r |
| internal cylinder pressure | |
| maximum pressure in cycle | or |
| average of maximum pressure series | |
| maximum pressure vector in the embedding space | P |
| Heaviside step function | |
| embedding time delay in cycles | |
| cycle number | |
| embedding dimension | n |
| number of considered points in time series | |
| loading torque | |
| crank angle | |
| threshold | |
| correlation integral | |
| coarse-grained correlation integral | |
| correlation entropy | |
| coarse-grained correlation entropy | |
| calculated from time series coarse-grained entropy | |
| correlation dimension | |
| Noise-to-Signal ratio | NTS |
| standard deviation of data | |
| error function | Erf |
| fitting parameters | , , |
| standard deviation of noise | |
| top dead center | TDC |
3 Time Series Analysis
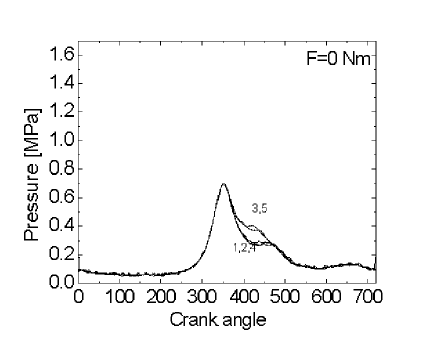
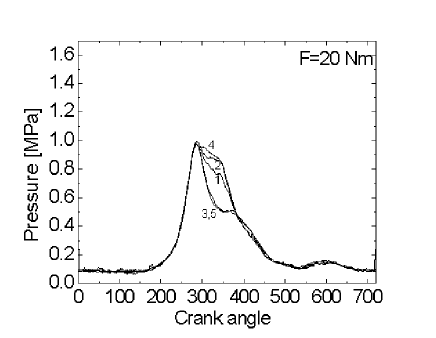
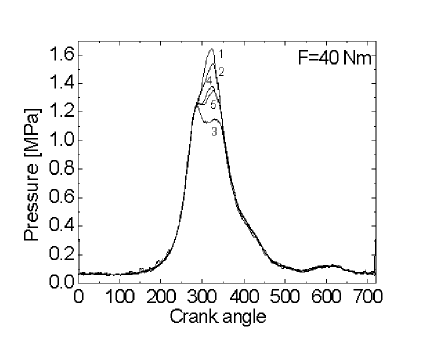
Using our experimental standing we have measured internal pressure time series for 1000 cycles measuring 6000 points per cycle. In Fig. 2 we have plotted pressure against the crank angle for first five consecutive cycles of measured engine work against the crank angle for different torque loadings , 20 and 40 Nm. Note that with larger loads the peak pressure is higher and the combustion zone concentrates near the TDC. Variations of pressure reflects the efficiency of combustion process in successive cycles. Such a phenomenon is associated with the burned fuel fluctuations and influence negatively on its consumption. The cyclic fluctuations of pressure in combustion process can be described by its maximal value in each cycle. Interestingly, as it was proposed in Ref. [15], it is possible to use the maximal values of pressure involved in control process to achieve stable combustion. The method of peak-to-peak analysis appeared to be useful to analyse some kind of dynamical systems [16], as it is in our case. This peak-to-peak variation is our starting point for further analysis by means of a Coarse-Grained Entropy and an autocorrelation function.


To show its cycle-to-cycle changes we have plotted against successive cycles in Fig. 3. One should note that both, average value of pressure as well as its standard deviation (Fig. 4) increase with growing torque . Interestingly, for about we observe the sudden growth of . This is a result of some diversity of a maximal pressure origin as pressure itself is a complex product of compression and combustion phenomena. Clearly, one can see the intermittent behaviour of (Fig. 3 for and 28 Nm) can be explained in these terms. Lean combustion where the maximum of pressure is produced largely by piston compression with possible ignition missing corresponds to lower level of (Fig. 3) while effective combustion happens from time to time corresponds to spikes in Fig. 3. Similar effects can be seen for and but not for where the distribution of is going back to a Gaussian type.
4 Noise Level Estimation
In the dimensional embedding space [17] the state is determined by a multidimensional vector
| (1) |
where denotes the embedding delay in terms of cycles. The correlation integral calculated in the embedding space can be defined as [18, 19]
| (2) |
where is the number of considered points corresponding to pressure peaks in cycles and is the Heaviside step function. For simplicity we use maximum norm. The correlation integral is related to the correlation entropy and the system correlation dimension by the following formula [18, 19]
| (3) |
The coarse-grained correlation entropy can be now be calculated as
| (4) |
In such a case the correlation entropy is defined in the limit of a small threshold .
In presence of noise described by the standard deviation of time series, the observed coarse-grained entropy [13] can be written as
| (5) | |||||
Function g, present in the above formula, reads
| (6) |
where Erf is the Error Function. The parameters , , as well as are unconstrained. They should be fitted in Eq. (5) to mimic the observed noisy entropy calculated from the experimental data.
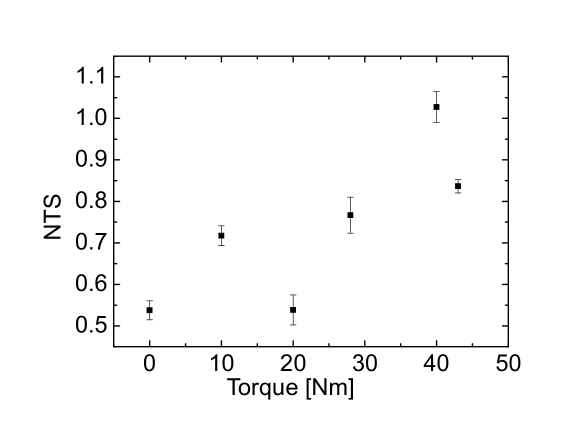
Using the above procedure in analysing the time series of pressure peaks we have calculated the coarse-grained correlation entropy for different loading levels (, 20, 28, 40, 43Nm). Fitting it to the last formula (Eq. 5) it was possible to estimate the noise level . In Fig. 5 we present the obtained results with the help of NTS parameter defined as follows
| (7) |
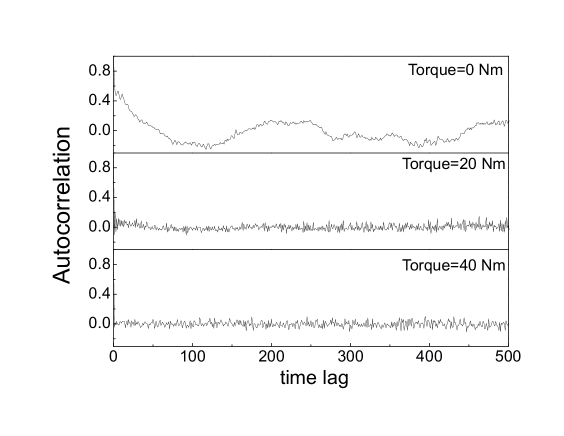
where is the standard deviation of maximum pressure signal data (Fig. 4). The error on Fig.5 comes from the fitting procedure of Eq.(5) to observed coarse-grained correlation entropy. Note, the leading tendency is that for higher loading the noise is larger, what is expected for most of the engines with lean combustion. However the cases of and 43Nm could be the exception of this rule. At we simultaneously observe the first sudden increase of . It is natural that the overall effect (Eq. 7) will cause decreasing of NTS. Interestingly, the nodal or very low loading signal (of ) appears to be influenced more by a compression phenomenon mediated by combustion process (Fig. 2a) than combustion itself. In this case is highly correlated. In Fig. 6 we show the autocorrelation function for different torque loading , 20 and 40Nm. Note that for the lowest loading () the autocorrelation function does not decrease in contrast to the other cases.
On the other hand at Nm (Fig. 5) we have to do with a different situation. In that case due to increasing loading the fresh fuel feeding is of higher level and cycles which misses of ignition do not happen any more. On the other hand for and 43 Nm we observe further growing of the signal square deviation with an increasing load. In such conditions it is not a surprise that in such a case we also observe a lower level of NTS.
5 Summary and Conclusions
We applied the Coarse-Grained Entropy Method for the experimental data estimating the noise-level. This method enable to distinguish determined signal, including chaos with its short time prediction scale, and random noise. Analysing our experimental data we decided to use maximal values of pressure . In all considered cases we have found a relatively high noise level. However it has appeared that larger loading led to more noisy system. For larger power the engine needs more fuel. Increase of fluctuation in combustion can happen if the engine work is optimised for the lowest fuel consumption or the exhaust gas toxicity. Another interesting point, discussed in the paper, was connected with a missing ignition effect. In fact such effects are present for small loading (Figs. 2a-b) but influence strongly distribution only if loading is large enough.
We have also found that the pressure signal was more correlated (Fig. 6) for small loading. Note, the noise level obtained for a correlated signal case by our method can be underestimated by a few percents. A noise component for small loading can be also related to a well known problem of idle speed engine control difficulties [20, 21].
Acknowledgements
Three of authors (GL, KU, JAH) would like to thank Max Planck Institute for Physics of Complex Systems in Dresden for hospitality. During their stay in Dresden an important part of data analysis has been performed. KU is grateful to DAAD for a financial support.
References
- [1] Heywood JB, Internal combustion engine fundamentals. (McGraw-Hill, New York 1988).
- [2] Daily JW, Cycle-to-cycle variations: a chaotic process? Combustion Science and Technology 1988:57:149-162.
- [3] Foakes AP, Pollard DG. Investigation of a chaotic mechanism for cycle-to-cycle variations. Combustion Science and Technology 1993:90: 281-287.
- [4] Chew L, Hoekstra R, Nayfeh JF, Navedo J (1994). Chaos analysis of in-cylinder pressure measurements. SAE Paper 1994:942486.
- [5] Hu Z, Nonliner instabilities of combustion processes and cycle-to-cycle variations in spark-ignition engines. SAE Paper 1996:961197.
- [6] Roberts JB, Peyton-Jones JC, Landsborough KJ. Cylinder Pressure Variations as a Stochastic Process. SAE Paper 1997:970059.
- [7] Daw CS, Finney CEA, Green Jr JB, Kennel MB, Thomas JF and Connolly FT, A simple model for cyclic variations in a spark-ignition engine. SAE Paper 1996:962086.
- [8] Daw CS, Kennel MB, Finney CEA, Connolly FT, Observing and modeling nonlinear dynamics in an internal combustion engine. Phys. Rev. E 1998:57:2811–2819.
- [9] Green Jr JB, Daw CS, Armfield JS, Finney CEA, Wagner RM, Drallmeier JA, Kennel MB, Durbetaki P, Time irreversibility and comparison of cyclic-variability models. SAE Paper 1999:1999-01-0221.
- [10] Wendeker M, Czarnigowski J, Litak G, Szabelski K, Chaotic Combustion in Spark Ignition Engines. Chaos, Solitons & Fractals 2003:18:803–806.
- [11] Wendeker M, Litak G, Czarnigowski J, Szabelski K, Nonperiodic Oscillations of Pressure in a Spark Ignition Engine. Int. J. Bifurcation and Chaos 2004:14 No. 5 (in press).
- [12] Kaminski T, Wendeker M, Urbanowicz K and Litak G, Combustion Process in a Spark Ignition Engine: Dynamics and Noise Level estimation, Chaos 2004:14 No. 2 (in press).
- [13] Urbanowicz K, Hołyst JA, Noise-level Estimation of Time Series Using Coarse-Grained Entropy. Phys. Rev. E 2003:67:046218
- [14] Giadrossi A, Reini M, Taccani R, Allestimento e taratura di un banco prova sperimentale per motori motociclistici. ATA, MIS-MAC VI Metodi si sperimentazione nelle macchine, 1999.
- [15] Leonhardt S, Müller N, Isermann R, Methods for engine supervision and control based on cylinder pressure information. IEEE/ASME Transactions on Mechatronics, 1999:4:235-45.
- [16] Piccardi C, Rinaldi S. The Impact of Noise and Sampling Frequency on The Control of Peak-to-Peak Dynamics. Int. J. Bifurcation and Chaos 2003:13:1579–1586.
- [17] Kantz H, Scheiber T, Nonlinear Time Series Analysis (Cambridge University Press, Cambridge 1997).
- [18] Pawelzik K and Schuster HG, Generelized dimensions and entropy from a measured time-series. Phys. Rev. A 1987:35:481-484.
- [19] Grassberger P and Procaccia I, Characterisation of strange attractors. Phys. Rev. Lett. 1983:50:346-349.
- [20] Wendeker M, Czarnigowski J, Adaptive Control of The Idle Speed. In Proceedings of ASME 2003 Spring Technical Conference, Salzburg, Austria, May 11-14, 2003.
- [21] Badreddine B, Zaremba A, Sun J, Lin F, Active Damping of Engine Idle Speed Oscillation by Applying Adaptive PID Control. SAE Paper 2001:01-0261.