Wave-number Selection by Target Patterns and Side Walls in Rayleigh-Bénard Convection
Abstract
We present experimental results for patterns of Rayleigh-Bénard convection in a cylindrical container with static side-wall forcing. The fluid used was methanol, with a Prandlt number , and the aspect ratio was ( is the radius and the thickness of the fluid layer).
In the presence of a small heat input along the side wall, a sudden jump of the temperature difference from below to slightly above a critical value produced a stable pattern of concentric rolls (a target pattern) with the central roll (the umbilicus) at the center of the cell. A quasi-static increase of beyond caused the umbilicus of the pattern to move off center. As observed by others, a further quasi-static increase of up to caused a sequence of transitions at , each associated with the loss of one convection roll at the umbilicus. Each loss of a roll was preceded by the displacement of the umbilicus away from the center of the cell. After each transition the umbilicus moved back toward but never quite reached the center. With decreasing new rolls formed at the umbilicus when was reduced below . When decreasing , large umbilicus displacements did not occur.
In addition to quantitative measurements of the umbilicus displacement, we determined and analyzed the entire wave-director field of each image. The wave numbers varied in the axial direction, with minima at the umbilicus and at the cell wall and a maximum at a radial position close to . The wave numbers at the maximum showed hysteretic jumps at and , but on average agreed well with the theoretical predictions for the wave numbers selected in the far field of an infinitely extended target pattern. To our knowledge there is as yet no prediction for the wave number selected by the umbilicus itself, or by the cell wall of the finite experimental system.
pacs:
47.54.+r,47.27.Te,47.20.-k,47.20.BpI Introduction
When a temperature difference exceeding a critical value is applied across a thin, horizontal layer of fluid, convection occurs. Ch61 This phenomenon is know as Rayleigh-Bénard convection (RBC). The fluid flow then forms a pattern. The onset of convection is determined by the Rayleigh number
| (1) |
Here is the isobaric thermal expansion coefficient, the acceletation of gravity, the thickness of the sample, the thermal diffusivity, and the kinematic viscosity. Linear stability-analysis for a laterally infinite system shows that convection will occur with a critical wave number ( is measured in units of ) when exceeds . Ch61 For the laterally infinite system the patterns that evolve beyond the onset of convection and their stability are determined by and by the Prandtl number
| (2) |
Weakly nonlinear theory predicts that immediately above onset, a laterally infinite uniform system should yield a pattern consisting of parallel, straight rolls.SLB65 For real experimental systems the patterns are influenced by the lateral boundaries which contain the fluid. Even in these finite systems excellent approximations of the predicted ideal straight rolls of the infinite system can be found under some conditions. BPA00 ; FNrolls ; BMCA99 However, the boundaries can also lead to patterns of different symmetry. Thus, by heating a thin cylindrical convection cell gently from the side in addition to heating primarily from below, a pattern of concentric rolls can be stabilized. A concentric pattern can also be the result of horizontal temperature gradients near a cylindrical side wall which are intrinsic to the particular construction of the sample cell. The concentric pattern will consist of rolls, where is an integer. Of these, the one in the middle really would be more properly viewed as a convection cell, with either up-flow or down-flow in its center. It is often referred to as the umbilicus. This type of pattern, know also as a target pattern, was studied extensively by Koschmieder and Pallas KP74 for relatively large . The rolls have a mean dimensionless wave length where ( is the sample radius) is the aspect ratio of the sample and where is the number of rolls along a radius. The corresponding wave number is . Koschmieder and Pallas found that the wave length of the rolls away from the center and the side wall increased with increasing . They also observed a sequence of transitions with increasing , each of which involved the loss of a roll at the sample center.
Later work for smaller showed that at a certain value of the target pattern becomes unstable. CP84 ; SAC85 ; CLPG86 ; CGP86 ; HEA93 The instability is known as the focus instability. NPS90 How this occurs in detail depends on , , and on the nature of the confining side walls. Here we describe what happens for our particular sample (), where the side walls fixed the phase of the pattern at the radial position ( is scaled by the cell thickness ). For the work of Ref.SAC85 () the observed phenomena were similar. As is increased in small steps from small values, the umbilicus shrinks. The result is a gradual decrease of the local wave numbers of the rolls away from the center. When is increased beyond , the umbilicus breaks the cylindrical symmetry by moving off center. This transition is continuous and the off-center patterns are stationary in time, but the radial umbilicus position is dependent. As is further increased, the umbilicus becomes even smaller, and then disappears at . At that point the pattern once more approaches a state of cylindrically symmetric rolls, although perfect rotational invariance is not fully recovered. With further increase of , this process repeats itself, with another roll loss at , and so forth. The net result is a gradual reduction with increasing of the wave numbers of the rolls between transitions and a discontinuous change of at each transition. The transitions are hysteretic, occurring at when is decreased.
We studied target patterns for in a sample with using methanol with . We developed high-resolution numerical umbilicus-detection algorithms and determined quantitatively the umbilicus displacement with increasing as well as decreasing . At small the results revealed the location of the focus instability, at . Previous measurements, HEA93 for and a larger , had found the instability at lower values, near . Over the whole range of our experiment the data for , together with measurements of an average wave number away from the center and the side wall, revealed eight hysteretic transitions. We observed large umbilicus displacement only for increasing ; for decreasing the hysteresis yielded transition points which were sufficiently low to avoid the -range over which the umbilicus displacement was large.
For cross rolls CB74 ; BC79 formed at the outermost roll when the system was close to a transition at . This was particularly pronounced on the side opposite to the umbilicus displacement where the local wave lengths were exceptionally large when was large. Nonetheless, the general nature of the pattern was maintained up to our largest values. For periodic time dependence associated with the oscillatory instability CB74 ; BC79 developed in the region near the cross rolls.
A complete characterization of the pattern involves a knowledge of the entire wave-director field where is the angular and the radial position in the sample. Rather than simply measuring an average wave number along a cell diameter (as was done in previous work), we implemented a local wave-director analysis HG87 ; CMT94 ; EMB98 and determined . From we could then determine various averaged quantities, including . The results for , determined over a radius range that excluded the rolls near the center and the side wall, were discontinuous at the transitions. The hysteresis loop of each transition was traced out quantitatively. We found that the azimuthal average had interesting structure as a function of , showing different selection at the umbilicus, in the bulk of the sample, and at the cell wall. The competition between the selection mechanisms yielded a broad maximum of near . For our experimental conditions it did not yield any radially traveling waves, as predicted by Tuckerman and Barkley TB88 ; BT89 for the case of conducting side walls. As was found in previous work, CP84 ; SAC85 ; CLPG86 ; HEA93 the values of selected in the bulk were in good agreement with the predicted wave numbers for the far field of infinitely extended concentric rolls when the discontinuities at the transitions were smoothed out. We also report results for the wave numbers selected at the umbilicus and at the side wall; but for these there seem to be no theoretical prediction.
In the next section we shall review theoretical predictions for the selection by concentric rolls and relevant previous experiments. Then. in Sect. III, we shall discuss the experimental apparatus and procedures, as well as the image-analysis methods. Section IV gives our results. It consists of a discussion of the patterns observed in various ranges, of a presentation of the umbilicus-displacements results, and of a presentation of our wave-number results. A brief section summarizing this work ends the paper.
II Theoretical predictions and previous Experiment
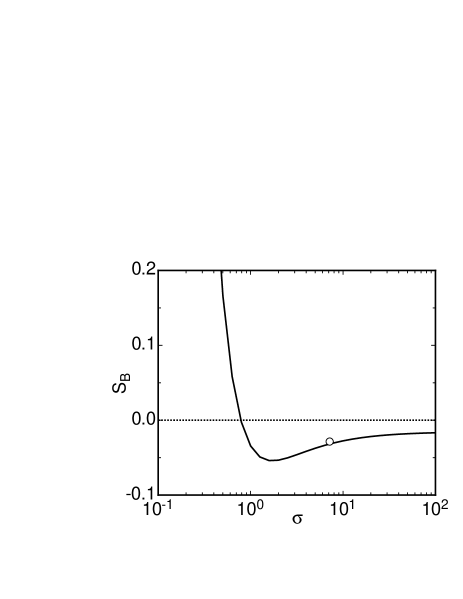
Theoretical predictions of the wave numbers selected in the far field of infinitely extended target patterns have been made by several authors. PM81 ; Cr83 ; MP83 ; BC86 ; NPS90 For the infinite system wave-number adjustment can take place by expansion of the pattern to large distances. Finite laboratory systems differ from this in an important way. The side wall, under typical experimental conditions, pins the phase of the pattern and prevents this expansion. Thus, a change of the average wave number with changing is possible only at the umbilicus. However, also at the umbilicus unhindered phase slip is not possible. Instead, a discontinuous and hysteretic process involving the destruction or creation of a convection cell occurs and leads to a discontinuous change of the wave-number field at the transition. The discontinuous effect on the average wave number decreases as the aspect ratio of the sample increases because the loss of a single cell in the center is a smaller perturbation for a larger sample. Thus, even for the sample with a boundary one expects, in the large- limit, a continuous curve as a function of . Theoretically the location of this curve is determined by the rotational symmetry of the target pattern which does not permit the mean flow that is induced by roll curvature under less symmetric conditions. Thus, the mean flow must be balanced precisely by a pressure gradient.PM81 ; Cr83 ; MP83 This condition leads to a unique wave number . Initial predictions of the selected wave numbers were applicable only for small and are given by Cr83 ; MP83
| (3) |
with , , and . Here is the critical wave number at the onset of convection. In Fig. 1 we show as a function of . For the present work we have and . The measurements to be described below yielded the experimental value . This result is shown as the circle in the figure. It falls slightly above, but is generally in good agreement with, the prediction. For the work of Ref. CP84 () the theory yields , but no corresponding result has been extracted from the data. Measurements for were reported in Ref. HEA93 and yielded a value for close to zero, but a precise number was not quoted. For that case one obtains the prediction , but changes rapidly with and passes through zero at .
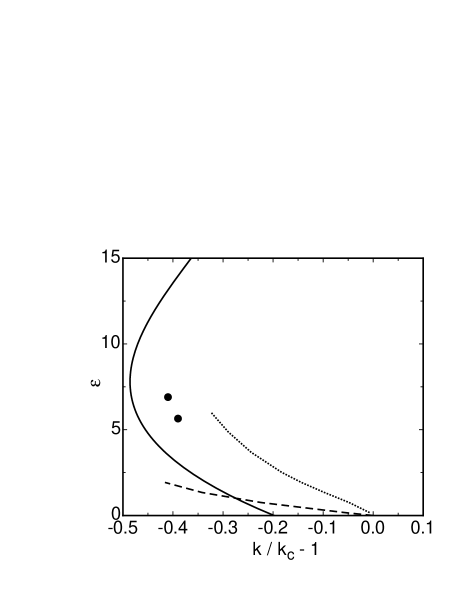
Calculations valid at larger were made by Buell and Catton BC86 (BC) and by Newell et al. NPS90 using a combination of analytic and numerical methods. BC gave results for a few values of and , and we shall compare our measurements with interpolations between these predictions. We show their results for a Prandtl number close to that of our experiment in Fig. 2. Also shown in that figure are the nearby stability boundaries of infinitely extended uniform straight rolls.CB74 ; BC79 Although in the large- limit it is expected that the zig-zag instability will coincide with the selected wave number,PM81 ; Cr83 ; MP83 it is clear from the figure that is still far from that limit.
To our knowledge there is as yet no prediction of the wave-number selection at the umbilicus itself. The results to be presented here show that the wave number selected there is smaller than the one in the far field.
Aside from the phase pinning mentioned above, the side walls of experimental cells have an additional influence on the pattern. The boundary conditions imposed by the walls can yield a separate and competing selection mechanism.CDHS ; TB88 ; BT89 This mechanism is expected to depend on the conductivity of the side walls relative to that of the fluid, and it is not understood quantitatively for typical experimental conditions. For perfectly conducting side walls, Tuckermann and Barkley TB88 ; BT89 predicted a pattern of radially-traveling waves. The traveling nature of the pattern can be understood in terms of the competition between the selection by the curved rolls on the one hand and by the wall on the other which can lead to a wave-number gradient which in turn can lead to a non-zero time derivative of the phase of the pattern. FNTW2 ; RBWB87 However, to our knowledge such radially traveling waves have not yet been observed in experiments. FNTW ; TBA02
For values not too small the wave numbers predicted for curved rolls do not depend very strongly on . In this range the wave numbers of target patterns have been determined before, KP74 ; CP84 ; SAC85 ; CLPG86 but to our knowledge they were never compared quantitatively with the predictions of BC. Koschmieder and Pallas KP74 determined a weighted average of the wave lengths of all rolls except for the outermost one. In Fig. 3a we show their results for , and for and 916. The solid line is the prediction of Ref. BC86 for . Aside from a lateral shift, the overall shape of a curve passing through the data is very similar to the theoretical curve. Since the data do not extrapolate to as vanishes, the shift presumably is due to experimental uncertainties of the length scales involved in the determination of .
In Fig. 3b we show results from Ref. SAC85 which were for and . These data were obtained by measuring the average wave length of 2 rolls near . They seem to show considerable scatter, but actually this is due to the discreteness of the values of which is noticeable in the figure and which becomes more apparent for this relatively small where the system contains only a small number of rolls. In this system hysteretic transitions were clearly observed. The theoretical curve BC86 for this value (solid line) is a good smoothed representation of the data.
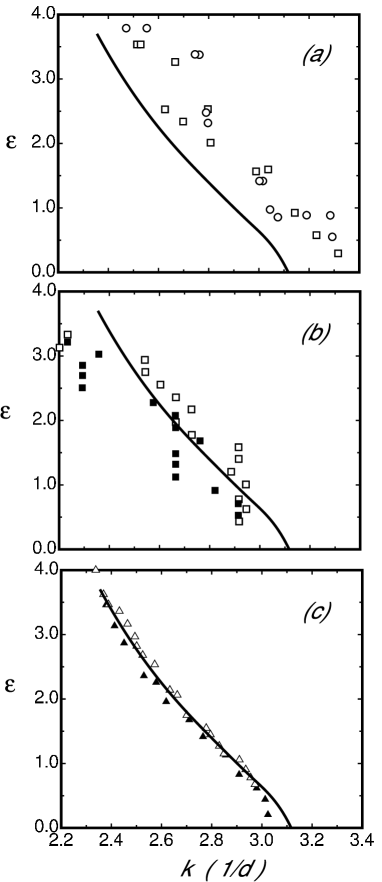
Finally, in Fig. 3c, some of the results reported by Croquette and Pocheau CP84 are shown. Those measurements were for and , and were obtained by measuring the average roll width along a diameter in a region away from the center and sides where the roll width appeared constant. The solid line is the numerical result BC86 for . The agreement clearly is very satisfying. The data do not reveal much difference when is increased (open symbols) or decreased (solid symbols). The authors report observing hysteretic transitions, and thus it is somewhat surprising that this hysteresis does not manifest itself in the wave-number measurements.
All of the previous investigations revealed that the roll adjacent to the side wall was exceptionally wide, but none of the prior investigations made any attempt to determine quantitatively the wave number selected at the wall or at the cell center.
III Experiment
III.1 Apparatus
We used a Rayleigh-Bénard convection apparatus described in detail elsewhere ACBS94 ; MA02 . The top plate was a single-crystal-sapphire disk, and the bottom plate was a polished aluminum disk with a metal-film heater mounted under it to provide uniform bottom-plate heating. Temperature-controlled water was circulated over the top plate. The bottom-plate temperature was controlled to create the desired temperature difference. The mean temperature was maintained at C. For both the top and bottom plate, the temperature varied about the set temperature by less then C.
The cell wall was made of Lexan (thermal conductivity 0.23 W/m K) with an outer diameter of 9.6 cm and an inner diameter of cm. A 0.012 cm diameter manganin wire was embedded in the cell wall to provide the side-wall heating. This wire had a resistance of about 13 , and typically dissipated 0.26 W.
The height of the side wall was 0.229 cm, though the actual fluid height depended on the compression of an O-ring which sealed the cell. The actual fluid height was determined by measuring and then inferring from the fluid properties and the measured C. We found cm, giving an aspect ratio .
The fluid used was methanol which, at C, had a Prandlt number and a thermal conductivity of W/m K. The vertical diffusion time was s.
The convection rolls were imaged using the shadowgraph method BBMTHCA96 ; TC03 . At large , strong spatial variation of the refractive index caused nonlinear optical effects in the images,TC03 but the general features of the pattern could still be discerned. This effect limited our ability to do wave-number measurements for . Nonetheless, the location of the umbilicus could still be measured.
In order to obtain concentric rolls, was set to zero and the side-wall heater-power was set to 0.26 W. After waiting two hours, we increased the temperature difference to C () and allowed the system to equilibrate for one hour. After this the temperature difference was abruptly increased to C () and the system was allowed to equilibrate for two hours. The jump of was necessary because defects typically formed in the interior when the temperature difference was raised gradually. Once concentric rolls were obtained, the temperature difference was adjusted in small steps (typically between C and C) and the system equilibrated for one hour before taking an image at each temperature step. The power supplied by the side-wall heater was kept constant throughout the run.
III.2 Image Analysis
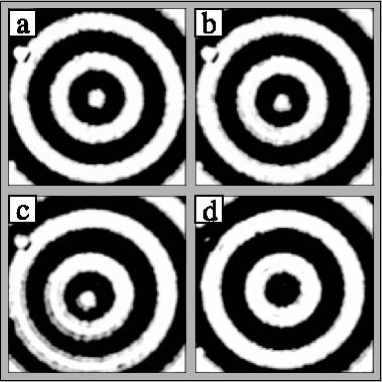
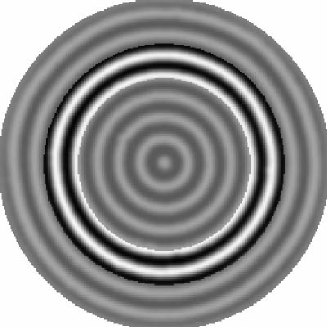
Shadowgraph images of some of the patterns are shown in Figs. 4 and 5. All images were divided by a background image taken at . They were filtered by setting to black (white) all pixels that fell below (above) a certain threshold. A gaussian blur was then applied to the chopped image.
We developed an algorithm to determine the local wave-director field . This method will be described in detail elsewhere. First the orientation field at each point of the image was calculated using a method similar to one introduced by Cross et. al., CMT94 but higher angular resolution was employed. The wave-number field was then calculated at each point by moving orthogonal to the the roll orientation at that point and determining the number of pixels which falls within one wave length, assuming a locally periodic structure.
Determinations of the wave number from the images require a knowledge of and of the horizontal distance between adjacent pixels. The uncertainty of yielded an uncertainty of only a small fraction of a percent. We determined by counting the number of pixels which spanned the sample diameter. This yielded and led to a combined uncertainty of about 2 % for . An extrapolation of the measured -values with decreasing to gave , which is within the experimental uncertainty of the value 3.117 for the infinitely extended set of straight rolls.
We measured the location of the umbilicus by using a square section surrounding the center. The location of the umbilicus was estimated by computing the maximum of the cross-correlation of the measured orientation field and the orientation field for perfectly centered rolls . This estimate was used only to identify the rough location of the umbilicus. Once the umbilicus was identified, we used an edge-detection algorithm on the umbilicus to determine its position with a resolution of about m or .
IV Results
IV.1 Patterns: Increasing
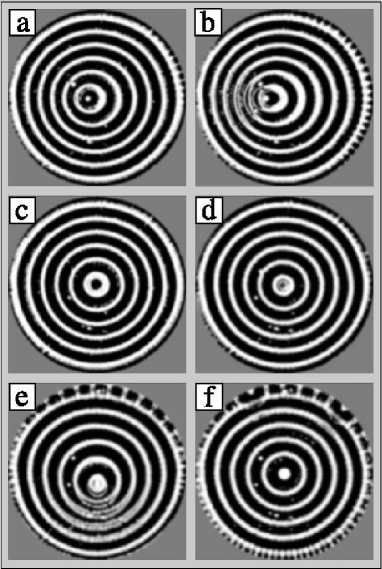
We covered the range and with increasing observed eight transitions at under quasi-static conditions. A closeup view of images near the third transition is shown in Fig. 4. At each transition a roll was lost at the umbilicus. For all but the first transition the umbilicus first moved away from the center as grew. The angle of the umbilicus displacement did not have a preferred value, as can be seen from the examples in Figs. 4 and 5. This indicates that the cell was sufficiently uniform. At the transition the umbilicus collapsed, reducing the number of rolls in the system by one. After a roll was lost, the new umbilicus immediately moved back toward the center of the sample but never quite reached it. This process was analogous to that observed in Refs. CP84 and SAC85 . The umbilicus displacement before each transition produced a noticeable azimuthal variation of the wave number, with higher wave numbers in the direction of the displacement, and lower wave numbers opposite the displacement direction.
Close to but before the sixth transition, for , a patch of cross rolls CB74 ; BC79 formed along the outermost roll on the side opposite the direction of umbilicus displacement. At that point the local wave number of the concentric rolls was the smallest of the entire wave-number field, and was about 1.95 (). The corresponding point in the plane is shown as a solid circle in Fig. 2. The wave number of the cross rolls that formed was about 4.3 . The value of is somewhat larger than the prediction BC79 () for laterally infinite straight rolls at this value of . This suggests that the roll curvature or the side wall reduces the stablity of the rolls against the cross-roll perturbation. The wave number of the cross rolls that formed is larger than the predicted value BC79 . The cross rolls disappeared when was increased further, the pattern lost the middle roll, and the umbilicus returned toward the center. At that point all parts of the pattern had returned to wave numbers safely in the stable Busse balloon. Before the next (seventh) transition, near , cross rolls appeared again. In this case we found =1.86 () and . This point is shown as well in Fig. 2. Again the value of is somewhat larger than the prediction for infinitely extended uniform straight rolls. After this transition the cross rolls fanned out to cover the entire outer roll. Images near the two transitions are shown in Fig. 5.
The cross rolls remained along the outer roll, and after the eighth transition, spread to the inner rolls as was further increased. Despite the cross rolls, there was still a discernible pattern of nearly concentric rolls, with the cross rolls superimposed on these. Around the focus began to move off center but did not complete a ninth transition. This is illustrated in Fig. 6a for . Cross rolls spread to the inner rolls, and as was further increased, the umbilicus returned to the center without losing a roll, as seen in Fig. 6b for .
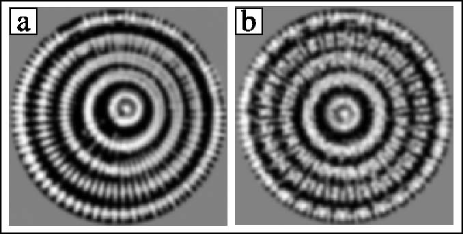
The pattern became time dependent near , where small patches of traveling waves developed. These were superimposed upon and orthogonal to the concentric roll, and traveled along the axes of the concentric rolls. The travelling waves occurred first on the third or fourth roll from the wall, and with increasing spread throughout the cell. We asociate this phenomenon with the oscillatory instability predicted by Clever and Busse, CB74 ; BC79 although for our Prandtl number the cross-roll instability precedes the oscillatory instability.
The cross rolls observed here had been previously seen by Croquette et. al. CP84 , though there are differences in the way they appeared. Croquette et. al. observed that cross rolls moved in from the side wall only after became larger than about 10. They did not observe a relationship between the umbilicus transitions and the cross-roll formation. Despite nearly identical Prandlt numbers and aspect ratios (, ), Croquette et. al. could produce off-center patterns near transitions comparable to those shown in Fig. 5 with no cross rolls CGP86 . In our system cross rolls permanently covered the outer roll for , well before Croquette et. al. first observed any. This difference can perhaps be explained by a difference in the strength of side-wall forcing. A future study of the influence of various levels of side-wall heating should shed some light on this issue.
IV.2 Patterns: Decreasing
The nature of the patterns for decreasing depended on the initial state. When starting above the oscillatory instability (say ), decreasing broke up the concentric rolls. Wall foci evolved, displaced the umbilicus, and emitted new rolls as was further decreased. However, the side-wall forcing was strong enough to re-orient the outermost rolls parallel to the sidewall for . By the outer roll had returned to being completely parallel to the sidewall. However, defects remained in the interior of the pattern, and the system did not return to concentric rolls as was decreased below zero.
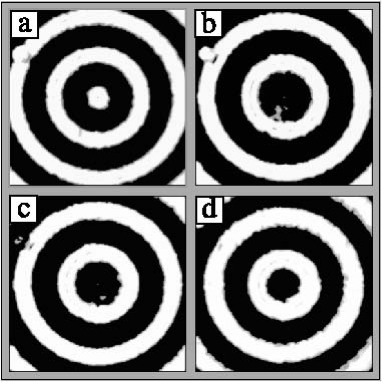
Starting from with concentric time-independent rolls, new rolls were generated at the umbilicus for distinct values as was decreased quasi-statically. During these transitions the umbilicus stayed close to the center, as illustrated in Fig. 7. We did not determine the maximum at which we could start decreasing without loosing the concentric pattern.
IV.3 Umbilicus Displacement
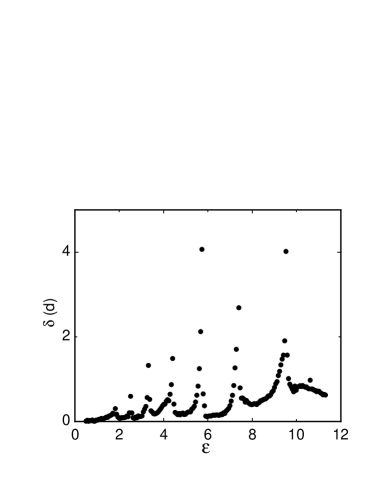
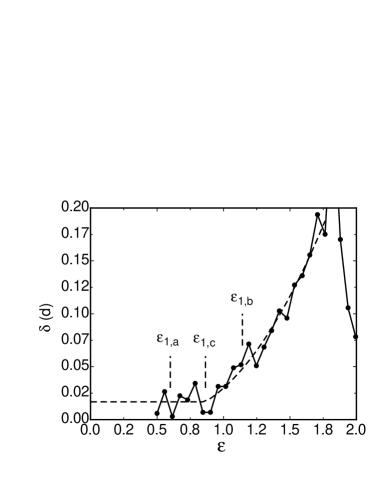
With increasing we measured the displacement of the umbilicus from the center of the cell as a function of for . Results over the entire -range are shown in Fig. 8. A more detailed plot of the results for is shown in Fig. 9. Seven transitions, at , are apparent from these data. At the first transition, at , we did not resolve any discontinuity in . Prior to each observable transition there was a large displacement, followed by a relaxation back toward a centro-symmetric pattern when the umbilicus collapsed.
Figure 10 shows the data for over the range . Here we see that the pattern is, within possible systematic errors of , accurately centered for . Above the increase of is consistent with an initially linear dependence, and thus we fitted the results to
| (4) |
over the range and to for . Here corresponds to the small offset, well within our possible systematic errors, which is found even at small epsilon. The parameters , and were least-squares adjusted. The fit gave , , and . It is shown as the dashed curve in Fig. 10. The statistical error of indicates that a fit to a quadratic equation (i.e. Eq. 4 with ) should be equally good. It yielded and . We identify as the focus instability, i.e. as the first instability of the centro-symmetric pattern with our prevailing wave number and our Prandtl number .
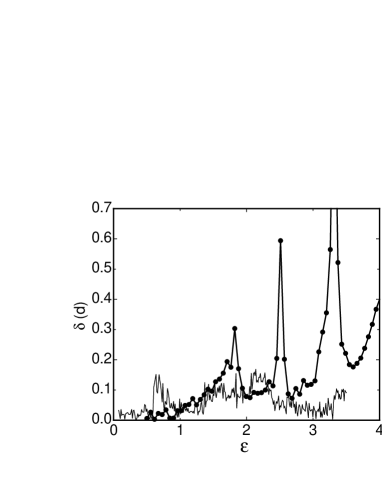
When was decreased, transitions involving the addition of a roll at the umbilicus occurred at , but were not associated with large displacements of the umbilicus. Experimental results for with decreasing are shown by the thin solid line in Fig. 9. This difference between increasing and decreasing was observed also by Steinberg et. al. SAC85 .
IV.4 Wave-Number Measurements
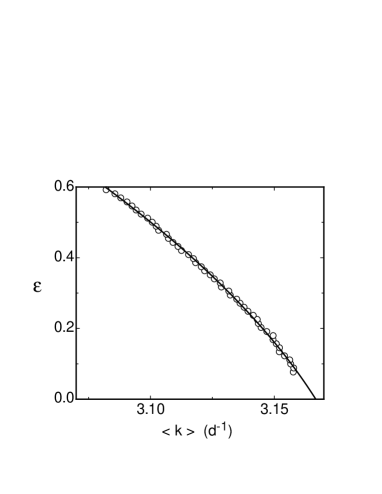
We measured the averaged wave numbers for for both increasing and decreasing . For comparison with theoretical predictions one would like to make this measurement well away from the umbilicus; in practice there is a limit set by the aspect ratio of the sample and by a competing selection mechanism associated with the side wall. As we shall discuss below, the local wave numbers have a maximum at a radial position in the range (). Thus we selected an annular region extending over this radial range as illustrated by the highlighted region in Fig. 11 to compute . In Fig. 12 the results obtained with decreasing and relatively small are shown. The solid line is a fit of the equation
| (5) |
to the data over the range . The fit yielded , , and . The result for , within the a priori estimate of the experimental uncertainties, agrees with the theoretical value for infinitely extended straight rolls. The result for is shown in Fig. 1 as an open circle. It falls slightly above the predicted value .
Results for over the entire range are shown in Fig. 13 for both increasing (open circles) and decreasing (solid circles) . Within experimental uncertainties they are consistent with previous measurements for similar . SAC85 ; CP84 . The jumps in the wave number correspond to the loss or creation of a roll at a transition. The hysteresis in the wave-number selection, previously observed by others, SAC85 ; CP84 is clearly visible in our results. It indicates partial pinning of the phase of the pattern at the umbilicus. We believe that this phase pinning is responsible also for the difference between experiment and theory for the value of . On average the data are in excellent agreement with the calculations by Buell and Catton BC86 which are given by the solid line through the data.
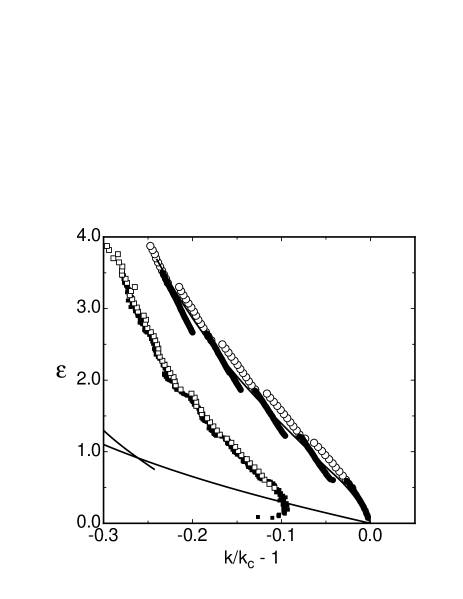
.
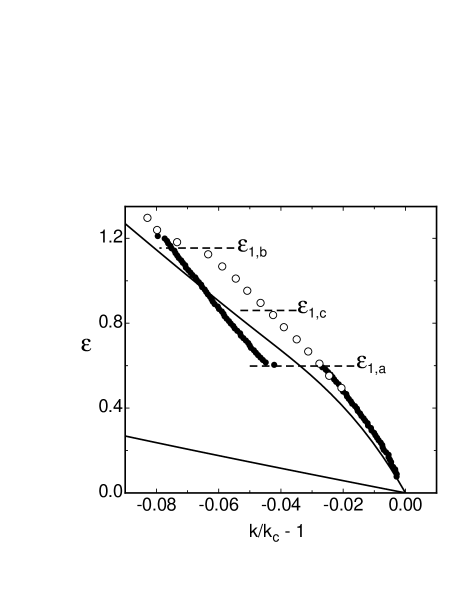
In order to illustrate the relationship between the first hysteretic transition at and and the focus instability at , we give an expanded view of the selected wave numbers at small in Fig. 14. One sees that the discontinuities at and are quite sharp, and that is located near the middle of this first hysteresis loop. Values of and for all eight transitions are given in Table 1.
| 1 | 0.598 | 1.154 |
|---|---|---|
| 2 | 1.217 | 1.841 |
| 3 | 1.858 | 2.528 |
| 4 | 2.660 | 3.330 |
| 5 | 3.6 | 4.437 |
| 6 | 4.8 | 5.759 |
| 7 | - | 7.368 |
| 8 | - | 9.552 |
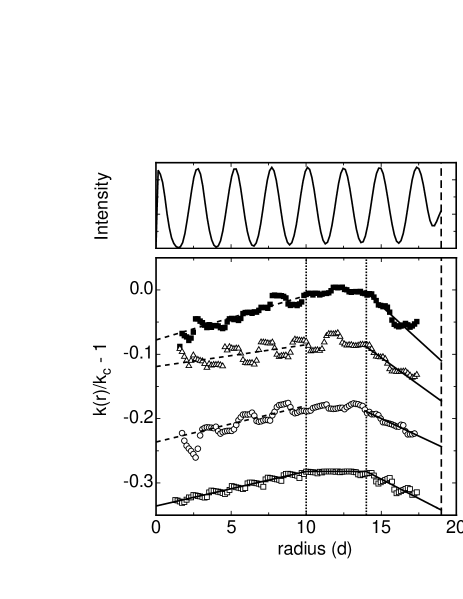
The top part of Fig. 15 gives an example for the radial variation of the shadowgraph intensity. In the bottom part we display the radial variation of the azimuthal average of for three values. Also shown for comparison (bottom curve, down-shifted by 0.1) is the result of our analysis for a synthetic pattern of concentric rolls with a radial wave-number distribution shown by the solid line which represents a smooth curve through the results for .
Our analysis yields results for which oscillate as a function of . This is particularly noticeable for below the maximum of . These oscillations are not present in the analysis of a synthetic concentric pattern with a uniform wave number, but as shown by the lowest set in Fig. 15, they do appear in the analysis of a concentric pattern with a radial wave-number distribution equal to the smooth curve through the data for . Thus we regard them to be an artifact of the numerical procedures. We note, however, that the amplitude of the oscillations is only about 0.5% of , and that a smooth curve through them is a good representation of the actual wave numbers.
From Fig. 15 one sees that the experimental data for , as mentioned above, have a maximum in the range , and this range was used to compute . For the data were fitted by straight lines as shown in the figure, and these fits were used to extrapolate the selected to . The results for are shown in Fig. 13 above. They show, as noted by others, KP74 ; CP84 ; SAC85 that the outermost roll has an anomalously large wave length (small wave number). We note that is not influenced significantly by the transitions at the umbilicus. Interestingly, the wall-selected wave number does not extrapolate to as vanishes. Instead, it crosses the zigzag instability-line of the laterally infinite system; but in the experiment for this finite system no instability was observed. We are not aware of any quantitative previous measurements or predictions for .
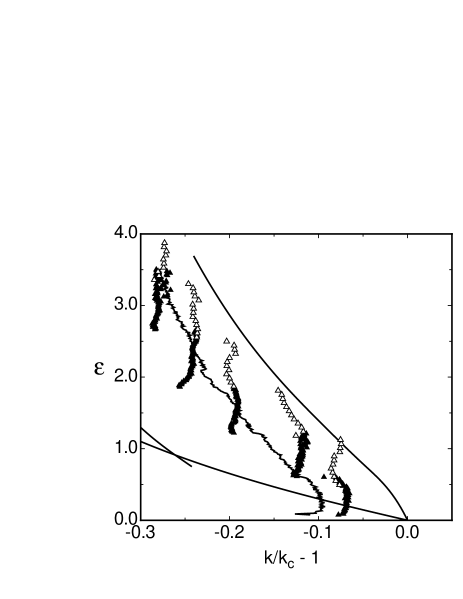
The experimental results at small suggest that yet another unique wave number is selected by the umbilicus itself. Fits of straight lines to the data, this time with , could be used to estimate the selected values at . The results are given in Fig. 16. For comparison we show in that figure also the prediction for the concentric-roll selection BC86 (smooth solid line) and the experimental results for (jagged line). One sees that is influenced strongly by the hysteretic transitions at the umbilicus. At large is on average close to the result for , but as decreases, is somewhat larger and tends toward an intermediate value somewhere between and as . Also for there appear to be no previous measurements or predictions.
V Conclusion
We studied Rayleigh-Bénard convection of a fluid with a Prandtl number in a cylindrical container of aspect ratio in the presence of static side-wall forcing. Patterns of concentric rolls were obtained, and we studied the quasi-static evolution of these patterns for both increasing and decreasing .
For increasing , over a range , the pattern underwent eight transitions where the middle roll moved off center and then disappeared as was increased quasi-statically. We measured the displacement of the umbilicus for . Above the pattern became time dependent with oscillating rolls traveling along the axis of the concentric rolls.
For decreasing , the concentric-roll pattern was lost when the initial was too large. When was decreased from a moderate initial value, the concentric-roll pattern remained and new rolls nucleated at the umbilicus. Any umbilicus displacement preceding the nucleation of new rolls was modest, in sharp contrast with the behavior of the pattern for increasing .
Using new image-analysis techniques, we determined the wave-number field for . From this we computed the azimuthal average . There was a very noticeable radial gradient of both near the side wall at and near the center at . Averaging the wave-number field over the annulus where was relatively constant, we obtained an average wave number . We found that was discontinuous and hysteretic at the transitions where new rolls were formed or disappeared at the umbilicus. Nonetheless, a smooth curve through the data agreed well with predictions BC86 ; NPS90 for the wave-number selection in the far field of concentric rolls. These average wave numbers were also consistent with previous work by others. SAC85 ; CP84 Near the wall and near the center the measured were extrapolated to and to to obtain the wave numbers and selected by the wall and the umbilicus. We are not aware of previous measurements or predictions for these quantities.
VI Acknowledgment
We are grateful to Worawat Meevasana for his guidance during the early stages of this experiment, and to W. Pesch for stimulating discussions. This work was supported by US National Science Foundation Grant DMR02-43336.
References
- (1) For a review of stability analysis of RBC, see for instance S. Chandrasekhar, Hydrodynamic and Hydromagnetic Stability, (Oxford University Press, London, 1961).
- (2) A. Schlüter, D. Lortz, and F. Busse, J. Fluid Mech. 23, 129(1965).
- (3) See, for instance, E. Bodenschatz, W. Pesch, and G. Ahlers, Annu. Rev. Fluid Mech. 32, 709 (2000).
- (4) Perhaps the most convincing evidence for parallel straight rolls is found in the experiments of Ref.BMCA99 where the effect of side walls on the pattern was minimized by introducing a radial ramp of the cell spacing near the cell wall which gradually reduced the convection amplitude to zero as the wall was approached.
- (5) K.M.S. Bajaj, N. Mukolobwiez, N. Currier, and G. Ahlers, Phys. Rev. Lett. 83, 5282 (1999).
- (6) L. Koschmeider and S. Pallas, J. Heat Mass Trans. 17, 991 (1974).
- (7) V. Croquette, A. Pocheau. Cellular Structures and Instabilities, edited by J. E. Wesfried and S. Zaleski (Springer-Verlag, Berlin, 1984), p. 104.
- (8) V. Steinberg, G. Ahlers, and D. Cannell, Phys. Scr. 32, 534 (1985).
- (9) V. Croquette, P. Le Gal, A. Pocheau, and R. Guglielmetti, Europhys. Lett. 1, 393 (1986).
- (10) V. Croquette, P. Le Gal, and A. Pocheau, Europhys. Lett. 1, 393 (1986).
- (11) Y. Hu, R. Ecke, G. Ahlers, Phys. Rev. E 48, 4399 (1993).
- (12) A.C. Newell, T. Passot, and M. Souli, Phys. Rev. Lett. 64, 2378 (1990); J. Fluid Mech. 220, 187 (1990).
- (13) R.M. Clever and F.H. Busse, J. Fluid Mech. 65, 625 (1974).
- (14) F.H. Busse and R.M. Clever, J. Fluid Mech. 91, 319 (1979).
- (15) M.S. Heutmaker and J.P. Gollub, Phys. Rev. A 35, 242 (1987).
- (16) M. Cross, D. Meiron, and Y. Tu, Chaos 4, 607 (1994).
- (17) D.A. Egolf, I.V. Melnikov, and E. Bodenschatz, Phys. Rev. Lett. 80, 3228 (1998).
- (18) L.S. Tuckerman and D. Barkley, Phys. Rev. Lett. 61, 408 (1988).
- (19) D. Barkley and L.S. Tuckerman, Physica D 37, 288 (1989).
- (20) Y. Pomeau and P. Manneville, J. Phys. (Paris) 42, 1067 (1981).
- (21) M.C. Cross, Phys. Rev. A 27, 490 (1983).
- (22) P. Manneville and J.M. Piquemal, Phys. Rev. A 28, 1774 (1983).
- (23) J. Buell and I. Catton, Phys. Fluids 29, 1 (1986).
- (24) M.C. Cross, P.G. Daniels, P.C. Hohenberg, and E.D. Siggia, Phys. Rev. Lett. 45, 898 (1980); J. Fluid Mech. 127, 155 (1983).
- (25) Traveling waves induced by two competing selection mechanisms have been studied RBWB87 in a one-dimensional system terminated at the two ends by two different kinds of ramps of the Rayleigh number.
- (26) I. Rehberg, E. Bodenschatz, B. Winkler, and F. H. Busse, Phys. Rev. Lett. 59, 282 (1987).
- (27) Inward-traveling concentric rolls have been reported in Ref. TBA02 , but for a probably unrelated case of convection in the presence of rotation about a vertical axis with periodic modulation of the angular velocity.
- (28) K.L. Thompson, K.M.S. Bajaj, and G. Ahlers, Phys. Rev. E 65, 046218 (2002).
- (29) G. Ahlers, D.S. Cannell, L. Berge, and S. Sakurai, Phys. Rev. E 49, 545 (1994).
- (30) W. Meevasana and G. Ahlers, Phys. Rev. E 66, 046308 (2002).
- (31) J. Bruyn E. Bodenschatz, S. Morris, S. Trainoff, Y. Hu, D. Cannell, and G. Ahlers. Rev. Sci. Instrum. 67, 2043 (1996).
- (32) S.P. Trainoff and D.S. Cannell, Phys. Fluids 14, 1340 (2003).