The dynamics of opinion in hierarchical organizations
Abstract
We study the mutual influence of authority and persuasion in the flow of opinion. Many social organizations are characterized by a hierarchical structure where the propagation of opinion is asymmetric. In the normal flow of opinion formation a high-rank agent uses its authority (or its persuasion when necessary) to impose its opinion on others. However, agents with no authority may only use the force of its persuasion to propagate their opinions. In this contribution we describe a simple model with no social mobility, where each agent belongs to a class in the hierarchy and has also a persuasion capability. The model is studied numerically for a three levels case, and analytically within a mean field approximation, with a very good agreement between the two approaches. The stratum where the dominant opinion arises from is strongly dependent on the percentage of agents in each hierarchy level, and we obtain a phase diagram identifying the relative frequency of prevailing opinions. We also find that the time evolution of the conflicting opinions polarizes after a short transient.
pacs:
87.23.Ge,89.75.HcI Introduction
The exchange of opinions plays an essential role in decision making at all levels of social activities, from domestic matters within the family, through business at all scales, to political issues affecting a nation. The dynamics of opinion formation and transmission, as well as the generation of consensus has attracted the attention of mathematicians and physicists. This is probably due to the fact that the emergence of a collective state is a feature reminiscent of the behavior of many-particle systems in the fields of physics, chemistry and biology. Therefore, the formation of public opinion has been the subject of a number of recent works that, to some extent, capture the fundamental processes that determine the emergence or not of consensus within a population weisbuch02 ; stone61 ; hegselmann02 ; laguna03 ; laguna04 . In Refs. weisbuch02 ; stone61 the condition to reach consensus in well mixed populations is analyzed. Additional results of similar models have been shown in Refs. laguna03 ; laguna04 , such as the relevance of the dynamical time scale on the formation of minorities and the role of a complex topology in the contact network. A more general class of models has been studied in Refs. hegselmann02 , in systems of completely connected agents. Though, there is a feature —not analyzed in those contributions— that plays and important role in many social systems, and which certainly affects the dynamics of the propagation of opinion: hierarchy. A hierarchical organization characterizes many social institutions, ranging from families to companies or governments, armies or churches. The emergence of a hierarchical structure in social networks is, by its own, the subject of related studies, such as those found in bonabeau95 ; stauffer03 ; boguna03 ; copelli02 . In a hierarchical system, the interaction between two individuals is asymmetric if one of them belongs to a higher level of the hierarchy. Consequently, it can exploit its authority to impose its opinion to the other one, regardless of the actual value of this opinion. Nevertheless, the lower levels of the hierarchy may well be able to impose their opinion to the higher ones, if they are persuasive enough. The situation is, to some extent, similar to ecological systems involving competition between species that display different colonization capabilities: the worse competitor may thrive if it is a better colonizer tilman94 .
The purpose of the present paper is to propose a simple model for the flow of opinions in a hierarchical social system. In this model, the agents are organized in a hierarchy that determines their degree of authority in any pair interaction. Besides, each agent is endowed with a persuasion ability that may allow it to convey its opinion to another agent, even against authority.
II Model
We consider a population of interacting agents, each of them characterized by its opinion, its persuasion capability and belonging to an authority stratum. While the opinion can be changed through interactions between agents, the authority and the persuasion are assumed to be invariable. The agents are distributed in a hierarchy of authority levels enumerated from (lowest authority) to (highest authority). We call , with , the fraction of the population that belongs to each level of the hierarchy. We assign to each agent a value of persuasion, , chosen at random between and . Initially each agent has its own opinion which is represented by its index, from to , i.e. .
Since we are interested in the study of a population in which the hierarchy imposes rules of interaction, persuasion is not the only way to convince an agent. Indeed, agents with very different authority levels do not have a symmetric interaction. We model this fact by allowing an agent to convince another one only if the authority of the convincer is higher, equal to, or one authority level lower than that of the partner.
At each time step we pick an agent () at random which will try to convince a partner by imposing its value of opinion. The second agent is selected at random from the same or a lower level or the immediately upper one (). The interaction between agents is as follows: agent tries to convince agent using first its persuasion, in such a way that the opinion of will become that of , i.e. , with probability . If persuasion fails, agent will try to impose its authority: if then ; otherwise, no change occurs. The final result of this process is a consensus of opinions. This means that in the stationary state all agents share the same opinion. The value of the resulting dominant opinion identifies the agent that has convinced the whole population, which we call the leader.
II.1 Numerical simulations
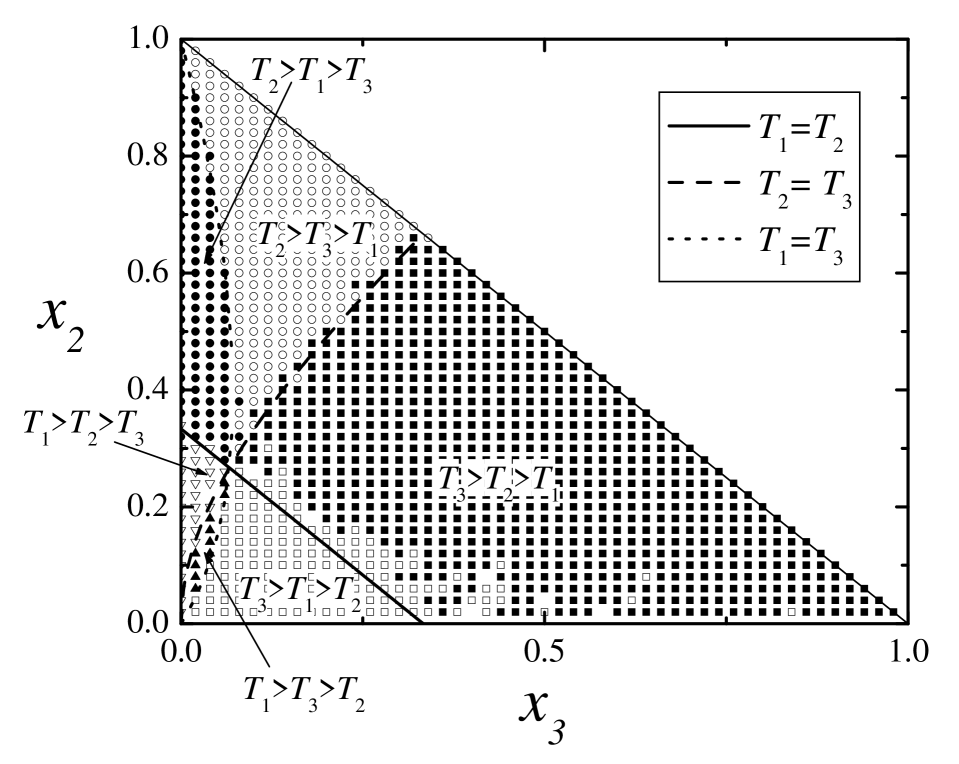
We perform numerical simulations for an hierarchy, which is the minimum number of authority levels that gives nontrivial results and also allows us to build a two dimensional diagram. We set the fraction of agents in each level of authority and assign their values of persuasion at random. For all the initial conditions and random number sequences studied, the simulations always arrive to a final state where all the agents share the dominant opinion. It is worth to emphasize that for a given allocation of agents among the authority strata, the values of the persuasion are attributed at random, therefore the leader can belong to different authority levels for different initial conditions. Then, for characterizing the leader’s origin we consider an ensemble of samples and perform an average over them. In Fig. 1 we plot typical results for a system of agents and samples. The horizontal axis indicates the fraction of the total population that has the maximum authority, , whereas the vertical axis measures the fraction of agents in the intermediate level of authority, . The label represents the fraction of samples in which a member of the -th level becomes the leader. In region labeled with the most frequent leader belongs to the -th level of authority, followed by leaders from the -th level. One can observe that in a large amount of this phase space (filled with squares) the leader belongs to the highest authority group, as it is expected. However, when the fraction of agents in the top level is below , the intermediate stratum may impose one of their opinions (region indicated by circles). Finally, when there are very few top authority agents and a fraction of intermediate agents lower than , the opinion of the lowest stratum may overpower the top ones (region indicated by triangles). The lines in the figure separate different regions obtained by means of analytical results that we discuss in the next subsection.
Furthermore, to complete the characterization of the phase space, we plot in Fig. 2 a map of the average persuasion of the leader agent corresponding to the points of the diagram of Fig. 1. The smallest dots correspond to an average persuasion whereas the largest ones correspond to . We remark that the darkest regions in the diagram correspond to situations where most of the population has the same value of authority. This diagram reflects two facts: a) when the majority of the agents has the same authority, one of the more persuasive becomes the leader —even the agents with the highest authority need a persuasion above the average to impose their opinion— and b) in the region where all levels have similar population, the authority prevails over the persuasion, although the average value of the leader’s persuasion is bigger than the average persuasion over the population ().

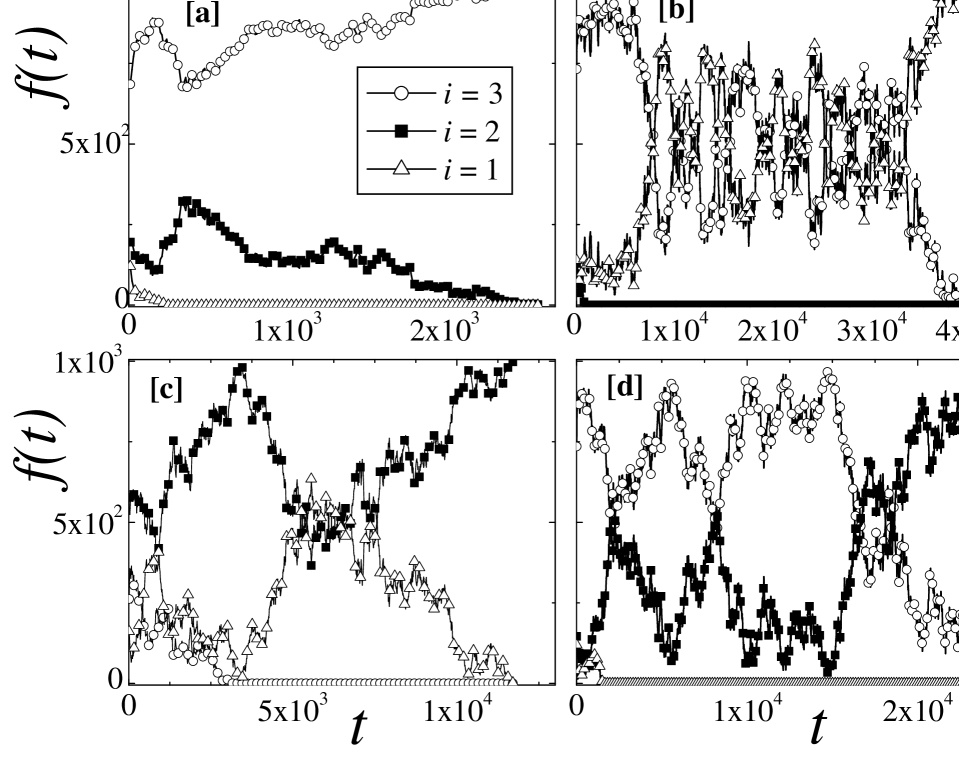
Whereas the phase diagram shown on Fig. 1 tells us which is the authority stratum from where the leader comes, the examination of the time evolution that leads to this final state may improve the comprehension of the mechanisms involved. Since we know the authority level from which each opinion comes from, we can follow the evolution of the number of agents that share an opinion corresponding to each stratum. This temporal evolution is shown in Fig. 3, for a system of agents. Each curve corresponds to the number of agents sharing the opinion of an agent belonging to the highest authority level (circles), intermediate level (squares) and lowest level (triangles). Each plot corresponds to a different sample with the same distribution of population in the three levels, , and . In these figures we do not distinguish between different opinions within a given authority level. We observe that, after a short transient, the system becomes polarized. Agents belonging to one of the authority strata are convinced by agents by one of the other two levels. So, opinions originated in this stratum quickly disappear, while agents in the other two levels keep struggling for a longer period (see, for example, in Fig. 3[b] the struggle between level vs. level ). The final result depends on the sample: while in Fig. 3[a] an agent from level becomes the leader, in Fig. 3[d] the leader comes from level . It is remarkable that in Fig. 3[c] the fight is between the two lower levels, while the opinion of the highest one disappears after a relatively long transient. This polarization seems to be a verification of what happens in many election contests when the public opinion converges to the two strongest candidates.
II.2 Mean field analytical solution
A simple model for this system can be solved within a mean field approximation. As we are mainly interested in the authority stratum where the leader comes from, we consider that all the agents in a given level have the same opinion, i.e., there are only as many opinions as authority levels. This is equivalent to first “thermalize” the opinions within each authority stratum before to put them in interaction. This last process allows individuals to pass from one opinion group to the other.
The mean field approach implies that at each time step we compute the averages of the quantities of interest, which in turn depend only on their averages in the preceding steps. We are interested in obtaining the average number of agents in the different opinion groups. It is clear that, although initially opinion groups and authority groups coincide, as the system evolves each opinion group will have members with different levels of authority. If we call () the subgroup that contain agents with authority and opinion , the dynamics of the system can be fully described by studying the evolution of , which is the population, at time , of the subgroups .
To perform the mean field calculation, we assume that two agents, belonging to authority levels and , are chosen at random. The agent in convinces the agent in with probability . That is, there will be a transition from the group to the group with probability , where is the opinion originally held by the agent in and is the opinion it adopted (that of the first agent). Notice that the opinion of the first agent is not affected by the dynamics.
The model introduced in Section II.1 corresponds to the case where for . When the relation between the authority levels does not rule out the interaction, one must consider two cases: and . In the first case, the agent in always changes its opinion because its authority level is lower than ; thus, . For we assume that the effect of persuasion is averaged out in the population of each level, and therefore is simply the average of the persuasion of the agents in level . Thus, for a uniform distribution of persuasion (as considered in the simulations above), we have that for . The fact that the matrix does not change in time implies that, neglecting finite size effects, the distribution of persuasion in each subgroup remains unaltered. This assumption only holds if the initial distribution is the same in each subgroup. In our model this is the case, because the interaction does not depend on the persuasion of the agent who (eventually) changes its opinion. Then, the probability that it leaves the subgroup does not depend on his own persuasion.
Since the dynamics cannot change the total number of agents in each level of authority, there are constraints: , for all , where is the fraction of agents with authority index , as defined previously.
By considering, at time , the probabilities that members of groups other than enter or leave this group, one can write the evolution equation for all the subgroups. Let be the vector of populations of the opinion group . Its time evolution is given by (see Appendix):
| (1) |
where is the identity matrix, and the matrix is given by:
| (2) | |||||
| (3) |
Notice that the matrix is not symmetric. Moreover, it has only negative or null eigenvalues because the population of each opinion group must remain bounded. Indeed, it has one null eigenvalue, corresponding to the eigenvector . This is evident from the fact that the number of agents in each authority group must be conserved: . Except for very special values of the parameters, this will be the only eigenvector corresponding to the null eigenvalue note .
For large values of equation (1) can be written as:
| (4) |
where . To obtain an expression independent of the number of agents we rescale the time, .
As a consequence of the fact that has only one nonnegative eigenvalue, the calculation of the asymptotic populations of each subgroups is an easy task: in the limit , the evolution matrix has only one non-vanishing eigenvalue, whose value is 1. Thus, , where is a matrix whose only non-zero element is , is the matrix of right eigenvectors of and is the matrix of its left eigenvectors. As we need only the eigenvectors corresponding to the non-zero eigenvalue and, as it was mentioned above, its right eigenvector is already known, we only have to calculate the left eigenvector; i.e. such that . This eigenvector is very easily obtained by taking the vector product of any columns of the matrix . With this procedure, is obtained up to a multiplicative constant which can be calculated by imposing the restriction that the sum of all populations is equal to . Consequently, the asymptotic populations are given by:
| (5) | |||||
| (6) |
We have studied in detail the case and determined a phase diagram by varying the fraction of agents in authority levels and , as in Fig. 1. Our first example is designed to compare with the previous numerical results: while agents with the highest level of authority can fully influence the lowest, the opposite interaction is not allowed, i.e. and . The analytical results are plotted together with the numerical ones on Fig. 1. The final state of the system, in the mean field approximation, is a coexistence of opinions, where their relative weights are equivalent to the frequencies of leader opinions in the simulation (averaging over a large number of individual samples). Therefore, the label must be interpreted as representing the fraction of agents that endorses the opinion in the asymptotic limit and, similarly, means that, in this region, the prevailing opinion corresponds to the -th authority level, followed by the opinions from -th and -th levels. It is interesting to notice that, even in this extreme case, there are values of the parameters for which the lowest authority opinion can become the prevailing one. It is also remarkable the agreement between analytical results (indicated by lines in the diagram) and numerical ones (indicated by geometrical symbols). Indeed, almost all the phase separations coincide, with the only exception of the transition from to . In this case, the difference is restricted to the second placed in the ranking of opinions where there is a significative shift in the frontier line. This can be due either to a lack of statistics in the simulations, given that the line is not well defined, or to a limitation of the mean field approach.
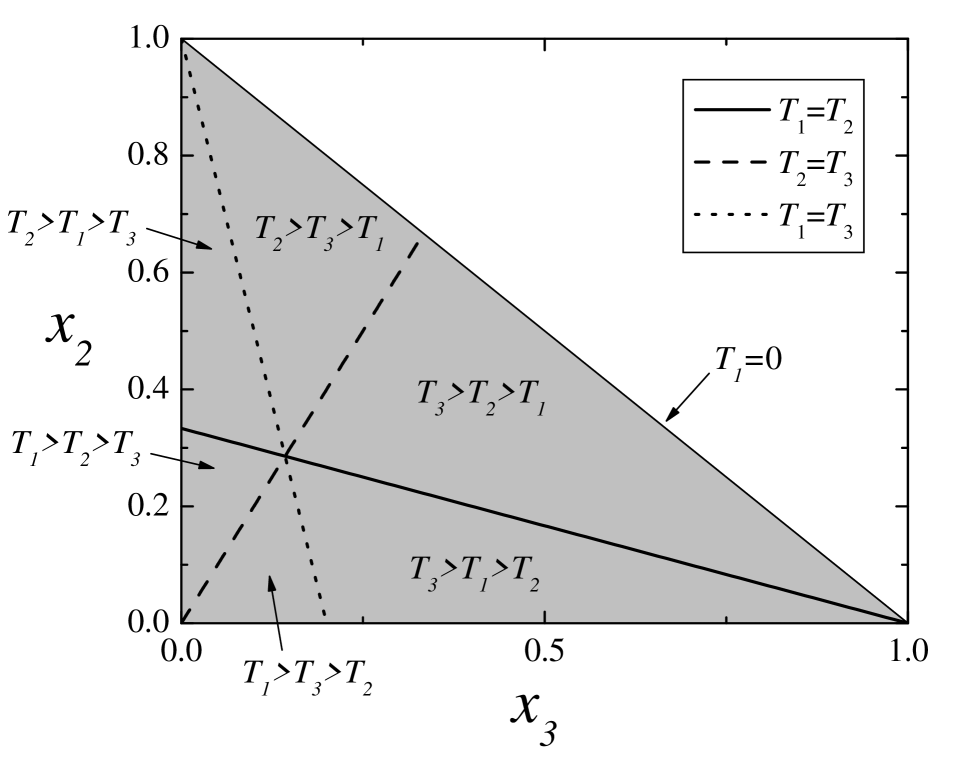
As a second example, we consider the case where the highest and lowest levels of authority cannot communicate, i. e., . To take into account the influence of authority, we consider that an agent will convince another with a lower authority, but the opposite will only happen with probability : , . The results are shown in Fig. 4. Notice that if the intermediate level is not populated no evolution is possible. When comparing the results of Fig. 4 with those of the previous case we observe some qualitative changes in the transitions lines and . Both changes happen in the region of small , that is small population of the intermediate level.

As a final example, we allow the highest authority to fully influence the lowest () while the opposite happen in only half of the interactions (). The corresponding phase diagram is shown in Fig. 5, where we verify that the resulting effect is an increase in the influence region of the lowest level for low and an increase of the influence of the highest authority level for high .
III Conclusions
We have described a simple model of opinion formation in a society where both persuasion and authority are considered. The model has the advantage of having an analytical mean field solution that exhibit a fair coincidence with the numerical results. We have concentrated in the three-authority level case as it is the one with the minimum number of levels permitting to explore the hypothesis of the model. Also, in this case, we are able to plot the results in a two-dimensional phase diagram.
When the higher authority level can impose its opinion on all the others (Fig. 1) it is clear that its opinion prevails up to the case when just a small fraction of the population belongs to this level, providing that the population of the intermediate level is also small. As the intermediate level acts as a transmitter, when the fraction of occupation of this level increases it is the opinion of the lowest one that becomes the leader. Only when the percentage of occupation of the intermediate level is bigger than the opinion of the intermediate level prevails. The results make explicit the importance of the “middle class” as a transmitter to modify the ruling opinions. Moreover, the diagram of Fig. 2 suggest that even among the agents belonging to the highest authority group, the persuasion determines who will impose its opinion.
The other cases studied (Figs 4 and 5) show that either cutting the direct communication between the highest and lowest levels, or by letting the lowest level to persuade the upper one, the influence of this lowest stratum of the population is highly boosted, generally at the expenses of the intermediate one.
The model can be improved by considering the stubbornness (resistance to change its opinion) of the agents, as well as the social mobility that will permit a successful persuading agent to go to higher authority strata. We are conducting studies in these directions, as well as considering a higher number of levels in the hierarchy.
IV ACKNOWLEDGMENTS
M. F. Laguna thanks the Solid State Group of Centro Atómico Bariloche for the use of computational facilities and the hospitality of the Instituto de Física, Universidade Federal do Rio Grande do Sul, Porto Alegre, Brazil. S. Risau-Gusman acknowledges support from the Centro Latinoamericano de Física. G. Abramson acknowledges support from Fundación Antorchas (Argentina). J.R. Iglesias acknowledges support from Conselho Nacional de Desenvolvimento Científico e Tecnológico (CNPq, Brazil). The authors thank D.H. Zanette for valuable discussions and acknowledge partial support from CAPES (Brazil) and SETCYP (Argentina) through the Argentine-Brazilian Cooperation Agreement BR 18/00 as well as the hospitality of the Consortium of the Americas for Interdisciplinary Science, University of New Mexico during the final stages of the work.
V Appendix
We assume that there are enough agents in each subgroup to have a uniform distribution of internal variables. At each time step two agents are chosen at random, and only the opinion of the second agent will be changed, according to a rule depending on the authority labels and on the internal variables. On average, this implies that there is a probability that the second agent, of authority , will change its opinion to that of the first agent (of authority ).
In order to obtain the dynamics of the subgroup , we calculate the probability that members of the different subgroups enter and the probability that agents from leave it for different subgroups. Transitions are only possible between subgroups with the same authority index, as this is a fixed variable. But these transitions can be induced from agents from different authority groups.
Let us consider first the transitions induced by agents belonging to the same authority group. The probability of an interaction where one member of convinces a member of (transition ) is , and the result is the addition of one member to . With the same probability the opposite interaction takes place, i. e. one member of convinces a member of , depleting by one. Thus, both fluxes compensate, and they do not influence the dynamics.
When considering transitions induced from different authority groups, the asymmetry becomes manifest. The probability that a member of induces the transition is , whereas the opposite transition, as induced by an agent from happens with probability .
By taking into account all the interactions that add or remove one agent to , we get:
| (7) |
The explicit temporal dependence of the ’s has been left out in order to avoid an overcharged notation. Each positive sum represents the total probability that a transition to is induced by a member of each authority group. Conversely, each negative sum represents the probability that a transition from is induced by a member of each authority group. Grouping terms and using the conditions we obtain:
| (8) |
from where Eq. (1) follows.
References
- (1) G. Weisbuch, G. Deffuant, F. Amblard, J. P. Nadal, Complexity 7, No. 2, 55 (2002).
- (2) M. Stone, Ann. of Math. Stat. 32, 1339 (1961).
- (3) R. Hegselmann and U. Krause, Journal of Artificial Societies and Social Simulation 5, no. 3, 2 (2002).
- (4) M. F. Laguna, G. Abramson and D. H. Zanette, Physica A 329, 459 (2003).
- (5) M. F. Laguna, G. Abramson and D. H. Zanette, Complexity (in the press, 2004).
- (6) G. Deffuant, F. Amblard, G. Weisbuch and T. Faure, Journal of Artificial Societies and Social Simulation 5, no. 4, 1 (2002).
- (7) E. Bonabeau, G. Theraulaz and J.L. Deneubourg, Physica A 217, 373 (1995).
- (8) D. Stauffer and J.S. Sá Martins, arXiv:cond-mat/0308437 (2003).
- (9) M. Boguñá, R. Pastor-Satorras, A. Díaz-Guilera, and A. Arenas, arXiv:cond-mat/0309263 (2003).
- (10) M. Copelli, R. M. Zorzenon dos Santos, J. S. Sa Martins, Int. J. Mod. Phys. C 13, 783 (2002).
- (11) D. Tilman, R. M. May, C. L. Lehman and M. A. Nowak, Nature 371, 65 (1994).
- (12) According to the Frobenius-Perron theorem (as applied to the matrix , this will be the only eigenvector corresponding to the null eigenvalue, provided that is such that opinions are allowed to “flow” to every authority level. This is equivalent to demanding that the evolution cannot be decoupled, which is the case of the evolutions analyzed in this work.