Dispersion of tracer particles in a compressible flow
Abstract
The turbulent diffusion of Lagrangian tracer particles has been studied in a flow on the surface of a large tank of water and in computer simulations. The effect of flow compressibility is captured in images of particle fields. The velocity field of floating particles has a divergence, whose probability density function shows exponential tails. Also studied is the motion of pairs and triplets of particles. The mean square separation is fitted to the scaling form , and in contrast with the Richardson-Kolmogorov prediction, an extended range with a reduced scaling exponent of is found. Clustering is also manifest in strongly deformed triangles spanned within triplets of tracers.
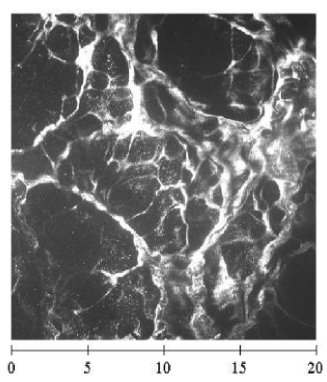
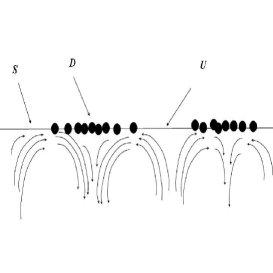
Introduction.— Many processes in nature depend on the efficient diffusion in a turbulent medium such as spreading of drifters on the ocean surface davis1991 ; lacasce2003 or of aerosol particles that can act as nuclei for the formation of rain droplets in the atmosphere facchini1999 ; shaw2003 . If the flow is compressible (or the particles have inertia), the following can occur: stirring an initially uniform distribution of particles can induce them to coagulate, as can be seen in Fig. 1 (left). This photo was taken a fraction of a second after floating particles were uniformly dispersed on the surface of a large tank of water (lateral dimensions 1 m 1 m) that was continuously sustained in a turbulent state by bulk driving. The particles appear in white in this figure. After a few seconds they accumulate in narrow ridges with voids in between, forming a lace-like network.
The origin of the coagulation is apparent in the right panel of Fig. 1. The incompressible fluid below the surface S is shown to be moving upward near point U and downward near point D. The floaters cannot follow the bulk motion; rather they accumulate at points like D and flee points like U. The floating particles move in the plane, which will be taken at . They simply sample the horizontal components of the flow velocity, and , of the incompressible fluid below them. Since water is incompressible, the divergence of the velocity field is zero at all points on the surface and below it, so that , which is non-zero and, in fact, large. Thus the floaters form a two-dimensional compressible subsystem, even though the flow velocity is negligible compared to the speed of sound and their behaviour is unrelated to two-dimensional turbulence goldburg .
Recently, compressible turbulence has come under theoretical scrutiny (see falkovich for a review). Modelling the flow as Gaussian and delta-correlated in time, one can show for both spatially smooth chertkov1998 and spatially rough flows gawedzki2000 , that a transition from a regime of weak to strong compressibility occurs at some threshold value of the dimensionless ratio, defined as
| (1) |
with . Clearly, for any tracers will cluster, but the eventual particle distribution will depend on whether is above or below the threshold. Assumptions contained in those models make it inapplicable to the present experimental situation, where the flow is non-Gaussian and has a finite time correlation. Because the idealizations in those models are not realized in the experiment, we do not know if such a transition from weak to strong compressibility exists in our experiment. On the other hand, a computer simulation (DNS) that roughly matches the flow conditions of this experiment (incompressibility of the three-dimensional velocity field at all , finite correlation time, and a free-slip boundary condition at the flat surface) are in remarkably good agreement with the first experiments goldburg2001 ; eckhardt2001 . Herein, we summarize and extend recent experiments using freshly cleaned water surfaces goldburg2003 .
Our study focuses on two points. The first one is the relative motion of the floaters, with special emphasis on so-called Richardson diffusion richardson1926 , which refers to the time dependence of the mean square particle separation with . Scaling close to the Richardson prediction was found in experiments tabeling99 as well as in high-resolution numerical simulations celani00 in the inverse cascade of two-dimensional incompressible turbulence. Intermittency effects if present seem to modify this exponent only slightly boffetta2002 . Dimensional arguments would seem to be inapplicable for the floaters, since they can exchange kinetic energy and mean square vorticity with the fluid below them. Since a theory for their motion has yet to be developed, one must again turn to computer simulations, which have been recently carried out schumacher2002 .
Secondly, first studies the competing effects of coherent shear and random motion in the surface flow are presented by analyzing the evolution of shapes formed by three particles tracked simultaneously pumir2000 ; castiglione2001 . By neglecting the center of mass, the relative position of three points can be conveniently expressed by the following two vectors, and castiglione2001 . The distortion of a triangle is measured by the ratio which relates its radius of gyration, , to the smaller half-axis, , of the smallest ellipse that covers the tracer triangle. From castiglione2001 we get for two dimensions
| (2) |
We will present measurements of the evolution of as a function of time and propose a qualitative explanation based on the compressibility of the flow.
Experimental setup.— The square tank in which the measurements were made was filled to a depth , which was typically 30 cm, and the turbulence was generated by a variable speed 8 hp pump that circulated the water through a series of pipes capped with rotating jets located well below the surface. The turbulent intensity was limited to keep the amplitude of the surface waves below 1 mm. Images from a fast overhead camera, which typically operated at 300 frames/s, were captured in a computer and analyzed with in-house software. A 5 W diode pumped solid state laser was used to produce a sheet of light illuminating only the surface.
Measurements of the velocity well below the water surface yielded a second order longitudinal structure function in the interval 1.2 mm cm. This is close to the Kolmogorov value of 2/3. On the surface, the outer scale of the turbulence was 3.2 cm. Essential to the success of the experiment was the continuous vacuuming of the surface by a small auxiliary pump connected to a vertical pipe that comes up to the surface. Without this cleaning, which was already reported in goldburg2003 , the particles will begin to interact as their density becomes large, destroying the clustering seen in Fig. 1. The floating particles used in velocity measurements on the surface were hollow glass spheres with radius = 200 m and highly buoyant particles of specific gravity 0.25 with =50 m. The Stokes time, , was roughly 1 s, so that tracers easily follow the flow beneath them ( is the kinematic viscosity). Other particles, such as mushrooms spores and talc were also used successfully.
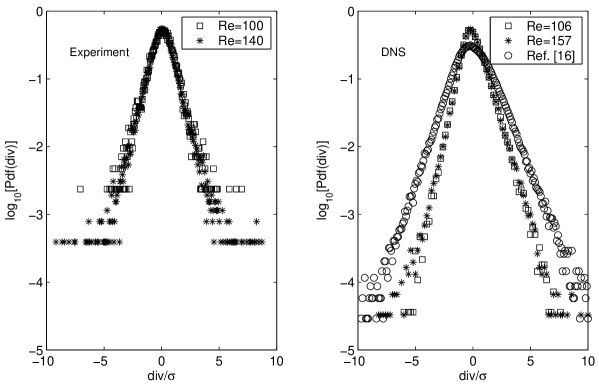
Surface flow divergence.— By tracking the motion of the small surface particles over a short interval of time, one can map out the velocity of the floaters and extract the local surface divergence, , a quantity that will fluctuate in time and space. The two-dimensional divergence is therefore a random variable, whose probability density function (PDF) is plotted in Fig. 2. Those measurements were made at Taylor microscale Reynolds numbers of 100 and 140 (left panel). The relatively large size of the seed particles made it impossible to directly measure velocity differences on a scale less then the Kolmogorov dissipation scale, , which is 0.1 mm. Therefore, the quoted Taylor microscale was determined from gradients measured over a few millimeters.
New experimental data were extracted from an ensemble of measurements made at many instants of time and many points in the surface. Note that the mean value of is close to zero and that this function has exponential tails out to almost four decades in its standard deviation, . Computer simulations of for isotropic forcing schumacher2002 as well as large-scale shear likewise show this exponential behaviour (see the right panel of Fig. 2). Exponential behaviour for the PDF can be expected, because the divergence is composed of velocity derivatives which are known to yield exponential tails in two- and three-dimensions. Note that the slope of the decay of the tails is effected by the details of volume forcing and seems thus to be non-universal. In both the computer simulations and the laboratory experiments, it was found that regardless of the intensity or geometry of the forcing.
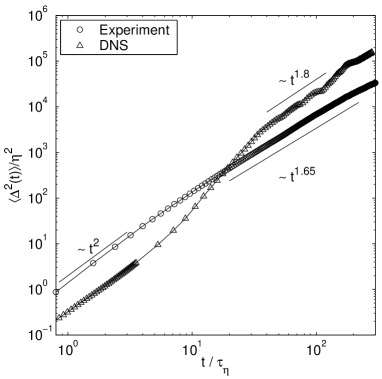
Pair dispersion.— An important characteristic of turbulence is the ability of velocity fluctuations to disperse particles. Figure 3 displays relative diffusion for both laboratory experiments (circles) and computer simulations (triangles). One expects that =3 for an incompressible turbulent flow and times larger than the Lagrangian decorrelation time which is Kolmogorov times, . Instead, both the simulations and the experiments on the present flow show a crossover from 2 to an exponent in the range 1.65 to 1.8. Although the simulations display a small range where the slope is approximately 3.2, the most striking feature of the pair dispersion measurements is a reduced value of the scaling exponent in the inertial-range for both measurements and the simulations.
The reduced reflects a correlated motion of particles within a pair: (i) pair particles remain close together while moving in a big cluster or pair trajectories merge again after longer transient phases of some separation, i.e. their contribution to the growth of with time is small. (ii) on the other hand, decorrelation due to breaking of clusters by newly upwelling fluid or simply large scale separation does appear. This break-up introduces a randomizing element and causes a diffusive Brownian scaling. While the latter mechanism can be found in an incompressible system as well, the first scenario, (i), might be related to the compressibility of the advecting flow. Note that one has to be careful with the interpretation of our results. For large compressibilities, trapping of trajectories can be predicted for the Kraichnan flow analytically gawedzki2000 . Recently, Sokolov performed numerical particle dispersion experiments in a synthetic incompressible flow where the exponent of the spatial scaling of the distance dependent correlation time of the quasi-Lagrangian pair velocity difference could be varied, sokolov01 . For increasing from 0 to 2/3 the exponent of the pair dispersion increased from 3/2 to 3. It is still unclear how the compressibility affects this correlation time scaling although first attempts have been made gawedzki03 . The present resolution of the data prohibits a detailed analysis of this issue for a Navier-Stokes flow.
Experimentally, is determined from measured at . The value of was extrapolated from measurements at larger scales and was found to have a maximum value of 1/80 sec. The measurements of the surface velocity field, , enable determination of the mean square pair separation , where is the pair separation at . It was not possible to accurately track the motion of true floaters over large distances because of the slight vertical motion of the surface and the time-varying illumination it produces. Instead, the measured velocity fields were used to propagate the motion of simulated particles where we checked the robustness of the pair diffusion measurements with respect to variations of the interpolation parameters. Snapshots of the simulated particle fields verify that the structures produced are qualitatively the same as for the real particles seen in Fig. 1. The limited resolution of the data prevented an analysis of higher order moments of the particle density which is another appropriate measure to characterize the clustering (for more details see schumacher2002 ).
Shape distortion of tracer triplets.— In order to further probe the effects of compressibility on flow structure, we investigated the distortion of triangular configurations of floaters . The experimental data for are in the left upper box of Fig. 4 and the simulations are shown in the box to the right. In both cases the particles were initially placed to form equilateral triangles, for which (i.e. and ). The three curves are for triangles of different initial side length.
Pumir et al. pumir2000 argue that coherent shear is responsible for flattening initially equilateral triangles, causing a decrease in . After a sufficiently long time, random small-scale fluctuations tend to drive towards the Gaussian equilibrium value of . In the two-dimensional incompressible case, the experiments show that the Gaussian limit is achieved in roughly 20 castiglione2001 . It was asserted in Ref. pumir2000 that coherent shear should dominate in the viscous subrange and give way to the randomizing effects of turbulent mixing at larger scales.
The measurements and the simulations in Fig. 4 show a strong dip below the asymptotic value of and an extended minimum that exists for triangles initially having a radius of gyration significantly larger than the dissipative scale. This behaviour can be accounted for by strong clustering that is apparent in Fig. 1. The triplets are quickly compressed into quasi-colinear configurations, making almost parallel to which forces , shown in Fig. 4, towards zero (see Eq. (2)). In incompressible turbulence, this effect is absent, and very soon attains its random Gaussian value . The laboratory data attain a value of that is slightly larger than the Gaussian value. The triangles in the computer simulations show an even stronger tendency to remain flat and appear to approach an equilibrium value smaller than . Self avoidance of the finite-size particles and possibly the particle tracking resolution used in the laboratory experiments force a limit on the minimum attainable value of and presumably cause its later growth. In the numerical study (point) particles can become arbitrarily close and thus can remain at a small value well below Gaussian.
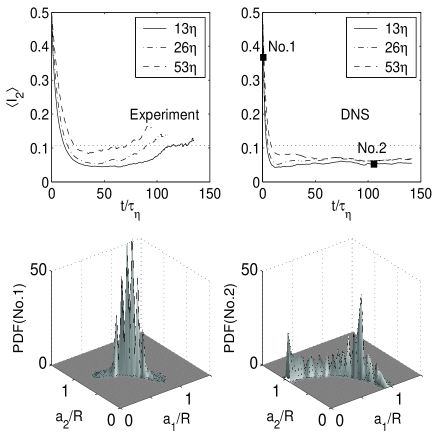
The above results from the computer simulations suggest that the compressibility is acting to flatten triangles, even when is much greater than , contrary to incompressible flows pumir2000 . A dominant number of triangles remain distorted for very long times. This is illustrated in the two lower panels of Fig. 4, which are plots of the joint PDF of the normalized vector magnitudes and . After a short time (lower left panel), the triangles are only slightly distorted, which is reflected by weak scattering about the equilateral value, = . The right panel shows that the triangles have become strongly distorted at a sufficiently later time. Here we observe two peaks ( and vice versa). It is notable that the distribution function is confined within two sharply defined peaks rather than spread widely through the - plane. Laboratory data pertaining to these distributions is not reported here. However the analogous PDF’s have also been measured. The finite size of the particles blocks observation of the peak at = 0 and =1, apparent in the simulations, in the lower right panel of Fig. 4.
In summary, the relative motion of passive tracer particles in our compressible flow is very different from tracer motion in incompressible fluid turbulence. The turbulence creates locally convergent and divergent regions of particle density and inhibits Kolmogorov-Richardson pair dispersion. Likewise, the evolution of geometrical structures, revealed in the motion of particle triplets, strongly differs from incompressible fluids.
Acknowledgments.— Comments by B. Eckhardt and J. Davoudi are acknowledged. This work is supported by the National Science Foundation under Grant No. 0201805 and the Deutsche Forschungsgemeinschaft. Computations were carried out on a Cray SV1ex at the John von Neumann-Institute for Computing at the Forschungszentrum Jülich.
References
- (1) R. E. Davis, Annu. Rev. Fluid Mech. 23 (1991) 43.
- (2) J. H. La Casce and C. Ohlmann, J. Marine Res. 61 (2003) 285.
- (3) M. C. Facchini, M. Mircea, S. Fuzzi and R. J. Charlson, Nature (London) 401 (1999) 257.
- (4) R. A. Shaw, Annu. Rev. Fluid Mech. 35 (2003) 183.
- (5) H. Kellay and W. I. Goldburg, Rep. Prog. Phys. 65 (2002) 845; P. Tabeling, Phys. Rep. 362 (2002) 1.
- (6) G. Falkovich, K. Gawȩdzki and M. Vergassola, Rev. Mod. Phys. 73 (2001) 913.
- (7) M. Chertkov, I. Kolokolov and M. Vergassola, Phys. Rev. Lett. 80 (1998) 512.
- (8) K. Gawȩdzki and M. Vergassola, Physica D 183 (2000) 63.
- (9) W. I. Goldburg, J. R. Cressman, Z. Vörös, B. Eckhardt and J. Schumacher, Phys. Rev. E 63 (2001) 065303(R).
- (10) B. Eckhardt and J. Schumacher, Phys. Rev. E 64 (2001) 016314.
- (11) J. R. Cressman and W. I. Goldburg, J. Stat. Phys. 113 (2003) 875.
- (12) L. F. Richardson, Proc. R. Soc. London A 110 (1926) 709.
- (13) M.-C. Jullien, J. Paret and P. Tabeling, Phys. Rev. Lett. 82 (1999) 2872.
- (14) G. Boffetta and A. Celani, Physica A 280 (2000) 1.
- (15) G. Boffetta and I. M. Sokolov, Phys. Rev. Lett. 88 (2002) 094501.
- (16) J. Schumacher and B. Eckhardt, Phys. Rev. E 66 (2002) 017303.
- (17) A. Pumir, B. I. Shraiman and M. Chertkov, Phys. Rev. Lett. 85 (2000) 5324.
- (18) P. Castiglione and A. Pumir, Phys. Rev. E 64 (2001) 056303.
- (19) I. M. Sokolov, Eur. Phys. J. B 22 (2001) 369.
- (20) M. Chaves, K. Gawȩdzki, P. Horvai, A. Kupiainen and M. Vergassola, J. Stat. Phys. 113 (2003) 643.