A systematic correlation between two-dimensional flow topology and the abstract statistics of turbulence
Abstract
Velocity differences in the direct enstrophy cascade of two-dimensional turbulence are correlated with the underlying flow topology. The statistics of the transverse and longitudinal velocity differences are found to be governed by different structures. The wings of the transverse distribution are dominated by strong vortex centers, whereas, the tails of the longitudinal differences are dominated by saddles. Viewed in the framework of earlier theoretical work this result suggests that the transfer of enstrophy to smaller scales is accomplished in regions of the flow dominated by saddles.
Two-dimensional (2D) turbulence is a fascinating problem with relevance in areas as wide-ranging as the dynamics of energy transfer in atmospheric and geophysical flows McWilliams94b ; Shivamoggi98a to the basic statistical mechanics of interacting vortices Couder86a ; Benzi92a ; Dritschel95a . Three decades of theoretical and numerical work starting from the seminal ideas of Kraichnan Kraichnan67a ; Kraichnan75a and Batchelor Batchelor69a have provided a picture of 2D turbulence based upon the scaling laws of abstract statistical quantities. This description remains strikingly incomplete. For example, there is still no clear physical understanding of the mechanisms by which energy and enstrophy are transferred between different length scales in a turbulent flow; nor is there a conclusive picture of how the intense coherent structures that dominate the statistics are formed and evolve.
The challenge is to establish a connection between the statistical measures of turbulence and the physical dynamics of the turbulent flow field. In the current work, we demonstrate that by considering correlations between local flow topology Okubo70a ; Weiss91a ; Helman91a ; Vorobieff98a ; Rivera01a and velocity difference probability distributions (PDFs) Frisch95a ; Sreenivasan96a ; Eyink96a ; Smith97a ; Paret98a ; Vorobieff99a , we can make this important connection. The wings of the distributions of the transverse and longitudinal velocity differences are found to be associated with very different structures: vortex centers and saddles, respectively. As a consequence, it will turn out that the transfer of enstrophy must be accomplished near saddle points. This transfer is the result of a topological asymmetry in the turbulent flow manifest in the longitudinal velocity difference PDFs. Furthermore, since the wings of the longitudinal velocity differences are dominated by strong saddles, a complete understanding of intermittency in 2D must include a motivation for the formation of these structures. This powerful technique can be extended to other statistical quantities to infer correlations between flow topology and turbulent dynamics.
Local flow topology is characterized by the four first-order derivatives in the expansion of the vector velocity,
| (1) |
The determinant of this Jacobian matrix,
| (2) |
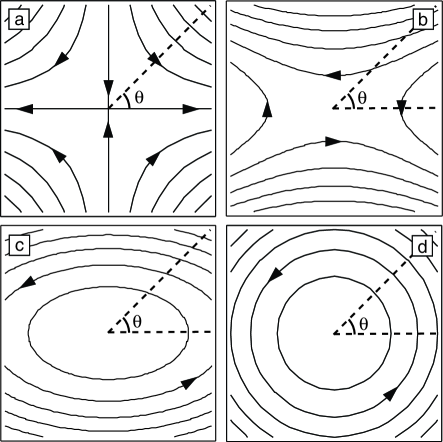
represents a local balance between the vorticity and strain rate. A continuum of structural possibilities exists as the relative magnitude of these terms is varied; from a symmetric saddle when the strain rate dominates; to a linear shear region when the two are of equal magnitude; to an axisymmetric vortex center when the enstrophy dominates; see Fig. 1a-d. Rivera, Wu, and Yeung Rivera01a showed that the probability distribution of the Jacobian determinant is non-analytic at , since centers and saddles are topologically distinct, and asymmetric, with vortex centers being significantly more likely than saddles of comparable strength; see Fig. 2a.
A statistical correlation between the local flow topology and the velocity differences is constructed from data obtained from a 2D flowing soap film experiment, the configuration of which is described in Ref. Rutgers01a with an effective injection scale of 2 cm. The Jacobian determinant at each location is calculated from the matrix, , averaged over a disk, , with center halfway between the two velocity measurements and radius, , equal to . That is, , where
| (3) |
By performing the average in this manner a scale-dependence of the quantity is maintained, allowing the method to probe different regions of the enstrophy cascade. Here, however, we will be reporting results for only one separation, cm. This average over the smaller scales in the flow is permissible in the enstrophy cascade since enstrophy transfer through a given scale depends only on larger scales and not on these smaller structures Falkovich94a .
There is some sensitivity to flow inhomogeneities in this measurement since we are averaging over a macroscopic region of the flow. The inhomogeneity is characterized by a 25% variation in the turbulence intensity across the 2.0 cm wide measurement area. This variation is due to the particular turbulent forcing mechanism used (a pair of combs arranged in an inverted wedge Rutgers98a ). Nevertheless, over a 0.28 cm wide stripe down the central region of the channel where we gather statistics the turbulence intensity varies by less than 1%. Further, a simple line average between the two points at which the velocity is measured—less affected by cross-stream inhomogeneity—produced the same results.
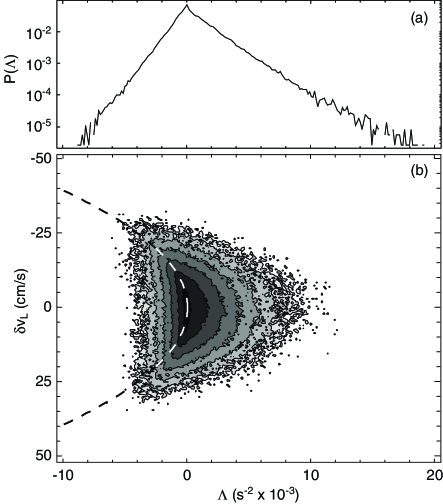
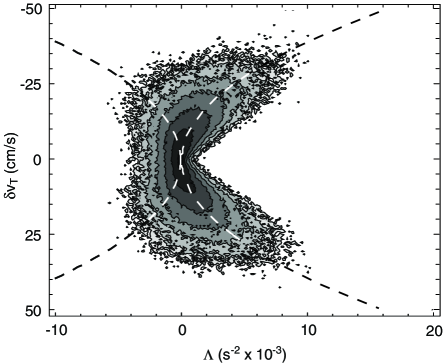
A rigorous connection between the abstract velocity difference statistics and the concrete flow topology is established through multivariate probability distributions of the form , where represents either the transverse, , or longitudinal component, , of the velocity difference. The form of these distributions differs significantly between the longitudinal and transverse velocity increments as a result of the different symmetries of the saddle and center; see Figs. 2 and 3. The wings of the longitudinal velocity difference PDF are dominated by strong saddles, whereas, the wings of the transverse velocity difference are dominated by strong centers. To understand the reason for this distinction we examine the distribution of the velocity differences about these two first-order structures in some detail.
We begin with an examination of a saddle point. The symmetry of a saddle is such that the distribution of the longitudinal and transverse velocity differences about it is the same. If the matrix, , is parametrized as
| (4) |
the radial and angular components of the velocity about a saddle (described by the symmetric part of ) are given by and , respectively. As long as is held constant, the relative magnitudes of and serve only to vary the spatial orientation of the saddle. We can, therefore, make the simplifying assumption that the saddle is described by . Using and in the longitudinal and transverse cases respectively, we obtain probability distributions of the form
| (5) |
regardless of which velocity increment is examined. Here we have let, for example, , and replaced the independent variables and by an equivalent pair expressing the saddle strength, , and orientation. Because of this similarity, it’s not surprising that the appearance of the multivariate distributions, and , are, at first order, identical for (where ). The velocity differences of maximum likelihood for a given saddle strength follow the curve for , independent of which velocity difference is being considered (the dashed lines for in Figs. 2b and 3). Note that the assumption that the dominant topology takes the form of a saddle is not valid as nears zero. In this regime, Fig. 4 shows that the expected values of the squared strain rate and squared vorticity become of comparable magnitude. The form of the is, therefore, distorted as the topological features themselves are stretched (recall Fig. 1).
Although the distributions of the longitudinal and transverse velocity differences are identical across a saddle, the distribution of these two quantities about a vortex center differs dramatically. Across an axisymmetric vortex center the longitudinal velocity difference is precisely zero (since the radial component of the velocity itself is zero). For positive values of the Jacobian determinant, points in the distribution which lie away from do so either as the result of first order contributions from the strain rate or through higher order corrections to the flow field. Since the magnitude of the longitudinal velocity difference across a vortex center is, thus, constrained to be small, it is saddle-like regions of the flow which play the dominant role in the wings of the longitudinal velocity difference PDFs and, correspondingly, in the higher order longitudinal structure functions. A clear picture of intermittency in 2D must, therefore, include an understanding of the formation of unusually strong saddle points in addition to coherent vortex centers.
On the other hand, vortex centers do support significant transverse velocity differences. In fact, vortex centers with cannot exist as a consequence of Stoke’s law: , where traces the perimeter of the disk, , and for , the sign of is the same about the entire perimeter. As the magnitude of the transverse velocity goes to zero, so must the magnitude of the vorticity. The shape of the distribution is obtained under the assumption that for locations in the flow with the topology is dominated by the vorticity. Setting , , , and letting , we find that the transverse velocity difference varies as a function of the local Jacobian determinant according to for (the dashed line in Fig. 3). The finite spread in the distribution results both from higher order corrections to the shape of the vortex centers as well as from the fact that in actuality there are finite contributions from first-order saddles, that is, is of order 0.2 for .
Because of the larger propensity for strong vortex centers to form relative to saddle points of comparable magnitude (recall Fig. 2a), the maximum transverse velocity difference found about centers in the flow is significantly greater than that found about saddles (compare Fig. 3 for and ). The wings of the transverse velocity difference PDF in the enstrophy cascade are, therefore, dominated by contributions from vortex centers. Because of this clear segregation between the structures which play the dominant role in the transverse and longitudinal velocity differences, it would not be surprising if the higher order moments of these two quantities differed.
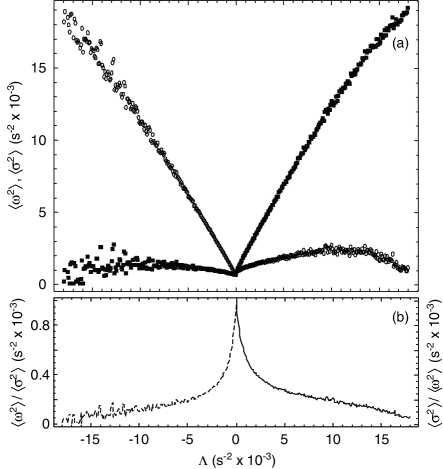
These rudimentary observations have certainly not expended the usefulness of this technique. It is, first of all, interesting that the ratio tends toward zero for . This implies that the strongest vortex centers are nearly axisymmetric, Fig. 1b rather than 1d. This was not seen in the earlier continuously forced experiment of Rivera et al.Rivera01a . These axisymmetric centers are the likely predecessors of the coherent structures found in the latter stages of 2D turbulent decaySmith97a ; Bracco00a . They are stable McWilliams84a ; Whitaker94a ; Kimura01a , steady-state solutions of the Euler equation in which there is no nonlinear transfer of enstrophy, and hence, no enstrophy cascade Babiano87a .
Furthermore, a key feature is still missing from the first order distribution, . It is a well know result in turbulence theory that the rate of enstrophy transfer depends on an odd moment of the longitudinal velocity difference Bernard99a , , and, hence, on an asymmetry in the distribution of these velocity differences. This asymmetry is missing in Eq. (5), where . In fact, any asymmetry is explicitly prohibited by incompressibility in the linear field approximation. Second order terms, as well, of the form and are even under the operations and so that the contribution to the velocity on opposite sides of the structure is of the same magnitude and sign. Incompressibility inextricably links the remaining terms. The result is that no contribution to the longitudinal asymmetry is possible at order two. It is necessary to go to at least third order to explain the asymmetry in , where the and terms—and through incompressibility the and terms—result in an asymmetric saddle; that is, one in which the magnitude of the velocity in the incoming and out-going jets differs. The longitudinal velocity difference about such a structure is asymmetric, whereas, positive and negative transverse velocity increments continue to exist with equal likelihood. A systematic correlation between these higher order topological structures and the velocity differences is beyond the limits of the current data set, but future work will explore these connections.
We would like to thank Michael Rivera, Robert Ecke, and Michael Chertkov for many insightful conversations. The present work was supported by the Petroleum Research Foundation, The Ohio State University, and the U.S. Department of Energy (W-7405-ENG-36).
References
- (1) J. C. McWilliams, J. B. Weiss, and I. Yavneh, Science 264(5157), 410 (1994).
- (2) B. Shivamoggi, Ann Phys 270, 263 (1998).
- (3) Y. Couder and C. Basdevant, J Fluid Mech 173, 225 (1986).
- (4) R. Benzi and M. Colella, Phys Fluids 4(5), 1036 (1992).
- (5) D. Dritschel, J Fluid Mech 293, 269 (1995).
- (6) R. Kraichnan, Phys Fluids 10, 1417 (1967).
- (7) R. Kraichnan, J Fluid Mech 67, 155 (1975).
- (8) G. Batchelor, Phys Fluids Suppl II 12, 233 (1969).
- (9) A. Okubo, Deep-Sea Research 17, 445 (1970).
- (10) J. B. Weiss, Physica D 48, 273 (1991).
- (11) J. L. Helman and L. Hesselink, IEEE Computer Graphics and Applications 11, 36 (1991).
- (12) P. Vorobeiff and R. E. Ecke, Physica D 123, 153 (1998).
- (13) M. Rivera, X. L. Wu, and C. Yeung, Phys Rev Lett 87(4), 044501 (2001).
- (14) K. Sreenivasan, S. Vainshtein, R. Bhiladvala, I. San Gil, S. Chen, and N. Cao, Phys Rev Lett 77, 1488 (1996).
- (15) G. Eyink, Physica D 91, 97 (1996).
- (16) L. Smith and V. Yakhot, Phys Rev E 55, 5458 (1997).
- (17) J. Paret and P. Tabeling, Phys Fluids 10, 3126 (1998).
- (18) P. Vorobieff, M. Rivera, and R. E. Ecke, Phys Fluids 11, 2167 (1999).
- (19) U. Frisch, Turbulence: The Legacy of A. N. Kolmogorov (Cambridge University Press, Cambridge, 1995).
- (20) M. Rutgers, X. L. Wu, and W. B. Daniel, Rev Sci Inst 72(7), 3025 (2001).
- (21) G. Falkovich and V. Lebedev, Phys Rev E 50(5), 3883 (1994).
- (22) M. Rutgers, Phys Rev Lett 81, 2244 (1998).
- (23) A. Bracco, J. C. McWilliams, G. Murante, A. Provenzale, and J. B. Weiss, Phys Fluids 12(11), 2931 (2000).
- (24) J. McWilliams, J Fluid Mech 146, 21 (1984).
- (25) N. Whitaker and B. Turkington, Phys Fluids 6(12), 3963 (1994).
- (26) Y. Kimura and J. R. Herring, J Fluid Mech 439, 43 (2001).
- (27) A. Babiano, C. Basdevant, B. Legras, and R. Sadourny, J Fluid Mech 183, 379 (1987).
- (28) D. Bernard, Phys Rev E 60, 6184 (1999).