Origin of genetic information from minority control in a replicating system with mutually catalytic molecules
Abstract
As the first step in an investigation of the origin of genetic information, we study how some species of molecules are preserved over cell generations and play an important role in controlling the growth of a cell. We consider a model consisting of protocells. Each protocell contains two mutually catalyzing molecule species ( and ), each of which has catalytically active and inactive types. One of the species is assumed to have a slower synthesis speed. Through divisions of the protocells, the system reaches and remains in a state in which there are only a few active and almost no inactive molecules in most protocells, through selection of very rare fluctuations. In this state, the active molecules are shown to control the behavior of the protocell. The minority molecule species act as the information carrier, due to the relatively discrete nature of its population, in comparison with the majority species which behaves statistically in accordance with the law of large numbers. The relevance of this minority controlled state to evolvability is discussed.
Key words: chicken and egg problem, genetic information, minority control, evolvability
1 Introduction
The origin of genetic information in a replicating system is an important theoretical topic that should be studied, not necessarily as a property of certain molecules, but as a general property of replicating systems. Consider a simple prototype cell that consists of mutually catalyzing molecule species whose intra-cellular population growth results in cell reproduction. In this protocell, the molecules that carry the genetic information are not initially specified, and to realize the growth in molecule numbers alone, it may not be necessary for specific molecules carrying such information to exist.
In actual cells, however, it is generally believed that information is encoded in DNA, which controls the behavior of a cell. With regard to this point, though it is not necessary to take a strong ‘geno-centric’ standpoint, it cannot be denied that there exists a difference between DNA and protein molecules in the role of information carrier. Still, even in actual cells, proteins and DNA both possess catalytic ability, and catalyze the production of each other, leading to cell replication.111 Note that through the reaction process from DNA to messenger RNA, and then to the synthesis of proteins, a DNA molecule itself is not changed. As a result, DNA works as a catalyst for the synthesis of proteins. Then, why is DNA regarded as the carrier of information?
To investigate this problem we need to clarify what it means for something to be an information carrier. For information carrying molecules, we identify the following two features as necessary.
(1) If this molecule is removed or replaced by a mutant, there is a strong influence on the behavior of the cell. We refer to this as the ‘control property’.
(2) Such molecules are preserved well over generations. The number of such molecules exhibits smaller fluctuations than that of other molecules, and their chemical structure (such as polymer sequence) is preserved over a long time span, even under potential changes by fluctuations through the synthesis of these molecules. We refer to this as the ‘preservation property’.
According to the present understanding of [Alberts et al. 1997], changes undergone by DNA molecules are believed to exercise stronger influences on the behavior of cells than other chemicals. With a higher catalytic activity, a DNA molecule has a stronger influence on the behavior of a cell. Also, a DNA molecule is transferred to offspring cells relatively accurately, compared with other constitutes of the cell. Hence a DNA molecule satisfies the properties (1) and (2).
In addition, a DNA molecule is stable, and the time scale for the change of DNA, e.g., its replication process as well as its destruction process, is slower. Because of this relatively slow replication, the number of DNA molecules is smaller than the number of protein molecules. For one generation of cells, single replication of each DNA molecule occurs typically, while other molecules undergo more replications (and decompositions).
The question we address in the present paper is as follows. Consider a protocell with mutually catalyzing molecules. Then, under what conditions, does one molecule species begin to carry information in the sense of (1) and (2)? We show, under rather general conditions in our model of mutually catalyzing system, that a symmetry breaking between the two kinds of molecules takes place, and through replication and selection, one kind of molecule comes to satisfy the conditions (1) and (2).
Without assuming the detailed biochemical properties of DNA, we seek a general condition for the differentiation of the roles of molecules in a cell and study the origin of the controlling behavior of some molecules. Assuming only a difference in the synthesis speeds of the two kinds of molecules, we show that the species that eventually possesses a smaller population satisfies (1) and (2) and acts as an information carrier. With this approach, we discuss the origin of information from a kinetic viewpoint. Note that we consider this information problem at a minimal level, i.e., as the origin of 1-bit information in a replicating cell system.
In the present paper we consider a very simple protocell system (see Fig.1), consisting of two species of replicating molecules that catalyze each other. Each species has active and inactive molecule types, with only the active types of one species catalyzing the replication of the the other species for the replication. The rate of replication is different for the two species. We consider the behavior of a system with such mutually catalyzing molecules with different replication speeds, as a first step in answering the question posed above. We show that the molecule species with slower replication speed comes to possess the properties (1) and (2), and that it therefore comes to represent the information carrier for cell replication. Finally, we discuss why a system with a separation of roles between information carrying and metabolism has a higher evolvability (i.e., ability to evolve), in reference to a recent experiment on an artificial replication system.
2 Toy Model
To study the general features of a system with mutually catalyzing molecules, we consider the following minimal model. First, we envision a (proto)cell containing molecules. With a supply of chemicals available to the cell, these molecules replicate through catalytic reactions, so that their numbers within a cell increase. When the total number of molecules exceeds a given threshold, the cell divides into two, with each daughter cell inheriting half of the molecules of the mother, chosen randomly. Regarding the chemical species and the reaction, we make the following simplifying assumptions:
(i) There are two species of molecules, X and Y, which are mutually catalyzing.
(ii) For each species, there are active (A) and inactive (I) types. There are thus four types, , , , and . The active type has the ability to catalyze the replication of both types of the other species of molecules. The catalytic reactions for replication are assumed to take the form222More precisely, there is a supply of precursor molecules for the synthesis of and , and the replication occurs with catalytic influence of either or .
(for or )
and
(for or ).
(iii) The rates of synthesis (or catalytic activity) of the molecules and differ. We stipulate that the rate of the above replication process for , , is much smaller than that for , . This difference in the rates may also be caused by a difference in catalytic activities between the two molecule species.
(iv) It is natural to assume that the active molecule type is rather rare. With this in mind, we assume that there are types of inactive molecules per active type. For most simulations, we consider the case in which there is only one type of active molecules for each species.
(v) In the replication process, there may occur structural changes that alter the activity of molecules. Therefore the type (active or inactive) of a daughter molecule can differ from that of the mother. The rate of such structural change is given by , which is not necessarily small, due to thermodynamic fluctuations. This change can consist of the alternation of a sequence in a polymer or other conformational change, and may be regarded as replication ‘error’. Note that the probability for the loss of activity is times greater than for its gain, since there are times more types of inactive molecules than active molecules. Hence, there are processes described by
and (with rate )
and (with rate ),
resulting from structural change.
(vi)When the total number of molecules in a protocell exceeds a given value , it divides into two, and the chemicals therein are distributed into the two daughter cells randomly, with molecules going to each. Subsequently, the total number of molecules in each daughter cell increases from to , at which point these divide.
(vii) To include competition, we assume that there is a constant total number of protocells, so that one protocell, randomly chosen, is removed whenever a (different) protocell divides into two.
With the above described process, we have basically four sets of parameters: the ratio of synthesis rates , the error rate , the fraction of active molecules , and the number of molecules . (The number is not important, as long as it is not too small).
We carried out simulation of this model, according to the following procedure. First, a pair of molecules is chosen randomly. If these molecules are of different species, then if the molecule is active, a new molecule is produced with the probability , and if the molecule is active, a new molecule is produced with the probability . Such replications occur with the error rates given above. All the simulations were thus carried out stochastically, in this manner.
We consider a stochastic model rather than the corresponding rate equation, which is valid for large , since we are interested in the case with relatively small . This follows from the fact that in a cell, often the number of molecules of a given species is not large, and thus the continuum limit implied in the rate equation approach is not necessarily justified [Hess and Mikhailov 1994, 1995; Stange, Mikhailov, and Hess 1998]. Furthermore, it has recently been found that the discrete nature of a molecule population leads to qualitatively different behavior than in the continuum case in a simple autocatalytic reaction network [Togashi and Kaneko 2001].
3 Result
If is very large, the above described stochastic model can be replaced by a continuous model given by the rate equation. Then the growth dynamics of the number of molecules and (for or ) is described by the rate equations
| (1) |
From these equations, under repeated divisions, it is expected that the relations , , and are eventually satisfied. Indeed, even with our stochastic simulation, this number distribution is approached as is increased.
However, when is small, and with the selection process, there appears a significant deviation from the above distribution. In Fig.2, we have plotted the average numbers , , , and . Here, represents the average over time of the number of the molecules of the individual species, existing in a cell just prior to the division, when the total number of molecules is , averaged over all observed divisions throughout the system. (Accordingly, a cell removed without division does not contribute to the average). As shown in the figure, there appears a state satisfying , . Since , such a state with is not expected from the rate equation (1). Indeed, for the - species, the number of inactive molecules is much larger than the number of active ones. Hence, we have found a novel state that can be realized due to the smallness of the number of molecules and the selection process.
In Fig.2, and are fixed to 0.01 and 64, respectively, while the dependence of {,,, } on these parameters is plotted in Figs. 3 and 4. As shown in these figures, the above mentioned state with , is reached and sustained when is small and is sufficiently large. In fact, for most dividing cells, is exactly 0, while there appear a few cells with from time to time. It should be noted that the state with almost no inactive Y molecules appears in the case of larger , i.e., in the case of a larger possible variety of inactive molecules. This suppression of for large contrasts with the behavior found in the continuum limit (the rate equation). In Fig.4, we have plotted as a function of . Up to some value of , the proportion of active molecules decreases, in agreement with the naive expectation provided by Eq. (1), but this proportion increases with further increase of , in the case that is small () and is small.
This behavior of the molecular populations can be understood from the viewpoint of selection: In a system with mutual catalysis, both and are necessary for the replication of protocells to continue. The number of molecules is expected to be rather small, since their synthesis speed is much slower than that of molecules. Indeed, the fixed point distribution given by the continuum limit equations possesses a rather small . In fact, when the total number of molecules is sufficiently small, the value of given by these equations is less than 1. However, in a system with mutual catalysis, both and must be present for replication of protocells to continue. In particular, for the replication of molecules to continue, at least a single active molecule is necessary. Hence, if vanishes, only the replication of inactive molecules occurs. For this reason, divisions producing descendants of this cell cannot proceed indefinitely, because the number of molecules is cut in half at each division. Thus, a cell with cannot leave a continuing line of descendant cells. Also, for a cell with , only one of its daughter cells can have an active molecule. Hence a cell with has no potentiality to multiple through division, and for this reason, given the presence of cells with and selection, the number of cells with should decrease with time. We thus see that over a sufficiently long time, protocells with are selected.
The total number of molecules is limited to small values, due to their slow synthesis speed. This implies that a cell that suppresses the number of molecules to be as small as possible is preferable under selection, so that there is a room for molecules. Hence, a state with almost no molecules and a few molecules, once realized through fluctuations, is expected to be selected through competition for survival.
Of course, the fluctuations necessary to produce such a state decrease quite rapidly as the total molecule number increases, and for sufficiently large numbers, the continuum description of the rate equation is valid. Clearly then, a state of the type described above is selected only when the total number of molecules within a protocell is not too large. In fact, a state with very small appears only if the total number is smaller than some threshold value depending on and .
To summarize our result, we have found that a state with a few active molecules and very small number of inactive molecules is selected if the replication of molecules is much slower than that of , a large variety of inactive molecules exists, and the total number of molecules is sufficiently small.
Remark: In the model considered here, we have included a mechanism for the synthesis of molecules, but not for their decomposition. To investigate the effect of the decomposition of molecules, we have also studied a model including a process to remove molecules randomly at some rate. We found that the above stated conclusion is not altered by the inclusion of this mechanism.
4 Minority Controlled State
In §3, we showed that in a mutually catalyzing replication system, the selected state is one in which the number of inactive molecules of the slower replicating species, , is drastically suppressed. In this section, we first show that the fluctuations of the number of active molecules is smaller than those of active molecules in this state. Next, we show that the molecule species (the minority species) becomes dominant in determining the growth speed of the (proto)cell system. Then, considering a model with several active molecule types, the control of chemical composition through specificity symmetry breaking is demonstrated.
4.1 Control of the growth speed
First, we computed the time evolution of the number of active and molecules, to see if the selection process acts more strongly to control the number of one or the other. We computed and at every division to obtain the histograms of cells with given numbers of active molecules. (Here, the values of were coarse-grained into bins of size 10, chosen as [0,10],[10,20],…, while all possible values of , 1,2,…, were computed separately. The histograms for and were computed independently.
The histograms are plotted in Fig.6a. We see that the distribution for has a sharp peak near , while that for is much wider. Since the root mean square of a distribution increases with the square root of the average for a standard random process, we have plotted the histograms by rescaling the ordinate by the expected average of , which is approximately 10. Even after this rescaling, we find that the distribution of is much wider than that of . Hence, the fluctuations in the value of are much smaller than those of . We conclude that the selection process discriminates more strongly between different concentrations of active molecules than between those of active molecules. Hence, it is expected that the growth speed of our protocell has a stronger dependence on the number of active molecules than the number of active molecules.
To confirm such a dependence, we have computed the dependence of the growth speed of a protocell on the numbers of molecules and . Here, we computed , the time required for division, as a function of the number of active and molecules at each division. At every division we record and to determine the time required for division . The division speed for a given is computed as the division time for this value of (with the bin size used for the histogram), averaged over all values of , and similarly for a given . In Fig.6b, these average division times are plotted as functions of and .
As shown in the figure, the division time is a much more rapidly decreasing function of than of . We see that even a slight change in the number of active molecules has a strong influence on the division time of the cell. Of course, the growth rate also depends on , but this dependence is much weaker. Hence, the growth speed is controlled mainly by the active molecules.
In addition, the fluctuations around this average division time are smaller for fixed . To show this, we have computed the variance for and . Considering that the variance typically increases in proportion to the corresponding average, we rescaled each variance by dividing by the corresponding average or . This scaled variance takes values around 0.55 for , and around 0.25 for . We thus conclude that the fluctuations of for fixed are smaller. This implies that if is fixed, fluctuations of the division speed due to changes in are much smaller than the other way around. In other words, the growth speed is controlled mainly by .
4.2 Preservation of the minority molecule
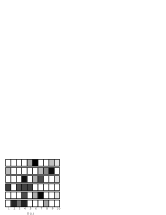
As another demonstration of control, we study a model in which there is more specific catalysis of molecule synthesis. Here, instead of single active molecule types for and , we consider a system with types of active and molecules, and (). In this model, each active molecule type catalyzes the synthesis of only a few types () of the other species of molecules. Graphically representing the ability for such catalysis using arrows as for and for , the network of arrows defining the catalyzing relations for the entire system is chosen randomly, and is fixed throughout each simulation. An example of such a network (that which was used in the simulation discussed below) is shown in Fig.7a. Here we assume that both and molecules have the same “specificity” (i.e., the same value of ) and study how this symmetry is broken.
As discussed in §2, when , and satisfy the conditions necessary for realization of a state in which is sufficiently small, the surviving cell type contains only a few active molecules, while the number of inactive ones vanishes or is very small. Our simulations show that in the present model with several active molecules types, only a single type of active molecule remains after a sufficiently long time. We call this “remained type”, (). Contrastingly, at least types of species, that can be catalyzed by the remaining molecule species remain. Accordingly, for a cell that survived after a sufficiently long time, a single type of molecule catalyzes the synthesis of (at least) kinds of molecule species, while the multiple types of molecules catalyze this single type of molecules. Thus, the original symmetry regarding the catalytic specificity is broken as a result of the difference between the synthesis speeds.
Due to autocatalytic reactions, there is a tendency for further increase of the molecules that are in the majority. This leads to competition for replication between molecule types of the same species. Since the total number of molecules is small, this competition leads to all-or-none behavior for the survival of molecules. As a result, only a single type of species remains, while for species , the numbers of molecules of different types are statistically distributed as guaranteed by the uniform replication error rate.
The distribution of species and the growth speed depend on the identity of the remained type of . In Fig.7b, we display long-time number distributions of molecules reached from 6 different initial configurations, with a gray scale plot. The population distribution of molecules satisfies , and for . The identity of the remaining type depends on the initial conditions. The number distribution of and depends strongly on , as shown in Fig. 7b. This strong dependence is expected, since the types of molecules catalyzed by each active type of molecule differ, as determined by the catalytic network (Fig.7a).
Although and molecules catalyze each other, a change in the type of the remaining active molecule has a much stronger influence on than a change in the types of the active molecules on , since the number of molecules is much smaller. Consider, for example, a structural change of an active molecule from type to (for example, the change in polymer sequence) that may occur during synthesis. If such a change occurs and remains, there will be a composition change from to . This change will alter the distribution of drastically, as suggested by Fig.7b. By contrast, a structural change experienced by molecules will have a much smaller influence on the distribution of . (This ignores the case in which many molecules change to a same type simultaneously by replication error, resulting in a drastic change of the distribution of . Such a situation, however, is very rare in accordance with the law of large numbers). In fact, there always remain some fluctuations in the distribution of molecules, while the distribution of molecules (i.e., identity of the remaining type ) is fixed over many generations, until a rare structural change leads to a different remaining type, which may allow for a higher growth speed and the survival of the type containing it under selection.
With the results in §3 and §4, we can conclude that the molecules, i.e., the minority species, control the behavior of the system, and are preserved well over many generations. We therefore call this state the minority-controlled (MC) state.
4.3 Evolvability of the minority controlled state
An important characteristic of the MC state is evolvability. Consider a variety of active molecules, with different catalytic activities. Then the synthesis rates and depend on the activities of the catalyzing molecules. Thus, can be written in terms of the molecule’s inherent growth rate, , and the activity, , of the corresponding catalyzing molecule :
Since such a biochemical reaction is entirely facilitated by catalytic activity, a change of or , for example by the structural change of polymers, will be more important. Given the occurrence of such a change to molecules, those with greater catalytic activities will be selected through competition evolution, leading to the selection of larger and . As an example to demonstrate this point, we have extended the model in §2 to include kinds of active molecules with different catalytic activities. Then, molecules with greater catalytic activities are selected through competition.
Here, the minority controlled state is relevant to realize evolvability. Since only a few molecules of the species exist in the MC state, a structural change to them strongly influences the catalytic activity of the protocell. On the other hand, a change to molecules has a weaker influence, on the average, since the deviation of the average catalytic activity caused by such a change is smaller, as can be deduced from the law of large numbers. Hence the MC state is important for a protocell to realize evolvability.
5 Effect of Higher-order Catalysis
In the first toy model considered in this paper, in order to realize the MC state, the difference between the time scales of the two kinds of molecules often must be rather large. For example, the ratio should typically be less than .05 when the number of molecules is in the range . (If the number is larger, the rate should be much smaller.) This difference in growth rates required to realize the MC state is drastically reduced in a model that includes higher-order catalytic reaction processes in the replication of molecules.
Consider a replication of molecules described by the following:
| (2) |
In complex biochemical reaction networks, such higher-order catalytic reactions often exist. Indeed, proteins in a cell are catalyzed not solely by nucleotides but with collaboration of proteins and nucleotides. Nucleotides, similarly, are catalyzed not solely by proteins but with collaboration of nucleotides and proteins.
In the continuum limit, the rate equation corresponding to the reaction (2) is given by and . In this higher-order catalytic reaction, it is expected that difference between the numbers of and molecules is amplified.
Consider the equation and . Then the relation
| (3) |
holds, with the initial values and (where ). Then, consider the following division process: if , then and . With the continued temporal evolution satisfying Eq.(3) and this division process, approaches 0 if . (Recall that the curve given by Eq.(3) is concave.)
Now, instead of the differential equations, we again carried out stochastic simulations corresponding to the above reaction process (2), using the same procedures (iii)-(vii) described in §2.
The average values of active and inactive molecules obtained in these simulations are plotted in Fig.8 as functions of . We see that if , the MC state is reached. Note that here a difference in growth speeds as small as about 10% is sufficient to realize the MC state.
In the present case, if is less than .7, the system comes to exist in the state with . Since , molecules are synthesized, while molecules are not. Accordingly, after a division, only the cell that inherits the molecule keeps growing. For this reason, the growth of the number of such protocells is not possible, and hence a state with such a small value of is not expected to be reached through evolution.
The main conclusion of this section is that, when we consider higher-order catalysis, the realization of the minority controlled state occurs for a wider range of values of . In the above example, a minority controlled state maintaining growth is realized for , while the former inequality is always satisfied as long as one considers a cell that continues to produce offspring.
6 Discussion
In this paper, we have shown that in a mutually catalyzing system, molecules with the slower synthesis speed tend to act as the information carrier. Through the selection under reproduction, a state, in which there is a very small number of inactive molecules, is selected. This state is termed the “minority controlled state”. Between the two molecule species, there appears separation of roles, that with a larger number, and that with a greater catalytic activity. The former provides a variety of chemicals and reaction paths, while the latter holds “information”, in the sense of the two properties mentioned in the Introduction, ‘preservation’ and ‘control’. We now discuss these properties in more detail.
[Preservation property]: A state that can be reached only through very rare fluctuations is selected, and it is preserved over many generations.333 Recall also the definition of the information by Shannon [Shannon and Weaver 1949], according to which rarer events carry a greater amount of information. In the theory presented here, the selected and preserved state is one with and . The realization of such a state is very rare when we consider the rate equation obtained in the continuum limit. For a model with several types of both molecule species, the type of active molecules with nonzero population remains fixed, in spite of the process of stochastic fluctuations.
[Control property]: A change in the number of molecules has a stronger influence on the growth rate of a cell than a change in the number of molecules. Also, a change in the catalytic activity of the molecules has a strong influence on the growth of the cell. The catalytic activity of the molecules acts as a control parameter of the system. For a model with several types of each molecule species, (the majority species) has a smaller catalytic activity on the average, and its catalysis is rather specific, only acting in the synthesis of a single or a few types of molecules. The minority species has a greater catalytic ability and acts to catalyze the synthesis of many kinds of molecules. Hence a change in has a very strong influence.
With the information carrier defined in terms of the preservation of rare states and control of the behavior of the system, we have shown that molecule species with slower synthesis speed acts as the information carrier. In this way, the generation of information is understood from a kinetic viewpoint. Following our result, the separation of the roles of metabolism (“the chicken”) and information (“the egg”) is explained as a general consequence of a cell system with mutual catalysis and an appropriate difference between catalytic activities (leading to a difference in synthesis speeds).
Finally, the following question remains: How does the difference in the catalytic activity necessary to realize the MC state generally come to exist? Of course, it is quite natural in a complex chemical system that there will be differences in synthesis speeds or catalytic activities, and, in fact, this is the case in the biochemistry of present-day organisms. Still, it would be preferable to have a theory describing the spontaneous divergence of synthesis speeds without assuming a difference in advance, to provide a general model of the possible ‘origin’ of bio-information from any possible replication system.
To close the paper, we discuss (1) the evolutionary stability and (2) evolutionary realizability of the MC state.
One important consequence of the existence of the MC state is evolvability. Mutations introduced to the majority species tend to be cancelled out on the average, in accordance with the law of large numbers. Hence, the catalytic activity of the minority species ( in our model) is not only sustained, but has a greater potentiality to increase through evolution.
Recently, there have been some experiments to construct minimal replicating systems in vitro. In particular, Matsuura et al. (2001) constructed a replication system of molecules including DNA polymerase, synthesized by the corresponding gene. Roughly speaking, the polymerase in the experiment corresponds to in our model, while the polymerase gene corresponds to . In that experiment, instead of changing the synthesis speed or , the influence of the number of genes is investigated.
In the experiment, it was found that replication is maintained even under deleterious mutations (that correspond to structural changes from active to inactive molecules in our model), only when the population of DNA polymerase genes is small and competition of replicating systems is applied. When the number of genes (corresponding to ) is small, the information containing in the DNA polymerase genes is preserved. This is made possible by the maintenance of rare fluctuations, as found in our study.
As discussed in §4, a change in catalytic activity can be included in the model by considering a system with several kinds of active molecules with different activities. By considering a mutation from to (or to ), accompanied by a change in the value of (or ), one can examine the stability of the MC state with respect to mutation. If the initial difference between the catalytic abilities and (and other parameters) satisfies the conditions stated in §3, the MC state is realized. Then, we examined if such a state is destroyed by a change in the catalytic activities of molecules. We found that this difference is in fact maintained over many generations and that the MC state continues to exist. This behavior is due to the fact that a small mutation of strongly influences the synthesis of , and a mutation resulting in a decrease of is not selected. Hence the MC state possesses evolutionary stability.
The final remaining question we wish to address regards the realizability of the MC state in the situation that initially the two molecule species have almost the same catalytic activity. One may expect that there would occur a divergence of the catalytic activities of two such molecule species, because once one species (say ) has a larger catalytic activity, the number of molecules will increase. This results in becoming the minority species, which implies that its influences on the behavior of the cell will become stronger. For this reason, the catalytic activity of increases faster than that of , and thus the replication speed of becomes larger. In this way, the difference between replication speeds of and might become further amplified.
While the above argument seems reasonable, it does not hold for our model. In simulations including such a structural change, we have not observed such spontaneous symmetry breaking with regards to the growth speeds of the two species, when these species initially have (almost) equal catalytic activities. The reason is as follows. In our model, the division of a cell is assumed to occur when the total number of molecules becomes double the original number. Now, in the model, the collision of two molecules is assumed to occur randomly. Hence the probability for a collision leading to synthesis of molecules should be proportional to , if we assume a constant proportionality between the numbers of active and inactive molecule. Then, note that the quantity has a peak at . It follows that the growth speed should be maximal when the numbers of the two species are equal. Hence there is a tendency toward a state in which there are equal numbers of both species. Of course, this argument is rather rough, due to the assumption concerning the ratio of active to inactive molecule numbers, and the existence of a peak at exactly may be slightly modified. However, the basic idea here is correct, and there is undoubtedly a tendency toward equal numbers. For this reason, a state with a large difference is not reached spontaneously through some kind of symmetry breaking.
There are some possible scenarios within which the above described tendency toward equal growth speeds may be ineffective.
1. Higher-order catalysis: As mentioned in §4, the imbalance necessary to realize a MC state is much smaller when higher-order catalysis is considered. Indeed, by introducing the mutation of catalytic activity to the model studied in §4, we have sometimes observed spontaneous symmetry breaking between the parameters characterizing the two species. The resulting state with a sufficient difference between the growth speeds of two species, however, does not last very long, since the necessary imbalance between and is so small that mutation can reverse the relative sizes of and .
2. Change in the collision condition:444Since the scenarios 2 and 3 assume another kind of symmetry breaking between and (albeit being different from the synthesis speeds), they cannot provide the final solution to the true spontaneous symmetry breaking, although the assumptions may be biologically reasonable.In our model, collisions of molecules occur randomly. Hence if the number of molecules is larger, most collisions occur between two molecules, and no reaction occurs. However, if molecules are arranged spatially under different conditions (e.g., consider the case in which molecules are on a membrane and molecules are in a contained medium), then the number of reaction events between and molecules can be increased. If we include this type of physical arrangement, which is rather natural when considering a cell, the tendency toward equal numbers no longer exists, and the divergence of growth speeds in molecules should occur.
3. Condition for growth: We have assumed that the division of the protocell occurs when the total number of molecules doubles. This assumption is useful as a minimal abstract model, but it may be more natural to have a threshold that depends on the number of molecules of one species (or, more generally, of some subset of all species), rather than the total number. For example, consider the case that division occurs when the size of a membrane synthesized by biochemical reactions is larger than some threshold. This condition, for example, could be modeled by stipulating that division occurs when the number of molecules of one species, say , that composes the membrane, is larger than some threshold value. By imposing this type of division condition, the tendency toward equal numbers of and molecules could be avoided, and the divergence of the replication speeds of and could take place.
4. Network structure: The catalytic network in a cell is generally quite complex, with many molecules participating in mutual catalysis for replication. The evolution of replication systems with such catalytic networks have been studied since the proposal of the hypercycle by Eigen and Schuster [1979]. Dyson [1985], on the other hand, obtained a condition for loose reproduction of protocells with complex reaction networks consisting of active and inactive molecules. Origin of recursive replication from such loose reproduction is also discussed [Segre, Ben-Eli, and Lancet 2000].
The differentiation of cells with a catalytic reaction network has also been studied [Kaneko and Yomo 1997,1999; Furusawa and Kaneko 1998]. Here it has been found that chemicals with low concentrations are often important in differentiation. If the total number of molecules participating in the reaction network is small, there should generally exist some species whose numbers of molecules are small, and the discrete nature of these numbers plays a significant role. For example, Togashi and Kaneko [2001] have found novel symmetry breaking that appears in a catalytic reaction system with a small total number of molecules. Furthermore, a preliminary study of the reaction network version of the model considered in this paper reveals spontaneous symmetry breaking that distinguishes a few controlling molecule species from a large number of non-controlling species, without assuming a difference in synthesis speeds.
The symmetry breaking by the network structure is related with the evolution of specificity. Although we have studied catalysis that has no specificity (except for the model considered in §4.2), in reality one type of molecule can catalyze the synthesis of only a limited number of molecule species. Interestingly, a preliminary study shows a symmetry breaking with regard to the roles of molecules (with equal synthesis speeds) when higher-order catalytic reactions (as in §5) in random networks with catalytic specificity are included.
Acknowledgment
The authors would like to thank Shin’ichi Sasa and Takashi Ikegami for useful discussions. This research was supported by Grants-in-Aid for Scientific Research from the Ministry of Education, Science and Culture of Japan (11CE2006,11837004).
References
-
1.
B. Albert, D. Bray., J. Lewis, M. Raff, K. Roberts, and J.D. Watson The Molecular Biology of the Cell (1994)
-
2.
Freeman Dyson, Origins of Life, Cambridge Univ. Press., 1985
-
3.
M. Eigen, P. Schuster, The Hypercycle (Springer, 1979).
-
4.
Furusawa C. & Kaneko K., “Emergence of Rules in Cell Society: Differentiation, Hierarchy, and Stability” Bull.Math.Biol. 60; 659-687 (1998)
-
5.
B. Hess and A. S. Mikhailov, Science 264, 223 (1994);
-
6.
B. Hess and A. S. Mikhailov, J. Theor. Biol. 176, 181 (1995).
-
7.
Kaneko K. & Yomo T, “Isologous Diversification: A Theory of Cell Differentiation ”, Bull.Math.Biol. 59, 139-196 (1997)
-
8.
Kaneko K. & Yomo T, “Isologous Diversification for Robust Development of Cell Society ”, J. Theor. Biol., 199 243-256 (1999)
-
9.
Matsuura T., Yomo T., Yamaguchi M, Shibuya N., Ko-Mitamura E.P., Shima Y., and Urabe I. “Importance of compartment formation for a self-encoding system”, preprint (2001)
-
10.
Segre D, Ben-Eli D, Lancet D., “Compositional genomes: prebiotic information transfer in mutually catalytic noncovalent assemblies”, Proc Natl Acad Sci USA 97 (2000)4112-7
-
11.
C. Shannon and W. Weaver “The Mathematical Theory of Communication”, Univ. of llinois Press, 1949
-
12.
P. Stange, A. S. Mikhailov and B. Hess, J. Phys. Chem. B 102, 6273 (1998)
-
13.
Y. Togashi and K. Kaneko, “ Transitions Induced by the Discreteness of Molecules in a Small Autocatalytic System” Phys. Rev. Lett. , 86 (2001) 2459