[
Effects of crack tip geometry on dislocation emission and cleavage: A possible path to enhanced ductility
J. Schiøtz[1], L. M. Canel, and A. E. Carlsson
Department of Physics, Washington University, St. Louis, MO
63130-4899, USA
(June 27, 1996)
We present a systematic study of the effect of crack blunting on subsequent crack propagation and dislocation emission. We show that the stress intensity factor required to propagate the crack is increased as the crack is blunted by up to thirteen atomic layers, but only by a relatively modest amount for a crack with a sharp 60∘ corner. The effect of the blunting is far less than would be expected from a smoothly blunted crack; the sharp corners preserve the stress concentration, reducing the effect of the blunting. However, for some material parameters blunting changes the preferred deformation mode from brittle cleavage to dislocation emission. In such materials, the absorption of preexisting dislocations by the crack tip can cause the crack tip to be locally arrested, causing a significant increase in the microscopic toughness of the crack tip. Continuum plasticity models have shown that even a moderate increase in the microscopic toughness can lead to an increase in the macroscopic fracture toughness of the material by several orders of magnitude. We thus propose an atomic-scale mechanism at the crack tip, that ultimately may lead to a high fracture toughness in some materials where a sharp crack would seem to be able to propagate in a brittle manner.
When the crack is loaded in mode II, the load required to emit a dislocation is affected to a much higher degree by the blunting, in agreement with the estimates from continuum elasticity. In mode II the emission process is aided by a reduction of the free surface area during the emission process. This leads to emission at crack loadings which are lower than predicted from the continuum analysis of Rice.
(Submitted to Phys. Rev. B)
]
I Introduction
The ability to calculate, or even to understand quantitatively, the fracture toughness of materials has long been one of the major goals of materials science. Unfortunately, that goal has yet to be realized. The phenomena that cause some materials to be brittle and some to be ductile involve mechanisms at vastly different length scales, from the atomic-scale processes at crack tips and dislocation cores, to the formation of cell structures and texture at much larger length scales.
Recently, the atomic-scale behavior of the crack tip has been modeled with some success. Generally, the behavior of cracks falls onto two categories. In “intrinsically brittle” materials, an atomically sharp crack will propagate, possibly leading to cleavage of the specimen. In “intrinsically ductile” materials, the crack will emit one or more dislocations instead of propagating, and brittle fracture becomes impossible. Significant progress has been made in understanding the intrinsic behavior of the crack tip in terms of well defined atomic-scale energies[2, 3, 4, 5, 6, 7, 8].
The intrinsic behavior of the crack tip does not by itself determine the behavior of the material. Most materials contain a density of dislocations and dislocation sources that is high enough to affect fracture strongly. It is perfectly possible that an “intrinsically brittle” material may behave in a ductile manner, if for example a loaded crack causes dislocations to be emitted from nearby sources, which subsequently shield the crack. Modeling of these processes is impractical at the atomic scale, but requires the use of continuum or quasi-continuum methods[9, 10, 11, 12].
Even if the dislocation activity in the material surrounding a crack is in itself insufficient to change the behavior, the dislocations may directly interact with the crack tip, and thus change its behavior. If the crack tip intersects a dislocation a localized step or jog in the crack tip is formed. The jog may act as a local nucleation site for dislocations, favoring ductile behavior[13, 14]. But even without introducing inhomogeneities the detailed atomic configuration may significantly change the behavior of the crack: In a recent paper[15] we demonstrated that the emission of dislocations becomes favored if the crack tip is blunt at the atomic level. In this paper this effect is investigated further. This supplements earlier work showing that the effect of blunting on crack propagation is smaller than what one would expect from relatively simple continuum elasticity considerations[8, 16]. We present arguments for this reduced effect based on a more detailed continuum model that includes the sharp corners of the crack. In addition, simple models of the inter-atomic interactions permit us to analyze the results in a more detailed way, and to understand the effects of blunting as a combination of linear elastic and nonlinear phenomena.
The effect of crack blunting on crack behavior may be of significant practical interest in some materials. Blunting may occur due to emission from the tip or by collision of the tip with pre-existing dislocations. If this blunting is enough to arrest the crack the macroscopic fracture toughness of the material may change significantly. The absorption of pre-existing dislocations may be enhanced by attractive elastic interaction between the crack tip and the dislocations. Recent simulations[17, 18] have shown that the stress field of a crack moving through a material will cause dislocations located within the immediate vicinity of the crack path to be attracted to the crack. Since dislocations lying within several hundred lattice constants of the crack path may collide with the tip, the likelihood of blunting due to intersection of the crack tip with pre-existing dislocations is high.
We have also studied the behavior of the blunt crack under mode II loading. Here we find a much larger effect of the blunting on the load required to emit a dislocation, in agreement with arguments from continuum elasticity. We also find that the surface energy plays a prominent role in the emission process. Emission under mode II conditions is observed to be accompanied by a reduction in the total surface area. When the surface energy is high, emission occurs at loadings which are much lower than the corresponding values predicted by Rice[5].
In the next section we present the method used for our simulations. In section III we present the results for a blunt crack loaded in mode I. We find that blunting the crack tip results in a modest increase in the load required to propagate it, and that often the crack response changes from brittle cleavage to dislocation emission. We discuss how this may influence the fracture toughness of a metal. Section IV is a brief overview of the results in mode II loading, where we find that the surface energy plays a prominent role in the emission process. Finally, we present analytical calculations on stress fields around a blunt crack in the Appendix.
II Simulation methods.
The slow decay of the elastic fields around a crack () makes atomic-scale simulations of cracks very challenging, since large system sizes are needed to minimize the effect of the boundary conditions. Many methods have been used to get around these problems, such as embedding the atomistic simulation in a continuum model [19, 20] or using extremely large systems on state-of-the-art parallel computers[21].
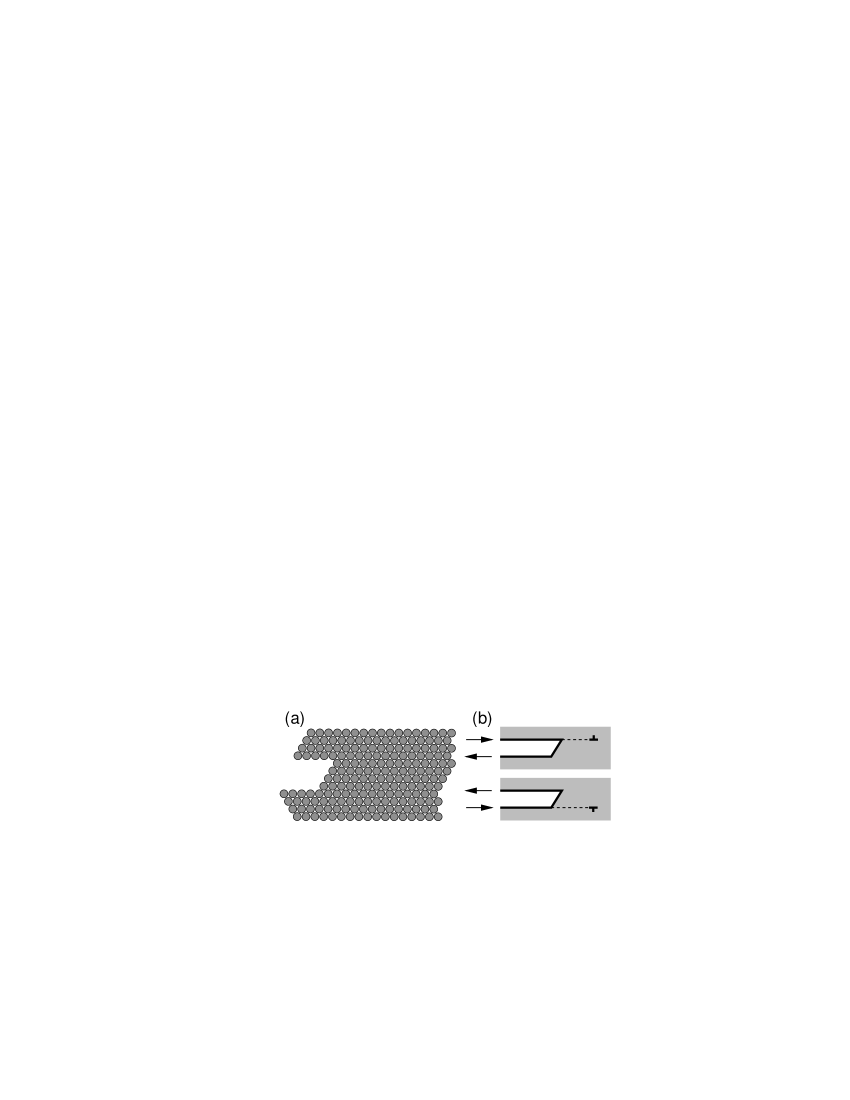
Our solution is to model the elastic response of the surrounding medium by a Green’s function. The simulation cell is divided into two zones (see figure 1). The atoms located near the crack tip interact with each other through a non-linear force law (the non-linear zone), whereas the atoms far from the crack tip interact only through linear forces. The displacements of the atoms in this linear zone can then be fully described by a lattice Green’s function , which describes the displacement of the atom at to a force acting on the atom at , taking the presence of the crack into account. The interactions of atoms in the non-linear zone with atoms in the linear zone are also described by the Green’s function, and are therefore linear. The Green’s function can be calculated in a computationally efficient way[22]. The total energy of the system can then be described as the sum of the energy in the elastic far field (calculated from the Green’s function) and in the non-linear interactions[23]. This typically reduces the number of degrees of freedom in the problem from approximately to –.
We use this method to study the deformation modes of blunt cracks with up to thirteen atomic layers of blunting, for a range of force laws. Figure 2a shows a typical initial configuration. We have a region in front of the crack where the atoms are allowed to move freely. Two “spurs”, along which dislocations generated at the crack tip can move away from the crack, are included in the non-linear zone. Since bonds cannot be broken and reformed in the linear zones, dislocations will be unable to leave the non-linear zone. The two-dimensional hexagonal lattice studied contains three slip planes at angles. The crack is oriented parallel to one of the slip planes.
The inter-atomic interactions in the non-linear zone are described by the UBER pair potential[24]:
| (1) |
where is the inter-atomic separation, is the separation in equilibrium, and is a range parameter. The interactions are cut off so that only nearest-neighbor interactions are included, and forces are shifted slightly to avoid steps in the force at the cutoff. Further, a small scaling of the force law is used to preserve the elastic constants, thus enabling us to use the same Green’s function for all the force laws. The force law thus becomes
| (2) |
where assures that the force is zero at the cutoff distance (in this work ). Since we do not study specific materials, no attempt is made to use realistic many-body potentials. In spite of the relatively simple potentials used, this methodology is known to give results that agree well with the observed behavior of real materials, and with continuum models[6, 25]. We also see good agreement between our calculations and calculations using the Embedded Atom Method[8, 26], as discussed in section III B.
For all the calculations presented in this paper, the total system size has been atoms. In order to establish that the results are not influenced by the boundary conditions, we have repeated a few of the simulations with 16 times as many atoms (). The only difference is a consistent 1–1.5% reduction of the loads required to cleave the crack or to emit a dislocation. All trends remain the same. The size-dependence is caused by the stress fields of the cracks in neighboring supercells causing the true stress intensity factor to be slightly different from the calculated values. Since this interaction remains the same it does not influence our results, where we study the changes in the critical loads. We have also verified that increasing the size of the non-linear zone does not affect the results.
III The blunt crack under mode I loading.
A Simulations.
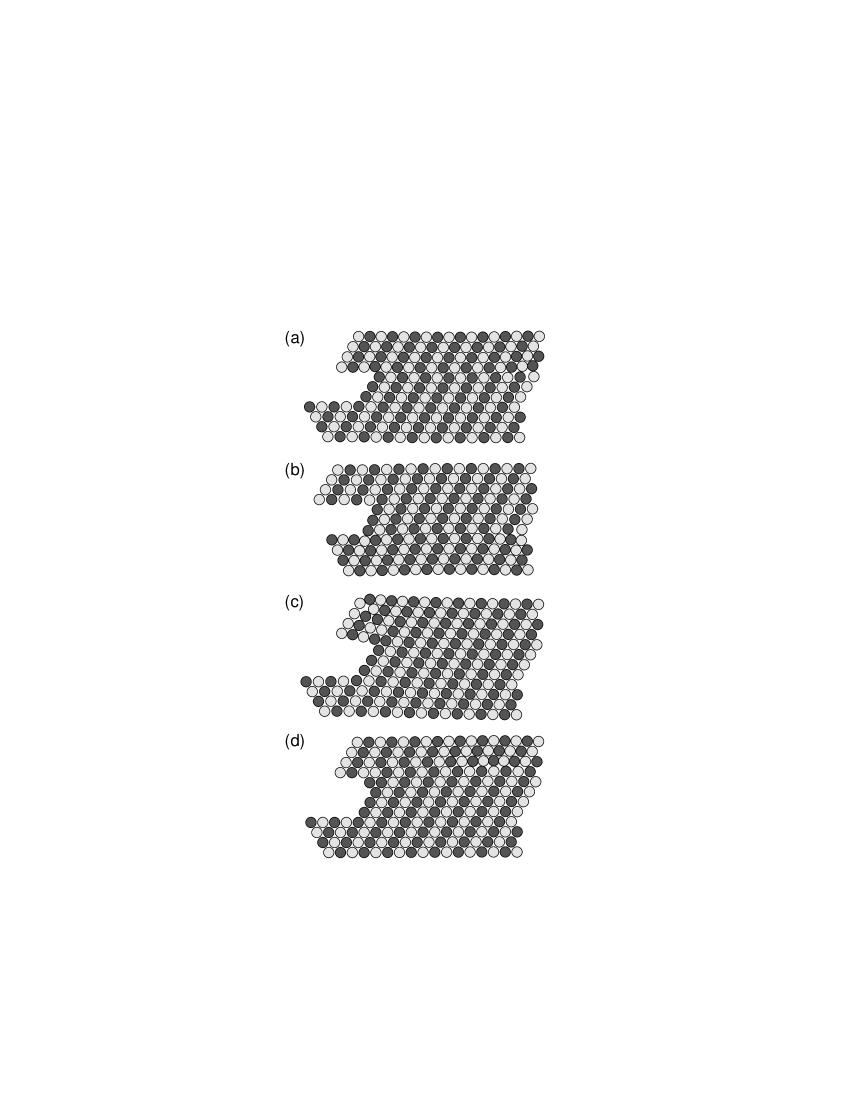
When we load the cracks until an instability occurs, one of two different responses are observed: cleavage and dislocation emission (figure 2). The dislocation emission always occurs in the downwards direction, as shown in the figure, except for the case of a single layer of blunting, where the crack geometry is symmetric. Furthermore, the emission preserves the shape of the blunted crack. This means that further dislocations can be expected to be emitted in the same direction, provided that the dislocation can move so far away that its effect on the local stress field at the crack tip is small. The crack shape studied is thus preserved during the blunting process.

Figure 3 shows the force required for cleavage or dislocation emission as a function of the blunting, for seven different decay lengths of the force law. The results for the sharp crack (zero blunting) are reported on the y-axis. We find that increasing the decay length increases the load required to propagate the crack (see also Zhou et al.[6]). This is because increasing raises the surface energy and therefore the loading to cleave. The critical values observed are 4–7% above the values expected from the Griffith criterion, this discrepancy is attributed to the discreteness of the lattice (lattice trapping[27]). Two main effects are seen with increasing blunting. For all force laws, blunting increases the critical loadings to cleave or to emit, but only by a modest amount. For 13 layers of blunting the increase is only approximately 20%. This should be compared to estimates derived from linear elasticity of elliptic cracks giving an effect of around 40% for a single layer of blunting, and 250% for 13 layers[8]. Secondly, for a range of force law parameters a normally brittle crack is observed to emit dislocations after being blunted by one or two layers. Here, although the force required to cause the blunt crack to emit is still larger than the load that cleaves the sharp crack, the force required to propagate the crack has increased even more, shifting the balance between emission and cleavage.
For each value of the blunting, there is a transition from cleavage to dislocation emission with increasing , caused by an increase in the surface energy. Figure 4 shows the critical value of the force law parameter for which the crack response changes from cleavage to emission. The first layer of blunting results in a significant reduction of , causing a wide range of force laws to favor emission. Further increase in the blunting causes to increase marginally. Thus the first layer or two of blunting tend to enhance ductility, and the subsequent effects are much smaller. We have not been able to explain this effect on the basis of analytic theory.
B Discussion of the mode I results

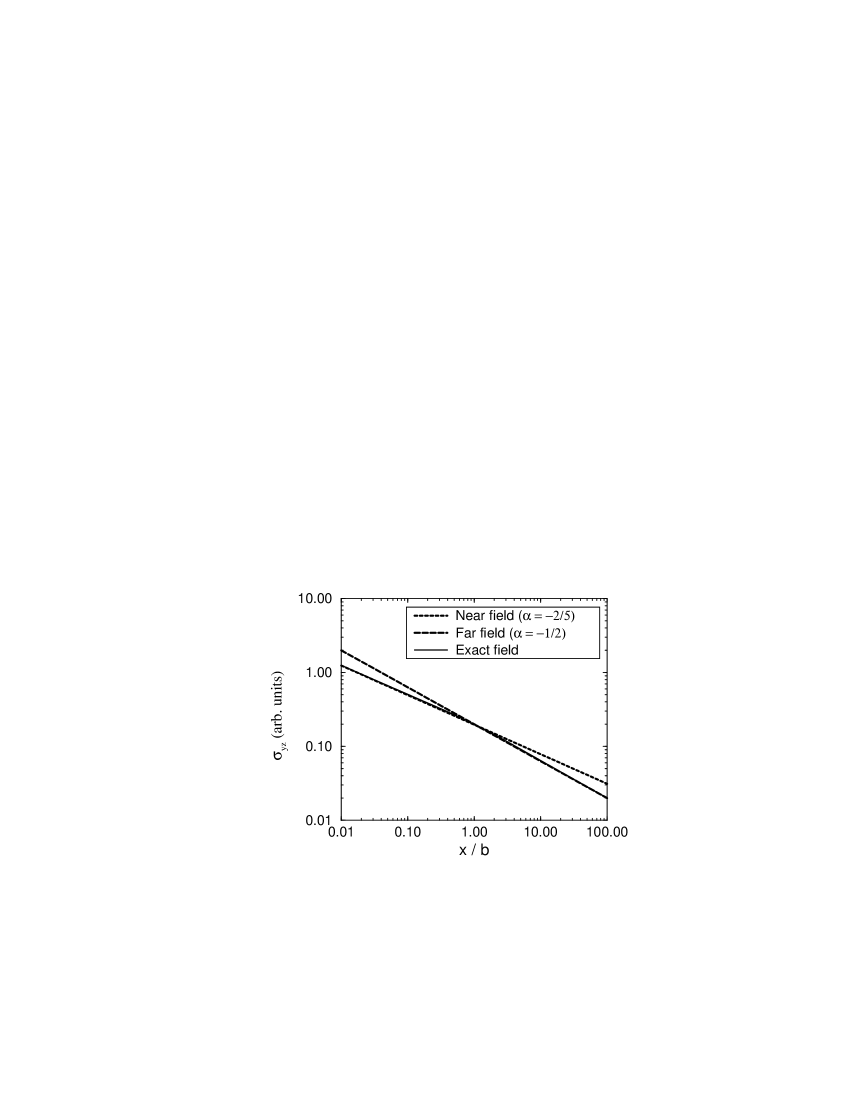
In order to understand these results, we have analyzed the nature of the elastic fields around a wedge crack (see the Appendix). Simplistically, one would expect that the increased opening angle should reduce the stress singularity at the crack tip, making cleavage more difficult. However, we find that the strength of the stress singularity at the end of a blunt crack with a angle is not changed significantly compared to a sharp crack. In particular, the exponent of the singularity has only changed from -0.5 to -0.488, see figure 5. Therefore, purely from considerations of the crack tip field, we would not expect any significant change in the load required to propagate the crack, and believe that this explains the smallness of the blunting effect. This expectation is confirmed by figure 6, which show the elastic strain field five atoms ahead of the crack for a completely linear (but still discrete) system. The effect of the blunting on the tensile strain (), which should be the most important for cleavage, is minimal, although some reduction is seen when the first layer of blunting is introduced. When the crack tip is blunted only by one layer, the crack is symmetric and it does not resemble the shapes studied in the Appendix; the behavior near a corner is thus not relevant, nor is continuum theory expected to be a good description when only a single atomic layer has been removed. As the blunting is increased, the actual crack shape approaches that of the ideal theoretical shape studied in the Appendix, and the stress field then approaches the value corresponding to the wedge crack. Since that value is virtually indistiguishable from the stress in front of a sharp crack, the stress is seen to increase again when the blunting increases.
The decrease in strain when the first layer of blunting is introduced is consistent with the observed increase in the force required to propagate the crack. However, the elastic behavior completely fails to explain the additional increase in the force to cleave as the crack is further blunted, since it would indicate that this force should decrease slightly again[28]. Clearly other effects are important.
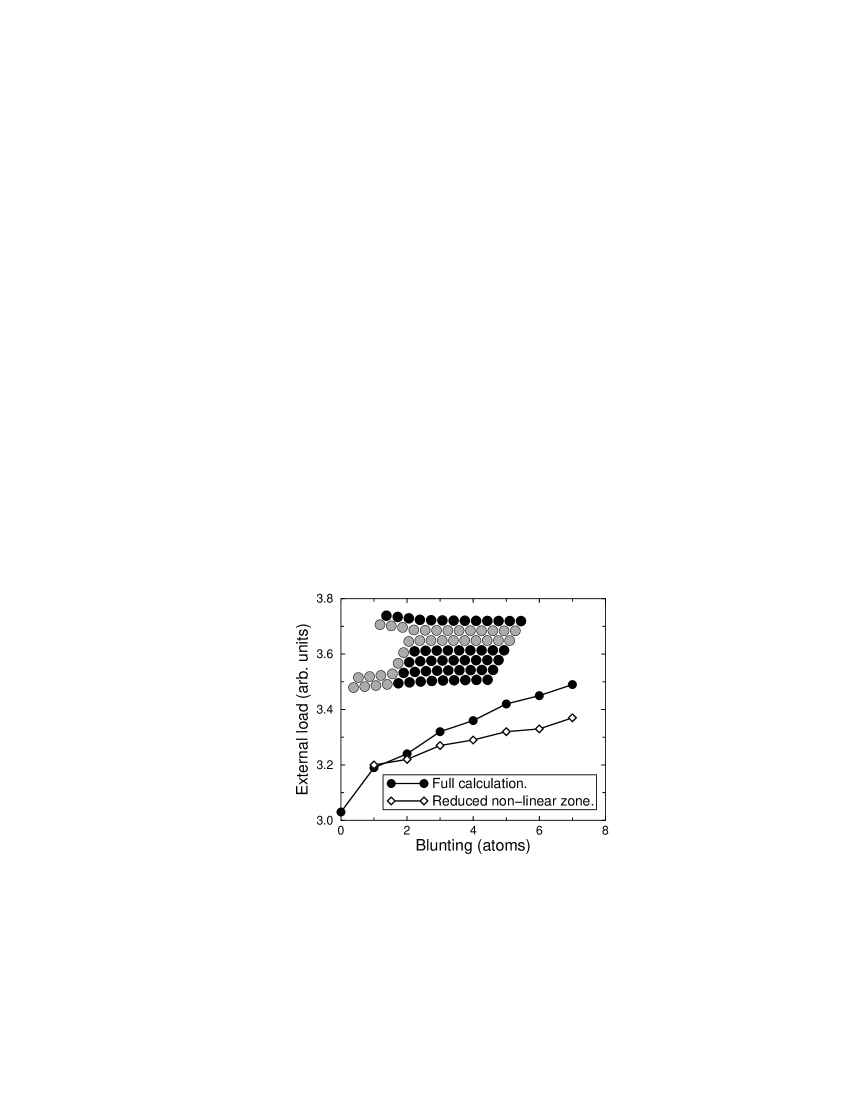
One such effect is the non-linearities in the force law. We have found that these nonlinearities explain the increase in the cleavage stress intensity seen in figure 3. To evaluate their effects, we have partly “turned them off” by reducing the size of the non-linear zone. The results are illustrated in figure 7 for . Here the non-linear bonds (cf. inset) include only the bonds between surface atoms. Reducing the size of the non-linear zone does not change the critical loading when the blunting is only one atomic layer. For larger values of the blunting, reducing the non-linear zone reduces the critical load to cleave. The effect of the blunting the crack beyond one layer thus becomes smaller when the non-linear zone is reduced. This is caused by a stretching of the bonds of the atoms near the end of the crack. The non-linear force-law permits bonds to be stretched further than would otherwise be the case, thus accommodating more of the strain. This will tend to unload the crack tip bond, inhibiting cleavage.
This leads us to conclude that the inhibition of cracking caused by the first layer of blunting is mainly due to a change in the elastic fields around the crack, but that further inhibition is caused by non-linear bonds along the end of the crack unloading the crack tip.
Since the effects of the nonlinearities can be expected to depend somewhat on the actual potential used in the simulations, it is not entirely clear that these effects will be present in three-dimensional simulations using more complicated potentials. The effect of the changes in the elastic field are going to be preserved, so we can expect that the effect of the first layer of blunting will be preserved. However, it is unclear how effects like surface stress and surface relaxations, typically seen both in experiments and in many-body potentials, will change the behavior as the blunting is increased. Here it is reassuring to note that recent simulations of cracks in NiAl[26] and in Al[8] give results very similar to the ones observed here. Both sets of simulations use the Embedded Atom many-body potentials. The crack geometries differ somewhat from this work, but the increases in the critical loads are similar. For one crack orientation the shift from cleavage to dislocation emission is observed in NiAl, similarly to the results presented here.
It is now clear that the presence of sharp corners in the blunt cracks is highly significant for its behavior, since stress concentrations appear at these corners that may be almost as strong as the stress concentration at the tip of a sharp crack. Macroscopically blunted cracks may appear to have a smooth shape, but when the blunting is only a few tens of lattice constants, or even smaller, the crystal structure makes it almost inevitable for sharp corners to be present in the crack tip configuration. Furthermore the dislocation emission processes creating the blunting will almost unavoidably lead to angular crack tip shapes similar to the one studied here, and will not create smoothly blunted cracks. The exact angles of the corners will, of course, depend on the detailed crystallography. From figure 5 it can be inferred that for and corners, the effect of the blunting on the stress fields is still small, although the effect is expected to be significant at least in the case.
The change in deformation mode, from a brittle cleavage to a ductile emission as the crack is blunted on the atomic scale, may have a significant impact on the macroscopic behavior of the material. Mesarovic[17, 18] has shown how a crack tip moving through a material will attract dislocations located in a relatively broad strip ahead of the crack tip, causing them to move towards the tip and ultimately collide with it. Such collisions will blunt the crack, and in some materials be sufficient to arrest it.
The two-dimensional nature of the simulations presented here invoke the picture of infinitely long straight dislocations interacting with a straight crack tip. In reality neither the crack nor the dislocations have such idealized shapes. The dislocations interacting with the crack are likely to be short segments or loops, and only a short segment of the crack is thus likely to be blunted. The result is a crack front where short segments are arrested while the rest of the crack moves on, until either the local stress intensity factor becomes sufficient to reinitiate crack propagation, or until the sharp crack moves around the obstacle. This local “crack trapping effect” gives rise to a gradually increasing crack tip toughness as the dislocation density is increased[18], instead of the complete inhibition of sharp crack propagation that two-dimensional simulations would suggest.
Recently, Beltz et al.[29] have proposed a continuum plasticity model for cleavage. They show that the “shielding ratio”, i.e. the ratio between the macroscopic toughness and the microscopic crack tip toughness, depend sensitively on the ratio between the microscopic crack tip toughness and the yield stress. This means that a modest increase in the microscopic toughness of the crack tip may give an enormous increase in the macroscopic toughness of the material. Mesarovic[18] uses this model to show that if collisions with pre-existing dislocations locally arrest the crack, they can increase the crack tip toughness by a factor 5–7 causing an increase of the macroscopic toughness by 2–3 orders of magnitude. In this way he can explain the vast difference in fracture toughness of iron-silicon and tungsten at 77K.
This mechanism, where collisions with preexisting dislocations blunt the crack and thereby arrest segments of the crack, will only lead to a high macroscopic toughness if the blunting arrests the crack completely, or significantly increases the load required to propagate the crack further. We find that the complete arrest is a possibility, since cracks in some materials (those with high values of in this study) will start emitting dislocations in stead of propagating as soon as the crack is blunted. Other materials, however, will not change behavior. In these materials the effect of blunting is negligible, and the mechanism discussed above will not lead to a high toughness.
IV The blunt crack under mode II loading.
We have also investigated the behavior of blunt cracks under mode II loading. Figure 8 shows the non-linear zone used for these simulations. In this case the spurs allowing dislocation emission on inclined planes have been removed.
Since the crack is not symmetric, the sign of the load is important. The sign convention used is given in figure 8. When the crack is loaded, it is seen that dislocations are not necessarily emitted in the sharpest corner. Under negative load the dislocation is emitted in the lower, more blunt corner, where the stress concentration is smaller (see figure 9). This is an effect of the surface energy, in both cases the dislocation is emitted in such a way that the surface area is reduced by the emission. The surface energy thus assists the dislocation nucleation, and this effect dominates that of the stress singularity. This effect is similar to the “ledge effect” under mode I loading, where the creation of extra surface at the crack tip may dominate the energetics of the emission[6].
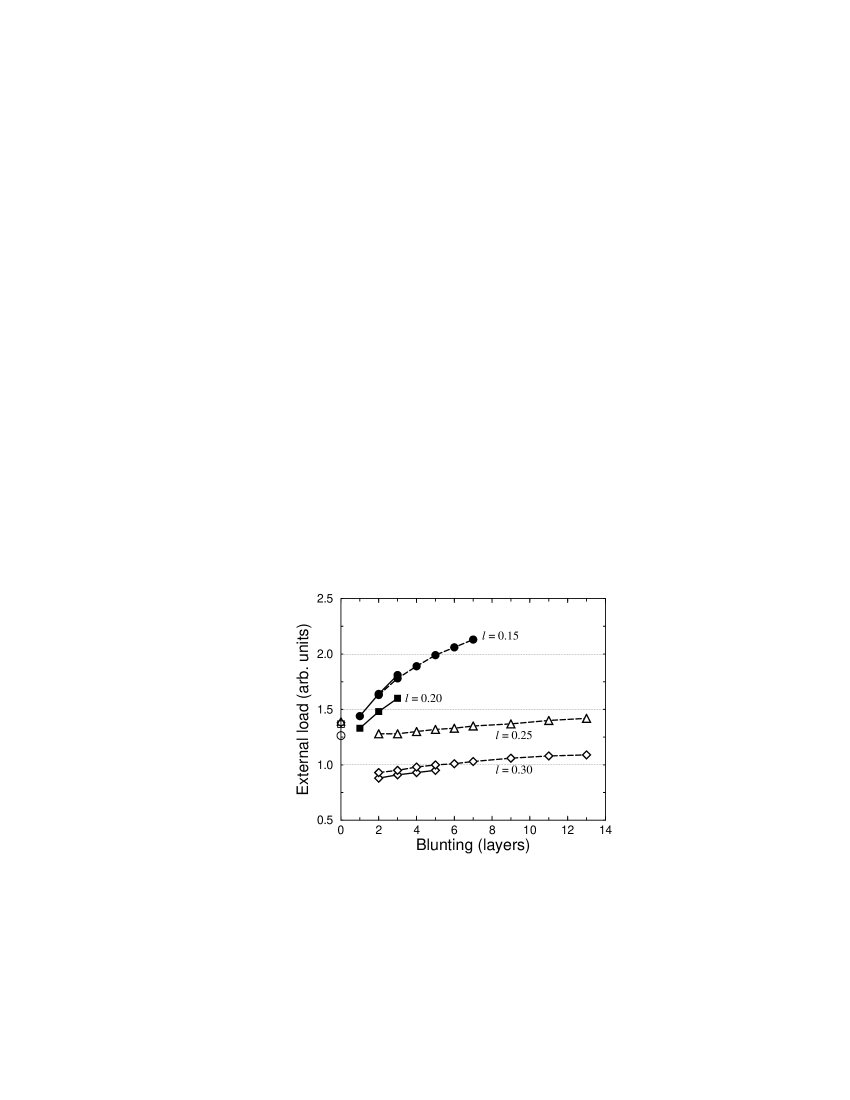
Figure 10 shows the load required for mode II emission, under positive loading. No measurements were attempted for the sharp crack, since it would require a simultaneous mode I loading to keep the crack open. In the graph, filled symbols connected by a solid line indicated data obtained using the full non-linear zone shown in figure 8. For four or more layers of blunting the corner collapsed when a load was applied, see figure 9c[30]. The collapse could be prevented by using a smaller nonlinear zone, where the upper and lower two layers in figure 8 are removed from the nonlinear zone. The data obtained in this way are shown connected by a dashed line. The reduction of the non-linear zone is seen to cause a tiny change in the force required to emit a dislocation. For the force law the corner collapsed for all levels of blunting, only data obtained with the reduced nonlinear zone is given. For , dislocation emission again occurred before collapse of the corner for sufficiently low levels of blunting. For all force laws with the emitted dislocation immediately climbed one slip plane up, leaving an atom in the corner (figure 9d). These cases are shown with open symbols on the graph. They clearly have a different dependence on the blunting, and since the dislocation moves along the very edge of the reduced non-linear zone, such reduction has a significant effect on the force required to emit.

The results of loading the crack in the negative direction is shown in figure 11. Since the material is very brittle for , the crack preferred to branch and no emission data were obtained for that force law.
For both directions of the load, it is seen that the effect of the blunting is far more pronounced than in the mode I case (figure 3). This is in agreement with the expectations from continuum linear elasticity, as shown in figure 5. The stress singularity near the 60∘ corner is reduced from to , giving a significant reduction of the stress at the corner as the blunting is increased. For the force laws and , the magnitude of the effect of the blunting is consistent with this change in the exponent, if we assume that the dislocation is emitted when the shear stress one lattice constant ahead of the crack tip reaches a critical value. For the other force laws the unusual emission process mentioned above gives a different dependence of the blunting.
For negative loading, emission is seen from the 120∘ corner. The dependence on blunting is even stronger than for positive loading. In this case continuous linear elasticity predicts no stress singularity in the corner, and indeed no stress at the corner, provided the load is pure mode II. However, the symmetry axes of the corners are rotated with respect to the load, so in neither case is the load pure mode II as assumed in the Appendix, but is a mixture of mode I and mode II.
For both signs of loading, the effect of the surface energy is clearly seen by comparing with the Rice predictions[5] for the sharp cracks, as modified to reflect the plane stress situation studied[25, 31] (the original criterion was developed for plane strain)
| (3) |
where is the so-called “unstable stacking fault energy”[5]. In figures 10 and 11 the Rice predictions are plotted along the y-axes. These predictions have been shown to be in good agreement with atomic simulations of sharp cracks[25], and predict only a small variation of the critical load for emission when the force law is varied, since does not vary much for the values of studied here. The far larger observed variation of the critical load is caused by the surface energy, and it is seen that a high surface energy (high value of ) enhances the emission significantly. The effect of the surface energy on the emission process will depend on the ratio between the surface energy and the unstable stacking fault energy (), since controls the energy required to create the dislocation. For most fcc metals it is approximately 5–10, for bcc metals 1–7[5]; in our simulation it varies from 1.4 () to 4.3 (). We would thus expect that the effect of the surface energy will be at least as significant in real materials as in our experiments.
As is seen in figure 5, the stress singularity in mode III is stronger that in mode II, but weaker than in mode I. We would therefore expect that a blunt crack loaded in mode III behaves in a way that is intermediate between the observed behaviors of mode I and mode II cracks, i.e. we would expect a dependence on the critical load on the blunting that is stronger than for mode I, but weaker than for mode II. Since the surface area is not changed under mode III emission, we would not expect the strong dependence on the surface energy that we observe in mode II.
V Conclusion.
We have examined the behavior of blunted cracks under mode I and mode II loading. The mode I results indicate a new mechanism for enhanced ductility in some materials. We find that blunting the crack increases the force required to propagate the crack, but only by a surprisingly modest amount. Ten layers of blunting causes an increase of 15–20%. The relative modest magnitude of the effect can be attributed to the sharp corner of the blunt crack, where the stress singularity under mode I loading is almost as strong as for a sharp crack. Despite the small effect on the cleavage criterion, for many force laws the blunting causes the crack to change behavior and to start emitting dislocations instead of propagating. This has the consequence that if a crack in such a material absorbs a dislocation at the crack tip, a segment of the crack will locally be arrested, leading to an increase in the microscopic crack tip toughness, which further may lead to a much larger increase in the macroscopic toughness of the material. The blunting effects presented here may thus, in combination with the effect of attracting dislocations to the crack tip described by Mesarovic[17, 18], cause an increase in the fracture toughness of materials by many orders of magnitude.
Under mode II loading dislocation emission always occurs in such a way as to decrease the total surface area of the crack. The surface energy will thus aid the emission process, and may dominate over the stress singularity. The emission is thus not necessarily from the corner with the larger stress concentration. When the surface energy is high, the emission is seen to occur at loads significantly below the value predicted by Rice. The effects of blunting are greater than for mode I loading, in agreement with the predictions of linear elasticity.
Acknowledgements.
We would like to thank Robb Thomson, Rob Phillips and Vijay Shastry for many fruitful discussions, and for reading the manuscript. This work was supported by the Department of Energy under Grant Number DE-FG02-84ER45130, by the National Institute of Standards and Technology under award 60NANB4D1587, and by the Office of Naval Research under Grant Number N00014-92-J-4049.Analytic treatment of the blunt crack.
In order to better understand the simulations, we have investigated the behavior of the stress field near a blunt crack, in the framework of linear elasticity. Unfortunately, an exact analytic solution for the stress field around a blunt crack loaded in mode I or II can only be found for an elliptic crack in an infinite medium[32]. In this section, we show that for some geometries the problem can be solved under the assumption of antiplane strain (i.e. mode III loading). We then use simpler geometries to elucidate how the change to plane elasticity (mode I and II) will modify the results.
1 The blunt crack in antiplane strain.
The stress field around a wedge-shaped crack loaded in mode III (see fig 12a) is well known[33, 34]. The stress field displays a singularity at the crack tip, but the singularity is weaker than for the sharp crack, and vanishes as the opening angle reaches .
| (4) |
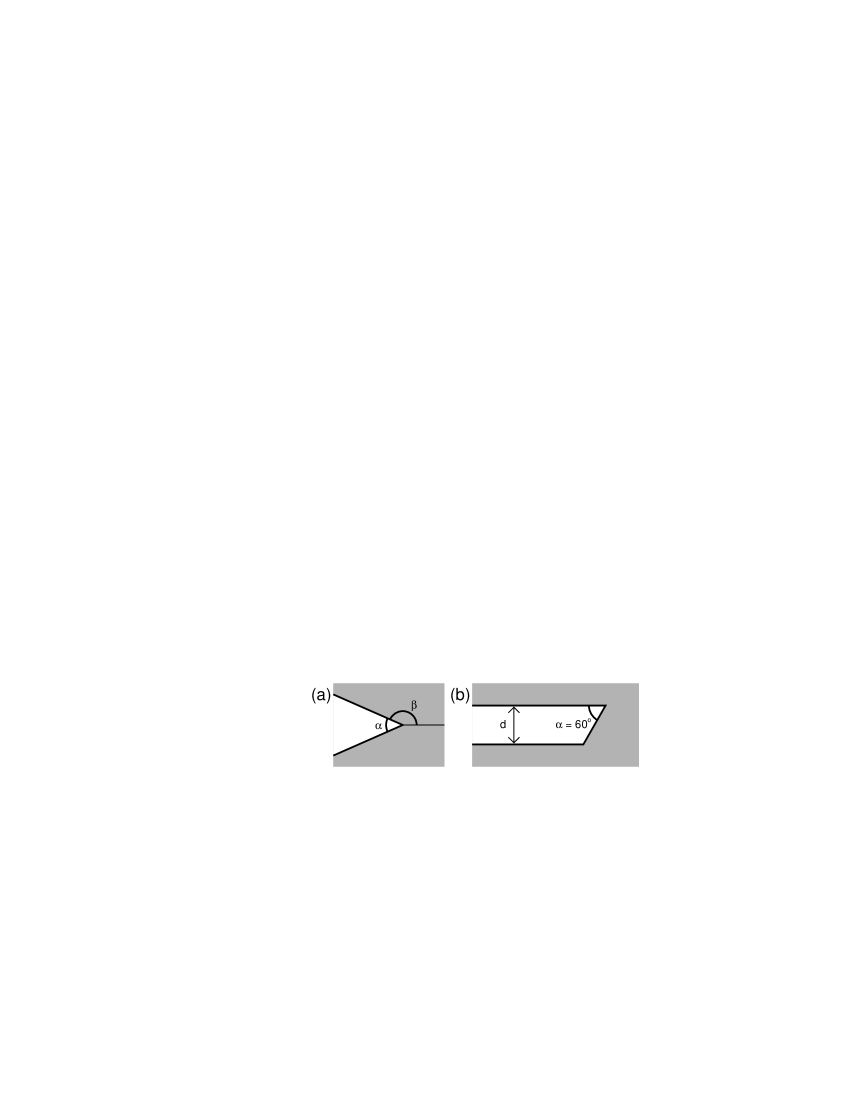
The real geometry of a blunt crack is more like the one shown in figure 12b. Here we would expect the field far from the tip to be unaffected by the blunting, i.e. to scale like . Near the tip the field must be similar to the field from a wedge crack, i.e. , where is given in equation 4. A weaker singularity will also be present at the lower corner of the crack. We can then approximate the total stress field by a field made up of these parts, by matching the stresses from the different solutions at an “appropriate” distance from the crack tip. It can be expected that this matching distance will be of the order of . We will verify this naïve picture with an exact solution of the problem, using conformal mappings.
In antiplane strain, the stresses can be written as the derivatives of an analytic function, where . This representation has the nice property, that the boundary conditions (traction free surfaces) are preserved under a conformal mapping. If we know is a solution to a known problem (), and if the function maps the known problem into a new problem () in such a way that the boundary maps onto the boundary, and the material region maps onto the material region, then is a solution to the new problem (provided that is analytic everywhere inside the material)[34].
We will choose the upper half plane as our known problem, and use the Schwarz-Christoffel (S-C) transformation to generate the map. Taking the angles as and a possible S-C transformation is
| (5) |
where and are complex constants to be determined later to give the right size, orientation and position of the blunt crack. Using the transformation , and decomposing the resultant rational function into partial fractions, we get
| (7) |
| (8) |
where we have set and to and 0, respectively, to get a blunt crack of width 1 with the crack tip at the origin. The constants and are equal to , i.e. the -sum is over the roots of .
In (the upper half plane) the following solutions are consistent with the boundary condition, traction free surfaces:
| (9) |
Each gives a solution to the blunt crack, . However, we must discard all solutions with because the stress would diverge at infinity, and all solutions with because the displacement diverges at the origin. This leaves us ( is not an option, since it gives a constant and thus no stresses anywhere).
We will now expand the solution in the near and far field approximations. In both cases it is important to keep the branch cuts of the logarithms and the non-integral powers out of the material region, and to avoid moving between different branches of these complex functions.
For the far field, i.e. for and we get
| (10) |
and the elastic field becomes
| (11) |
The far field solution is thus identical to the stress field around a sharp crack. From this expansion we get the constant .
The field near the crack tip ( and ) can be found by expanding equation (1) to fifth order in (It vanishes to fourth order!). We then get
| (13) | |||||
| (14) |
and get the stress field
| (15) |
We see that we find the same behavior as near a wedge crack with the same opening angle.
The exact solution is
| (16) |
where must be found numerically, since equation (1) cannot be inverted analytically. Figure 13 compares the exact solution to the asymptotic expressions; it is seen that the asymptotic approximations are quite good everywhere on the axis.
2 The blunt crack in plane elasticity.
The field equations of plane elasticity (plane stress and plane strain) do not allow the same elegant treatment as in antiplane strain. Although a conformal mapping technique is possible[34], the boundary conditions are not preserved under the mapping transformation, complicating the process considerably. In many cases such an approach can still be fruitful, especially if combined with the integral method of Muskhelishvili[35, 36], but the sharp corners of the blunt crack causes unwieldy singularities to appear. If the conformal mapping is expanded as a (truncated) power series, the problem of a blunt crack is soluble using Muskhelishvili’s integral method[37], but the resultant series expression of the stress fields can generally not be summed analytically.
Whereas the blunt crack cannot be solved exactly, a solution for the wedge crack can be found, using a different approach. We describe the stress state of the system by its Airy stress function[36, 38] . The stress function must satisfy the biharmonic equation , and the stresses are then given as suitable derivatives of .
We are interested in solutions to the biharmonic equation that fall off as a power law. In polar coordinates such solutions have the form
| (17) |
where
| (19) | |||||
giving the stresses
| (21) | |||||
| (22) | |||||
| (23) | |||||
| (24) |
We now demand traction-free surfaces, i.e. for where is given by the opening angle (figure 12): . We thus demand that , giving
| (26) |
| (27) |
| (28) |
| (29) |
These two sets of two homogeneous linear equations only have non-trivial solutions if one of the determinants vanish. For the first two equations this happens for
| (30) |
and we get the stress fields
| (33) | |||||
| (35) | |||||
| (37) | |||||
where
| (38) |
The solutions of equation (30) are constrained by the requirement that the stresses vanish at infinity and that the displacements remain finite at the crack tip: . For the sharp crack ( and ) we get and find the known stress field of the crack under mode I loading[34].
Equations (28) and (29) give another eigenequation:
| (39) |
giving the stresses
| (42) | |||||
| (44) | |||||
| (46) | |||||
where
| (47) |
Again is constrained to , which can only be fulfilled for opening angles less than . For the sharp crack we recover the mode II solution.
Figure 5 shows the exponent () of the stress singularity as a function of the opening angle for wedge cracks loaded in mode I, II and III.
The behavior of the mode II solution at is peculiar. As the angle approaches the mode I solution approaches a half-plane under uniform tensile stress. Such a behavior is not possible in mode II, since the boundary conditions prevent a uniformly sheared half-plane (an attempt to apply shear alone would only result in a rotation). It is thus clear that the stress must go to zero as the opening angle approaches . However that behavior is seen already at . Between and a stress field that decays as a power law in is not possible, nor is a stress constant in . It is hard to imagine another form of the stress where it increases as decreases, since any other form would require that another length scale enters, and linear elasticity is known to be scale-invariant.
As a curiosity it can be mentioned that this peculiar behavior also has been seen in a related problem: In the beginning of the century the problem of a wedge loaded at its apex by a couple of moment was solved[39, 40]. A solution was found with the resulting stress field decaying as , diverging for (in our notation) . This strange singular behavior at a physically meaningful angle was later investigated by Sternberg and Koiter[41]. They replaced the couple by a physically realizable force distribution of size , and then solved the stress field for . They found that for the solution converged to the original solution, but below an extra (dominating) term appeared, making the concept of a couple loading unphysical. That extra term is identical to the mode II solution above!
REFERENCES
- [1] Present address: Center for Atomic-scale Materials Physics and Physics Department, Technical University of Denmark, DK-2800 Lyngby, Denmark.
- [2] J. R. Rice and R. Thomson, Phil. Mag. 29, 73 (1974).
- [3] I.-H. Lin and R. Thomson, Acta Mettal. 34, 187 (1986).
- [4] G. Schoeck, Phil. Mag. A 63, 111 (1991).
- [5] J. R. Rice, J. Mech. Phys. Solids 40, 239 (1992).
- [6] S. J. Zhou, A. E. Carlsson, and R. Thomson, Phys. Rev. Lett. 72, 852 (1994).
- [7] V. Shastry and P. Anderson, Modelling Simul. Mater. Sci. Eng. 2, 255 (1994).
- [8] P. Gumbsch, J. Mater. Res. 10, 2897 (1995).
- [9] S. J. Zhou and R. Thomson, J. Mater. Res. 6, 1763 (1991).
- [10] L. P. Kubin et al., Solid State Phenomena 23-24, 455 (1992).
- [11] D. B. Barts and A. E. Carlsson, Phys. Rev. E 52, 3195 (1995).
- [12] N. Zacharopoulos, D. J. Srolovitz, and R. A. LeSar, in Selinger et al.[42], pp. 115–120.
- [13] S. J. Zhou and R. Thomson, J. Mater. Res. 6, 639 (1991).
- [14] A. S. Argon, G. Xu, and M. Ortiz, in Selinger et al.[42], pp. 29–44.
- [15] J. Schiøtz, A. E. Carlsson, L. M. Canel, and R. Thomson, in Selinger et al.[42], pp. 95–100.
- [16] A. Paskin et al., Acta Metall. 33, 1987 (1985).
- [17] S. D. Mesarovic, in Selinger et al.[42], pp. 63–68.
- [18] S. D. Mesarovic, submitted to J. Mech. Phys. Solids (unpublished).
- [19] S. Kohlhoff, P. Gumbsch, and H. F. Fischmeister, Phil. Mag. A 64, 851 (1991).
- [20] E. B. Tadmor, M. Ortiz, and R. Phillips, Phil. Mag. A (1996), (in press).
- [21] S. J. Zhou, P. S. Lohmdahl, R. Thomson, and B. L. Holian, Phys. Rev. Lett. 76, 2318 (1996).
- [22] R. Thomson, S. J. Zhou, A. E. Carlsson, and V. K. Tewary, Phys. Rev. B 46, 10613 (1992).
- [23] L. M. Canel, A. E. Carlsson, and R. Thomson, Phys. Rev. B 52, 158 (1995).
- [24] J. H. Rose, J. R. Smith, and J. Ferrante, Phys. Rev. B 28, 1835 (1983).
- [25] S. J. Zhou, A. E. Carlsson, and R. Thomson, Phys. Rev. B 47, 7710 (1993).
- [26] M. Ludwig, Ph.D. thesis, Universität Stuttgart, Stuttgart, 1995.
- [27] R. Thomson, C. Hsieh, and V. Rana, J. Appl. Phys. 42, 3154 (1971).
- [28] The change in the exponent from to would indicate that the strain five atoms ahead of the crack should have decreased by approximately 1% compared to the sharp crack for 10 layers of blunting. The observed decrease is closer to 4%. This difference is due to mode mixing, the misorientation of the crack introduces some mode II loading. The exponent for the mode II part is , The blunting thus has a larger effect on this part of the strain.
- [29] G. E. Beltz, J. R. Rice, C. F. Shih, and L. Xia, submitted to Acta Metall. et Mater. (unpublished).
- [30] This collapse is actually emission of a dislocation on another slip plane. Such emission processes are not studied further in this paper.
- [31] S. J. Zhou, Ph.D. thesis, Washington University, Department of Physics, St. Louis, Missouri, 1993.
- [32] C. E. Inglis, Trans. R. Inst. Naval Architects 60, 219 (1913).
- [33] S. M. Ohr, S.-J. Chang, and R. Thomson, J. of Appl. Phys. 57, 1839 (1985).
- [34] R. Thomson, Solid State Physics 39, 2 (1986).
- [35] N. I. Muskhelishvili, Some basic problems of the mathematical theory of elasticity: fundamental equations, plane theory of elasticity, torsion, and bending (P. Noordhoff, Groningen, 1953).
- [36] S. P. Timoshenko and J. N. Goodier, Theory of Elasticity, 3rd ed. (McGraw-Hill, New York, 1970).
- [37] H. Kuang, private communication.
- [38] G. B. Airy, Brit. Assoc. Advan. Sci. Rept. (1862).
- [39] S. D. Carothers, in Proceedings (Royal Society, Edinburgh, 1912), Vol. 23, p. 292.
- [40] C. E. Inglis, Trans. R. Inst. Naval Architects 64, 253 (1922).
- [41] E. Sternberg and W. T. Koiter, J. Appl. Mech. 25, 575 (1958).
- [42] in Fracture — Instability, Dynamics, Scaling, and Ductile/Brittle Behavior, Vol. 409 of Mat. Res. Soc. Symp. Proc., edited by R. L. B. Selinger, J. J. Mecholsky, A. E. Carlsson, and J. E. R. Fuller (Materials Research Society, Pittsburgh, Pennsylvania, 1996).