[
Unusually Large Thermal Expansion of Ag(111)
pacs:
PACS numbers: 68.35, 63.20.Ry, 82.65.DpWe investigate the thermal behavior of the (111) surface of silver, using phonon frequencies obtained from ab initio total energy calculations, and anharmonic effects treated within a quasiharmonic approximation. Our results reproduce the experimental observation of a large and anomalous increase in the surface thermal expansion at high temperatures[1]. Surprisingly, we find that this increase can be attributed to a rapid softening of the in-plane phonon frequencies, rather than due to the anharmonicity of the out-of-plane surface phonon modes. This provides evidence for a new mechanism for the enhancement of surface anharmonicity. A comparison with Al(111) shows that the two surfaces behave quite differently, with no evidence for such anomalous behavior on Al(111).
]
The equilibrium lattice constant of a crystal is determined by a balance between the various attractive and repulsive forces present within the solid. When the crystal is cleaved to form surfaces, this balance is destroyed, and the atoms at the surface therefore relax either inwards or outwards. Both calculations and experiments show that the low-index surfaces of most metals, including the noble metals, relax inwards (at temperature K), in accordance with simple bond strength - coordination number arguments.
However, recent experiments [1] show that this situation is dramatically reversed for the Ag(111) surface as the crystal is heated: Up to K, the first interlayer spacing is indeed contracted by 2.5% relative to the bulk separation ; but upon increasing further, increases much more rapidly than does, so that by 1150 K it is expanded by 10%. Correspondingly, the surface coefficient of thermal expansion becomes more than ten times as large as the bulk coefficient of thermal expansion [2]. Since thermal expansion arises from the anharmonicity of the interatomic potentials, this in turn indicates a significant enhancement in anharmonicity at the surface.
It has long been realized that it is possible for measures of anharmonicity (such as coefficients of thermal expansion, mean squared displacements of atoms, and the rate of change of phonon frequency with temperature) to be larger at surfaces than in bulk crystals[3]; and the conventional lore recognizes two possible reasons for such an enhancement: (i) the breaking of symmetry due to the presence of the surface makes the interlayer potential more asymmetric at the surface than in the bulk, increasing the size of the odd terms in a Taylor series expansion of the energy in powers of atomic displacements; (ii) atomic displacements may be greater at the surface than in the bulk, thus increasing the relative magnitudes of the higher-order anharmonic terms in this series expansion. However, early experiments and calculations [4],[5] on metal surfaces showed that measures of anharmonicity are typically one to three times larger at the surface than in the bulk, and thus the significantly larger enhancement seen on Ag(111) is remarkable, and is especially unexpected for a close-packed face-centered-cubic (fcc) (111) surface.
Moreover, there is a serious disagreement between experiments and calculations on the Ag(111) surface: Lewis[6] has carried out molecular-dynamics simulations using interatomic potentials obtained using the embedded-atom-method (EAM) to investigate the thermal behavior of Ag(111). The results of these simulations differ significantly from those reported experimentally: The surface layer relaxes inwards at all temperatures, and is less than twice as large as .
We note that there have been other recent experimental observations of large enhancements in surface anharmonicity, but on more open surfaces, viz. Pb(110)[7], Ni(001)[8] and Cu(110)[9]. In contrast to the situation for Ag(111), the results of simulations using EAM potentials to study Cu(110)[10] and Ni(001)[11] show the same qualitative features as the experimental data, though the calculated enhancement is somewhat smaller than that measured experimentally.
Why then is there a disagreement between experiment and calculation for Ag(111)? Is it due to inadequacies of the EAM potentials? Or could it be an indication of some hitherto undetected surface phase transition?
To study these questions, we have investigated the anharmonic properties of Ag(111) and (for purposes of comparison) Al(111) by performing ab initio calculations using density functional theory. Fully separable norm-conserving pseudopotentials[12] were used in our calculations, together with a plane wave basis set with an energy cut-off of 60 Ry (20 Ry for Al), and the local-density approximation with Ceperley-Alder exchange-correlation[13]. We have verified that these pseudopotentials provide a satisfactory description of harmonic as well as anharmonic properties of bulk Ag and Al [14].
The surface calculations were performed using a repeated slab geometry consisting of six atomic layers separated by a vacuum layer of the same thickness. The k-point sets used to sample reciprocal space contained seven points in the irreducible part of the Brillouin zone for the undistorted surface; the number of k-points was correspondingly increased upon breaking symmetries by distorting the lattice in order to calculate phonon frequencies. Convergence of calculated anharmonic quantities with respect to energy cut-off, number of k-points and number of layers was carefully tested for.
Our strategy is to compute static energies and phonon frequencies by performing self-consistent calculations at K, and then extend our results to finite temperatures by using a quasiharmonic approximation.
In order to obtain a qualitative understanding of the mechanisms in operation, and a first estimate of the size of surface anharmonic effects, we use a simple model of the lattice dynamics of the surface, considering only three phonon modes, in all of which the topmost layer of the slab moves as a whole – i.e., we assume that the displacements are confined to the first layer of atoms at the surface, and consider only those modes with zero wave-vector. We consider one mode in which the surface atoms vibrate normal to the surface plane (along the direction), and two modes (along = and = ) in which they vibrate in the plane of the surface.
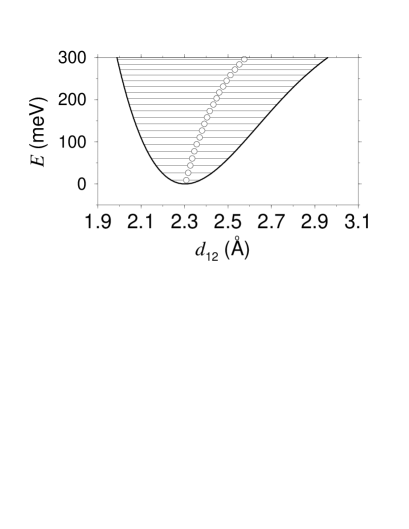
We first computed the change in the total energy of the Ag(111) slab upon varying the first two interlayer separations and , and maintaining the fcc stacking of the bulk crystal. This not only provides the static interlayer potential, but is also equivalent to simulating the vibrational mode along . Our result for the dependence on of the first interlayer potential is plotted in Fig. 1; it is clearly asymmetric about the minimum at Å. We found that allowing for the relaxation of does not have a significant impact on the results for the close-packed (111) surface[15]. For the results presented in Fig. 1 and the rest of this paper, is therefore fixed at the bulk interlayer separation of Å.
To see how this anharmonicity of the interlayer potential is manifested at finite temperatures, we consider a one-dimensional quantum oscillator vibrating in the interlayer potential of Fig. 1. A numerical solution of the Schrödinger equation for this problem furnishes the eigenstates and eigenvalues of such an oscillator, and the mean displacement in the -th eigenstate is obtained by computing the expectation value of the displacement operator in each state. The average value at a finite temperature is then obtained by weighting these results with the corresponding partition function.
Our results for obtained from this procedure (see the open circles in Fig. 3) indicate a modest enhancement in relative to of , which is in agreement with the EAM results[6], but much smaller than that measured experimentally.

We next performed “frozen-phonon” calculations to study the behavior of the two in-plane modes in our model. At each value of , the atoms in the surface layer were displaced along first the and then the direction, and the total energy was computed for a series of displacements up to Å. The curvature of the resulting plots of energy versus displacement gives the mode frequency. We find that the frequency of these in-plane modes decreases surprisingly rapidly upon increasing ; these results are plotted in Fig. 2. The value of the Grüneisen parameter extracted from our results for the in-plane modes (between 5.5 and 7.5) is significantly larger than the average of 2.46 for bulk modes[16]. Thus, the frequently made assumption[4] that is approximately equal for surface and bulk modes is clearly invalid in this case.
The surface can thus reduce its vibrational free energy significantly by expanding outwards, though such an outward expansion would be accompanied by an increase in the static energy. The optimal value of is determined by minimizing the free energy[3]:
| (1) |
at each temperature . Here, is the static interlayer potential plotted in Fig. 1, and is the vibrational free energy corresponding to vibrations in the -th direction, which, in the quasiharmonic approximation, is given by[3]:
| (2) |
where and are Boltzmann’s constant and Planck’s constant respectively. The frequency of the mode polarized along the -th direction, when the first interlayer separation is fixed at , is denoted by ; its value is obtained directly from our frozen-phonon calculations for the two in-plane modes (see Fig. 2). For the out-of-plane mode, we compute numerically, in such a way as to reproduce the exact result for that we have already obtained by solving the Schrödinger equation when only the mode along is present.

Our final result for in the presence of all three modes, obtained by minimizing the free energy given by Eq. (1), is given by the filled circles in Fig. 3 (note that the temperatures are normalized with respect to the melting temperature ). The experimentally measured data points[1] are also plotted; both the experimental and theoretical curves display the same features: there is little or no change up to about , i.e., K, beyond which there is a rapidly increasing trend towards outwards relaxation of the surface layer. At , i.e., K, we find that the surface layer is relaxed outwards by about 15%, whereas the experiments show an outwards relaxation of . Given the simplicity of our model, and the large experimental error bars, this is as good an agreement as we can hope for.
The increasing slope of reflects a flattening in the minimum of the free-energy curve, and the rapid increase in at high is a precursor to the development of a saddle-point instability in the free-energy curve, similar to that which has been obtained in studies of the surface melting of copper surfaces [17]. We emphasize that the rapid decrease of for the in-plane modes is crucial for obtaining the large outwards expansion; if, for example, this rate of decrease were to be halved, the maximum outwards expansion would be drastically reduced to about 2%.
We expect that our numerical results will change slightly upon including other surface phonon modes and allowing for dispersion through the surface Brillouin zone; however, we note that measurements of surface phonon frequency-shifts suggest that the degree of anharmonicity remains approximately constant through a surface phonon band[18]. We should also allow for expansion in the plane of the surface, but this should in fact reinforce the softening of the in-plane modes.

To check whether such behavior is universal or a peculiar property of Ag(111), we repeated the same calculations on bulk aluminum and Al(111). Our results for the relaxation of for Al(111) are also plotted in Fig. 3, and it is obvious that there is no evidence for a dramatically increased surface anharmonicity on Al(111).
Our results indicate that in addition to the two well known sources of enhanced surface anharmonicity that we have already mentioned, a third (and hitherto neglected) effect is more important in causing the dramatic enhancement in surface anharmonicity on Ag(111): Not only do interlayer potentials at the surface tail off rapidly with increasing , they simultaneously become much flatter in the xy plane – in other words, the operative effect is not so much a decrease in the absolute magnitudes of interlayer potentials at the surface, but a reduction in their corrugation parallel to surface. As a consequence, those surface phonon modes in which atomic dispacements have significant components in the surface plane soften rapidly upon increasing interlayer separations; this drives the outermost layer of atoms to expand outwards at high temperatures.
An accurate description of the in-plane corrugation clearly requires taking into account the correct distribution of the electronic charge density (and the resulting chemical bond formation) at the surface. It seems plausible that when rebonding effects become significant, the EAM (which essentially ignores the relaxation of atomic charge densities and the rehybridization of electronic states) may fail; this may be why Lewis [6] did not observe a large outwards expansion in his simulations.
The rapid decrease in the corrugation of the interlayer potential is evident in Fig. 4, where we have plotted the differences in energies when the outermost layer of atoms occupies various stacking sites. Note that (i) the flattening occurs more rapidly for Ag(111) than Al(111) (ii) upon allowing for the lighter mass of Al atoms, the effective corrugation relevant for phonon frequencies is actually larger for Al(111) than for Ag(111). Both these factors contribute to the enhancement in of the in-plane top-layer modes and thus the larger thermal expansion of Ag(111).
Such a decrease in the corrugation of the substrate potential would also tend to favor a top-layer reconstruction of the type that has been observed on Au(111)[19] or Pt(111)[20], where the substrate potential is too weak to prevent a densification of atoms in the topmost layer. However, experiments apparently show no evidence of such a reconstruction on Ag(111)[1]; further calculations of surface stresses and the strength of intralayer couplings should help clarify the situation.
Our conclusion that the enhancement in surface anharmonicity arises mainly from in-plane vibrations is supported by the experimental observation that the magnitude of in-plane vibrations on Ag(111) rises faster than the magnitude of out-of-plane vibrations[21]. Experiments on other surfaces, e.g., Cu(001), have detected in-plane vibrational amplitudes that are larger than out-of-plane amplitudes[22], and it is interesting to speculate whether this (counter-intuitive) result arises from the same cause, i.e., from a rapid softening of in-plane frequencies due to thermal expansion.
In conclusion, we have demonstrated that the anomalously large surface thermal expansion of Ag(111) can be attributed to a rapid softening of in-plane vibrational modes (related to a rapid flattening of the corrugation of the interlayer potential) upon increasing interlayer distances. We have shown that a similar scenario does not, however, lead to significant enhancement on Al(111).
REFERENCES
- [1] P. Statiris, H.C. Lu and T. Gustafsson, Phys. Rev. Lett. 72, 3574 (1994).
- [2] Throughout this paper, when we refer to “surface thermal expansion”, it is implied that we are referring to changes in interlayer separations. It is assumed that intralayer separations are the same in the bulk and at the surface.
- [3] R.E. Allen and F.W. de Wette, Phys. Rev. 179, 873 (1969).
- [4] J.M. Wilson and T.J. Bastow, Surf. Sci. 26, 461 (1971 ).
- [5] L. Dobrzynski and A.A. Maradudin, Phys. Rev. B 7, 1207 (1973); S.K.S. Ma, F.W. de Wette and G.P. Alldredge, Surf. Sci. 78, 598 (1978).
- [6] L.J. Lewis, Phys. Rev. B 50, 17 693 (1994).
- [7] J.W.M. Frenken, F. Huusen and J.F. van der Veen, Phys. Rev. Lett. 58, 401 (1987).
- [8] Y. Cao and E. Conrad, Phys. Rev. Lett. 65, 2808 (1990).
- [9] G. Helgesen, D. Gibbs, A.P. Baddorf, D.M. Zehner and S.G.J. Mochrie, Phys. Rev. B. 48, 15 320 (1993).
- [10] L. Yang and T. Rahman, Phys. Rev. Lett. 67, 2327 (1991).
- [11] Y. Beaudet, L.J. Lewis and M. Persson, Phys. Rev. B 47, 4127 (1993).
- [12] X. Gonze, R. Stumpf and M. Scheffler, Phys. Rev. B 43, 8503 (1995).
- [13] D.M. Ceperley and B.J. Alder, Phys. Rev. Lett. 45, 566 (1980).
- [14] e.g., the lattice constant of Ag(Al) is 4.06 (3.94) Å, the bulk modulus is 1.22 (0.80) MBar, and the pressure derivative of the bulk modulus is 5.94 (4.22); all of these values compare well with experiment.
- [15] The relaxation of changes by , and by .
- [16] K.A. Gschneider, Jr., in Solid State Physics, ed. by F. Seitz and D. Turnbull (Academic, New York, 1964), Vol. 16, p. 27.
- [17] C.S. Jayanthi, E. Tosatti and L. Pietronero, Phys. Rev. B 31, 3456 (1985).
- [18] G. Benedek and J.P. Toennies, Phys. Rev. B 46, 13 643 (1992).
- [19] J.V. Barth, H. Brune, G. Ertl, and R.J. Behm, Phys. Rev. B 42, 9307 (1990); K.G. Huang, D. Gibbs, D.M. Zehner, A.R. Sandy and S.G.J. Mochrie, Phys. Rev. Lett. 65, 3313 (1990).
- [20] A.R. Sandy, S.G.J. Mochrie, D.M. Zehner, G. Grübel, K.G. Huang and D. Gibbs, Phys. Rev. Lett. 68, 2192 (1992).
- [21] T. Gustafsson, private communication.
- [22] Q.T. Jiang, P. Fenter and T. Gustafsson, Phys. Rev. B 44, 5773 (1991).