IISc-CTS/8/99
UG-FT-105/99
LNF-99/030(P)
hep-ph/9912395
QCD and Total Cross-sections aaaPresented by G. Pancheri at the XXIX International Symposium on Multiparticle Dynamics, June 1999, Brown University, U.S.A. To appear in the Proceedings.
We discuss models for total cross-sections, show their predictions for photon-photon collisions and compare them with the recent LEP measurements. We show that the extrapolations to high center of mass energies within various models differ by large factors at high energies and discuss the precision required from future measurements at the proposed Linear Collider which would allow to distinguish between them.
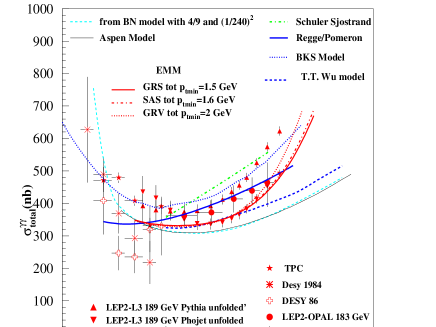
In this talk, we shall discuss total cross-sections and the contribution to them from QCD processes, both for hadronic and photonic reactions. It is by now accepted that it is possible to ‘predict’ the rising trend of total cross-sections, albeit still not with very high accuracy, in a QCD based framework using phenomenological inputs, particularly through the use of the minijet model . This model ascribes the rise of the total cross-sections to the increasing number of low partons, and their collisions. The present knowledge of parton densities in the hadrons has now been extended to photons by the studies of the resolved photon processes, at HERA and LEP . Recently measurements of total cross-sections for photonic processes have become available from HERA and LEP . This is a very important input to the phenomenological efforts towards developing a realistic model for calculation of total cross-sections. Unfortunately, the uncertainties plaguing the experimental measurements do not yet allow us to distinguish between different theoretical models that are available. The situation is illustrated in Fig. 1 where data from L3 Collaboration correspond to two different Montecarlo extrapolations, PYTHIA and Phojet, while OPAL data have been obtained by averaging between them. The differences between the predictions of the various theoretical models are even larger. In the following we shall describe briefly the models which differ the most and indicate with what precision need be measured in future experiments, in order to distinguish between the models.
We shall start with the Aspen model , which predicts the photon-photon cross-section starting from the QCD inspired model for proton-proton and proton-antiproton total elastic and inelastic cross-sections . In this model, total cross-sections are obtained through the eikonal representation in impact parameter space, i.e.
| (1) |
with the eikonal function parametrized through a sum of QCD inspired terms of the type
| (2) |
with describing the impact parameter space distribution of partons in the proton obtained as
| (3) |
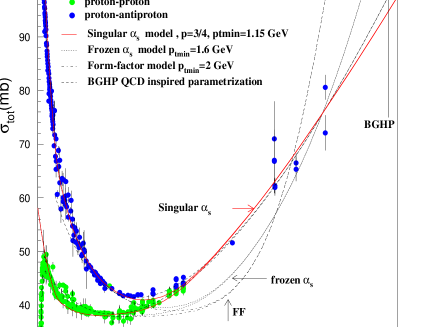
where is the proton form factor with scale . Details about the parametrization of the elementary cross-sections can be found in Ref. [10], here we mention that the functional form reflects the low x-behaviour of gluon and quark densities in the protons. The corresponding fit for proton and antiproton-proton cross-sections is indicated as the BGHP curve in Fig. 2, which we reproduce .
It is based on 11 parameters which allow for a complete description of the proton-proton and proton-antiproton system, including elastic, total and differential cross-section, -parameter and nuclear slope. One can now describe the photoproduction processes with just two new inputs, namely Vector Meson Dominance (VMD) and Additive Quark Model (AQM). This is achieved by using, for the extension to photonic processes, the expression
| (4) |
where the Vector Meson Dominance factor
| (5) |
with
| (6) |
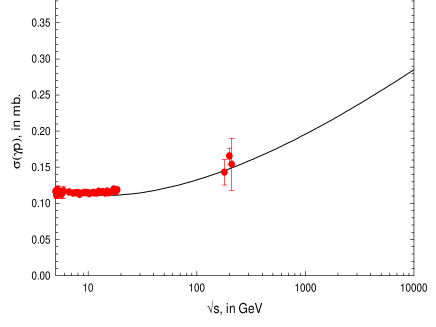
and evaluated at the scale. The eikonal is obtained from the even part of the corresponding function for proton case, through two simple AQM inspired substitutions, that is by scaling of the s-dependence in the elementary cross-sections as , and in the b-shape, i.e. . The comparison of the corresponding prediction with the HERA data is shown in Fig. 3.
Basically, photoproduction data suggest the value of the parameter , which can then be used, through factorization, to make a prediction for cross-sections. The curve predicted by the Aspen model is the lowest one shown in Fig. 1, and it almost coincides with one obtained by simply scaling the prediction for proton-proton in the Soft Gluon Summation model of Ref. [12]. The two curves will ultimately differ. They coincide here basically because the eikonal function is still small and the integrand can be expanded. That simple factorization of the proton-proton and proton-photon cross-section could give the correct order of magnitude for photon-photon case, has been known since the first such measurements were discussed at electron-positron colliders. Interest in this was recently rekindled, as is shown by one of the curves indicated in Fig. 1, i.e. the one by T.T. Wu and collaborators . The fact that these curves, although starting from very similar hypothesis, differ when the final scaling is applied to photon-photon case, can be ascribed to the fact that in this case all the quantities appear squared and small differences in the fits to proton-proton and proton-photon processes get amplified. All these models, to some extent, consider the photon to be similar to the proton, and use factorization. There is also another popular model, the Regge-Pomeron model, which though different in mathematical formulation, belongs to the same general philosophy. This model describes the initial decrease and the subequent rise as due to the exchange of different sets of graphs, known as Regge and Pomeron graphs. Then the cross-section, whose formulation is based on using analyticity and unitarity is written as
| (7) |
Using a universal set of parameters for Regge and Pomeron trajectories, and factorization at the residues, from proton-proton and photo-production , one can make the prediction for photon-photon shown in Fig. 1. This curve lies higher than most, and in particular than the one of the Aspen model, but rises less than the ones from the minijet model, which will be described next.
The mini-jet model uses actual parton densities in protons and photons to describe the rise of the cross-sections. This model is unitarized through the eikonal formulation of eqs.(1,4) and one can make predictions for photon-photon starting from photo-production. In order to test the role played by the QCD jet cross-section, the EMM uses a very simplified form of the eikonal function, which is approximated by a purely imaginary term, i.e. and , with given by the average number of collisions at an impact parameter . In the Eikonal Minijet Model (EMM), the average number is schematically divided into a soft and a hard component, i.e.
| (8) |
with the soft term parametrized so as to reproduce the low energy behaviour of the cross-section, and
| (9) |
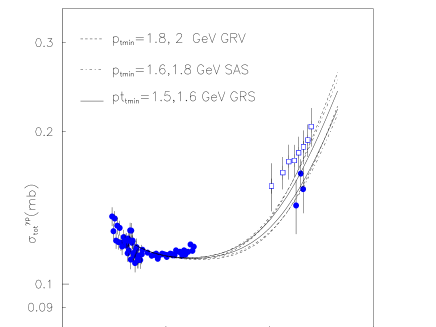
where is obtained by convoluting the electromagnetic form factors of the colliding particles. For the photon, one simple possibility is to use the pion form factor, identifying the photon as just a -pair, for this purpose. Another possibility is to use Fourier transform of the intrinsic transverse momentum distribution (IPT). The jet cross-section depends upon the specific set of parton densities, and, because of the Rutherford singularity, crucially changes according to the lowest cut-off used in the calculation, namely . Presently different sets of photon densities are available and predictions can differ. We show in Fig. 4 the dependence of the predictions of the Eikonal Minijet Model (EMM) on the photonic parton densities for three different available sets viz., GRV , SAS and GRS as well as on the .
The extension to the photon-photon system then proceeds as described in Ref. [18] and the outcome is shown in Fig. 1 as the three curves which rise faster than all the others.
To partly understand the difference in predictions between these different models, one can look at the EMM and Aspen model, which use the same eikonal formulation, are both inspired by QCD in the energy dependence and have similar, albeit not identical, impact parameter description of the collision. The difference between the Aspen model and the EMM is mostly to be ascribed to the use of actual parton densities in the jet cross-section in the latter. Indeed, the Aspen model starts with a successful parametrization of the proton case and moves through factorization to describe photon processes, whereas the EMM describes photon-photon collisions basically by using only the photoproduction and extending the photon properties deduced from photoproduction, namely scaling the soft part using AQM and VMD to the case. Were one to make a straightforward application of the mini-jet model to the proton-proton case, as shown in Ref. [12] and indicated by the curve labelled FF in Fig. 2, the model would not be able to accomodate both the beginning of the rise and the more asymptotic rise at high energy. The origin of this difficulty needs to be clarified. Here we notice that for the photon case the behaviour of the data beyond the 100 GeV range is not yet clear from the data, given the large uncertainties involved and, at present, extrapolation from total cross-section appears not to be too much off the mark for the present experimental results. Some of the uncertainties of the models feed into the MonteCarlo simulation, and it appears that only a dedicated experiment, like possibly at the Linear Collider , can resolve the differences and shed final light on QCD inputs. We show, in the two tables, a compilation of cross-sections at various c.m. energies and what experimental precision would be required in order to distinguish among them. If the difference among the models indicated, has to be more than one standard deviation, then the precision required has to be the one indicated in the last column in each table.
In Table 1 we show total cross-sections for the three models indicated. The last column shows the 1 level precision needed to discriminate between Aspen and T.T. Wu models. The difference between DL and either Aspen or T.T. Wu is bigger than between Aspen and T.T. Wu at each energy value.
| Aspen | T.T. Wu | DL | ||
|---|---|---|---|---|
| 20 | 309 nb | 330 nb | 379 nb | 7% |
| 50 | 330 nb | 368 nb | 430 nb | 11% |
| 100 | 362 nb | 401 nb | 477 nb | 10% |
| 200 | 404 nb | 441 nb | 531 nb | 9% |
| 500 | 474 nb | 515 nb | 612 nb | 8% |
| 700 | 503 nb | 543 nb | 645 nb | 8% |
| BN,GRV | IPT,GRS | IPT,GRV | ||
|---|---|---|---|---|
| (=2 GeV) | (=1.5 GeV) | (=2 GeV) | ||
| 19 | 329 nb | 334 nb | 330 nb | 0.3% |
| 54 | 367 nb | 377 nb | 381 nb | 1% |
| 120 | 454 nb | 473 nb | 513 nb | 4% |
| 204 | 547 nb | 590 nb | 683 nb | 8% |
| 452 | 730 nb | 876 nb | 1098 nb | 18% |
| 767 | 873 nb | 1146 nb | 1477 nb | 27% |
In Table 2 we show total cross-sections for the three different predictions from the EMM model. The label BN refers to an extension of the Soft Gluon Summation model whereas the label IPT refer to the ‘intrinsic transverse momentum’ ansatz used in the EMM model described in Ref. [18]. The various acronyms GRS/GRV indicate the parton densities used. In the last column we show the 1 lebel precision neded at each energy to discriminate between the two closer values for each energy value. We should also add here that this also gives an estimate of the uncertainties in our knowledge of the induced hadronic backgrounds at the LC.
Acknowledgement
We thank Martin Block for many clarifying discussions and Albert De Roeck for useful suggestions.
References
- [1] D.Cline, F.Halzen and J. Luthe, Phys. Rev. Lett. 31, 491 (1973); T.Gaisser and F.Halzen, Phys. Rev. Lett. 54, 1754 (1985).
- [2] R.M. Godbole, Pramana- J. Phys. 51, 217 (1998).
- [3] J. M. Butterworth and R.J. Taylor, hep-ph/9907394.
- [4] ZEUS Collaboration, Phys. Lett. B 293, 465 (1992); Z. Phys. C 63, 391 (1994).
- [5] H1 Collaboration,Z. Phys. C 69, 27 (1995).
- [6] L3 Collaboration, Paper 519 submitted to ICHEP’98, Vancouver, July 1998, M. Acciari et al., Phys. Lett. B 408, 450 (1997).
- [7] L3 Collaboration, M. Acciari et al., Phys. Lett. B 453, 333 (1999).
- [8] OPAL Collaboration , F. Waeckerle, Multiparticle Dynamics 1997, Nucl. Phys. B 71, 381 (1999) Eds. G. Capon, V. Khoze, G. Pancheri and A. Sansoni; Stefan Söldner-Rembold, hep-ex/9810011, Proceedings of the ICHEP’98, Vancouver, July 1998.
- [9] G. Abbiendi et al., hep-ex/9906039, CERN-EP-99-076, Submitted to EPJC.
- [10] M. Block, E. Gregores, F. Halzen and G. Pancheri, Phys. Rev. D 58, 17503 (1998); Phys. Rev. D 60, 054024 (1999).
- [11] M. Block, R. Fletcher, F. Halzen, B. Margolis and P. Valin, Phys. Rev. D 41, 978 (1990)
- [12] A. Grau, G. Pancheri and Y.N.Srivastava, hep-ph/9905228, to appear in Phys. Rev. D.
- [13] S. J. Brodsky, T. Kinoshita and H. Terazawa, Phys. Rev. D 4, 1532 (1971).
- [14] C. Bourelly, J. Soffer and T.T. Wu, hep-ph/9903438, March 22nd, 1999.
- [15] A. Donnachie and P.V. Landshoff, Phys. Lett. B 296, 227 (1992).
- [16] L. Durand and H. Pi, Phys. Rev. Lett. 58, 58 (1987); R. Gandhi, I. Sarcevic, Phys. Rev. D 44, 10 (1991).
- [17] R.S. Fletcher, T.K. Gaisser, F. Halzen, Phys. Lett. B 298, 442 (1993).
- [18] A. Corsetti, R. M. Godbole and G. Pancheri, Phys. Lett. B 435, 441 (1998); R.M. Godbole, A. Grau and G. Pancheri, hep-ph/9908220, to be published in the Proceedings of Photon99, Freiburg, Germany, 23-27 May 1999. Ed. S. Soldner-Remboldt.
- [19] M. Glück, E. Reya and A. Vogt,Phys. Rev. D 46, 197 (1992).
- [20] G. Schuler and T. Sjöstrand, ZPC 68, 607 (1995); PLB 376, 193 (1996).
- [21] M. Glück, E. Reya and I. Schienbein, hep-ph/9903337.
- [22] E. Accomando et al.,Phys. Reports 299 1 (1998).