MADPH-99-1145 Fermilab-PUB 99-341-T AMES-HET 99-12 hep-ph/9911524 November 1999
Long-Baseline Study of the Leading Neutrino Oscillation
at a Neutrino Factory
V. Barger1, S. Geer2, R. Raja2, and K. Whisnant3
1Department of Physics, University of Wisconsin,
Madison, WI 53706, USA
2Fermi National Accelerator Laboratory, P.O. Box 500,
Batavia, IL 60510, USA
3Department of Physics and Astronomy, Iowa State University,
Ames, IA 50011, USA
Abstract
Within the framework of three-flavor neutrino oscillations, we consider the physics potential of appearance and survival measurements at a neutrino factory for a leading oscillation scale eV2. Event rates are evaluated versus baseline and stored muon energy, and optimal values discussed. Over a sizeable region of oscillation parameter space, matter effects would enable the sign of to be determined from a comparison of with event rates and energy distributions. It is important, therefore, that both positive and negative muons can be stored in the ring. Measurements of the survival spectrum could determine the magnitude of and the leading oscillation amplitude with a precision of (1%–2%).
I Introduction
The SuperKamiokande (SuperK) collaboration[1] has published evidence that muon neutrinos, produced in the earth’s atmosphere by cosmic rays, oscillate into other neutrino flavors. The survival probability in vacuum for neutrinos of energy (GeV) traversing a distance (km) is given by:
| (1) |
The SuperK results for the oscillation amplitude and the oscillation scale are in accord with results obtained from other experiments[2]. From the zenith angle distribution of the muon events, which is related to the distribution in , the mass-squared difference scale of the oscillations was inferred to be[1, 3]
| (2) |
and the amplitude of the oscillations was found to be maximal or nearly maximal,
| (3) |
No zenith angle dependence was observed by SuperK for electron events, so it is concluded that electron-neutrinos do not undergo appreciable oscillations at the scale of Eq. (2) and that the muon-neutrinos oscillate dominantly to some neutrino flavor other than electron-neutrinos. This interpretation is consistent with the stringent lower limits on the electron-neutrino survival probability from the CHOOZ reactor neutrino experiment[4]. Thus it is inferred that atmospheric muon-neutrinos oscillate to tau-neutrinos or to a new sterile neutrino species that has no Standard Model interactions. In the latter case, matter effects would be expected to distort the zenith angle distributions at large zenith angles. The SuperK data presently disfavor muon-neutrino oscillations to sterile neutrinos by two standard deviations[1].
For given by Eq. (2), the first minimum in the survival probability occurs at
| (4) |
The detector averaged measurement by SuperK does not resolve this minimum because of the smearing over and inferred values. Accelerator-based experiments are thus essential to establish the existence of the minimum in the survival probability. The K2K[5] experiment from KEK to SuperK, already underway, has km and average neutrino energy GeV, with an range of 125–250 km/GeV. The MINOS[6] experiment from Fermilab to Soudan has a baseline km and 3 beam options with , 6 and 12 GeV, giving –250 km/GeV. Other experiments from CERN to detectors in Gran Sasso with a baseline km are in the final design stages. The energy dependence of the charged-current rate, the neutral-current rate, and -appearance with higher energy beams will test the neutrino oscillation hypothesis. The value of will be measured in these long-baseline experiments to higher precision than possible with atmospheric neutrinos. For example, MINOS may ultimately be able [7] to make a 10% determination of .
Thus the next generation of accelerator long-baseline neutrino experiments are expected to firmly establish neutrino oscillations and improve our knowledge of . However, the dominant flux components in these accelerator experiments are and . To make further progress in determining all of the parameters describing the oscillations it is desirable to also have and beams, in addition to beams of higher intensity. With this in mind, it has been pointed out [8, 9] that if an intense muon source of the type being developed for a possible future muon collider [10] is used together with a muon storage ring having long straight sections, the resulting “neutrino factory” would produce intense beams containing () as well as (). In the original neutrino factory proposal [9] it was shown that if the storage ring was tilted down at a large angle, the neutrino beams would be sufficiently intense to produce thousands of interactions in a reasonable sized detector on the other side of the Earth. Neutrino factories have caught the attention of the community, and several groups are developing the concept with BNL, CERN, FNAL, and KEK all being considered as possible sites [11, 12, 13].
In Ref. [14] we explored long-baseline neutrino physics at a neutrino factory within the framework of two-flavor oscillations. In the present paper we extend our analysis of the physics potential at neutrino factories, presenting results within the framework of three-flavor oscillations. In particular we discuss: (i) the precise determination of () from the measured survival probability; (ii) a proof that the sign of can in principle be extracted from and appearance measurements by exploiting matter effects that modify these oscillation probabilities; and (iii) the optimal and methodology for the measurements. Table I summarizes the baselines, average electron density in the earth, and the dip angle for various possibilities. Our present analysis focuses on long-baseline experiments with km (Fermilab Soudan), km and 2900 km (Note: Fermilab SLAC 2900 km, Fermilab Seattle, Washington 2700 km), and km (Fermilab Gran Sasso).
II Leading Neutrino Oscillation
There are experimental indications of neutrino oscillation effects from the LSND accelerator experiment[15], from the atmospheric neutrino anomaly[1, 2, 16], and from the solar neutrino deficit[17, 18]. Three neutrino mass-squared differences are required to completely explain all these phenomena. However, three neutrinos provide only two distinct scales. Therefore, a sterile neutrino must be invoked if all the experimental indications are real. Since the significance of the LSND effect is not at the discovery level, a common approach is to set this anomaly aside until it is confirmed or rejected by the forthcoming Fermilab Mini-BooNE experiment[19] and analyze the solar and atmospheric neutrino deficits within the framework of three-neutrino oscillations. This is the route followed in the present analysis. Thus we take the atmospheric sale to be the leading oscillation.
With three neutrinos, the flavor eigenstates are related to the mass eigenstates in vacuum by
| (5) |
where is the unitary Maki-Nakagawa-Sakata (MNS) mixing matrix[20]. We parametrize by
| (6) |
where and . For Majorana neutrinos, contains two further multiplicative phase factors that modify diagonal entries of , but these do not enter in oscillation phenomena.
The importance of forward scattering of neutrinos on electrons in the propagation of neutrinos through matter was first pointed out in Ref. [21]. The existence of resonance effects in propagation of neutrinos through the earth in a constant density approximation was then discovered in Ref. [22]. Corrections to the magnitude and sign of the coherent amplitude given by Ref. [21] were made in Refs. [22, 23]. The effects of matter are prominent in neutrino oscillation solutions[24] to the solar neutrino anomaly[17, 18]. Early calculations for long-baseline experiments were presented in Ref. [25]. Many long-baseline analytical and numerical studies have subsequently been made that include various refinements [26, 27, 28, 29, 30, 31, 32].
The propagation of three neutrinos through matter is described by the evolution equation
| (7) |
where and is the amplitude for coherent forward charged-current scattering of on electrons,
| (8) |
Here is the electron fraction and is the matter density. For neutrino trajectories that pass through the earth’s crust, the average density is typically of order 3 gm/cm3 and . The propagation Eq. (7) can be re-expressed in terms of mass-squared differences as
| (9) |
This evolution equation can be solved numerically for given input values of the and mixing matrix elements.
In our analysis we obtain numerical solutions of Eq. (9) for three-neutrino oscillations taking into account the dependence of the density on depth using the Preliminary Reference Earth Model [33]. However, it is instructive to first consider an approximate analytic solution[30] based on the hierarchy
| (10) |
implied by oscillation solutions to the atmospheric and solar neutrino anomalies. Then, for short enough distances, the term in Eq. (9) can be dropped and the other two set equal,
| (11) |
The evolution equations are then
| (12) |
The propagation matrix has eigenvalues
| (13) |
where
| (14) |
For propagation through matter of constant density, the flavor eigenstates are related to the mass eigenstates by
| (15) |
where
| (16) |
and is related to by
| (17) |
We note that has the form of the vacuum with the substitutions
| (18) |
There are only two mixing angles because the oscillations associated with the solar scale () have not yet developed. The effective phase angle vanishes, so CP violation is not possible in the leading oscillation, even after matter effects are included[34]. Equation (17) implies that
| (19) |
Thus there is a resonant enhancement for
| (20) |
or equivalently
| (21) |
The resonance occurs only for positive . For negative the oscillation amplitude in (19) is smaller than the vacuum oscillation amplitude. Thus the matter effects give us a way in principle to determine the sign of .
For a constant Earth density profile, the transition probabilities for a given neutrino flavor are given by
| (22) |
where
| (23) |
and the are the eigenvalues of the neutrino matrix in Eq. (13). The transition probabilities in the leading oscillation approximation are
| (24) | |||||
| (25) | |||||
| (26) |
Here the oscillation arguments are
| (27) |
where is given by Eq. (14) and
| (28) |
The term in must be retained here because it is not necessarily negligible compared to , due to matter effects. From Eqs. (19), (25) and (27), we see in the limit that and the transition probabilities vanish. We see from Eq. (25) that matter effects are possible for oscillations in a three neutrino model. However, these matter effects disappear in the limit, where
| (29) |
and
| (30) |
To have substantial event rates from oscillations requires high energy neutrino beams because of the kinematic suppression of the production cross section near threshold. The and oscillation probabilities can be studied with either low or high energy beams and we focus our attention on them in the rest of this paper. A non-zero value of is essential for the occurrence of these oscillations and for the observation of matter effects.
III Neutrino Fluxes and Cross-Sections
The distribution of neutrinos from the decays of an ensemble of polarized negatively-charged muons in the muon rest frame is given by
| (31) | |||||
| (32) |
where , is the angle between the neutrino momentum vector and the muon spin direction and is the average muon polarization along the beam direction. The corresponding distributions for and from are obtained by the replacement in Eqs. (31) and (32). Only neutrinos emitted in the extreme forward direction () are relevant to the neutrino flux for long-baseline experiments; in this limit
| (33) |
in the lab frame. The flux at a distance from the storage ring can be approximated by
| (34) |
where and is the number of neutrinos (or antineutrinos) in a given beam. The charged-current (CC) interaction cross-sections in the detector grow approximately linearly with the neutrino energy
| (35) | |||||
| (36) |
Thus, the event rates in the absence of oscillations are
| (37) |
The () event energies peak at the stored () energy while the () energies peak at about 3/4 of the stored () energy. The lepton spectra from the charged-current interactions can be obtained by folding the event rates with the distributions, where .
For no oscillations, the average observed neutrino energies would be
| (38) | |||||
| (39) |
Thus, from Eq. (4), the first maximum in the leading oscillation occurs for
| (40) |
For maximal oscillation effects the baseline and stored energy should be chosen to satisfy Eq. (40). In order to have sufficient event rates at km distances, the lowest practical muon energy is about 10 GeV. The corresponding from Eq. (40) is close to the 2900 km baseline from Fermilab to SLAC.
IV Oscillation Channels
The decays of stored muons along the straight sections of the storage ring give well-collimated neutrino beams of specified flavor composition. For stored , the decays give and beams with the known energy distributions given by Eq. (31) (see Fig. 4 of [14]). In this paper we restrict our attention to detection of muons. The relevant oscillation signatures for stored are given in Table II. Corresponding signatures for stored are obtained by the interchange and changing the signs of the electric charges of the leptons.
The oscillations to feed the same final state as oscillations to through the decays of the produced -leptons. Thus detection of muons determines linear combinations of oscillation probabilities
| (41) | |||||
| (42) |
where is the flux and denotes a spectrum average and integration over final state energies. Neglecting the small matter effects in , the leading oscillation rates from Eqs. (25) and (30) would be
| (44) | |||||
| (46) | |||||
The -contributions will be suppressed at low stored muon energies ( GeV) by the kinematic suppression of the tau cross section near the threshold for tau production. The tau neutrino interactions can be identified by (i) kinematics ( relative to the neutrino beam direction and the -distribution of the decay muon), or (ii) direct evidence for -prong or -prong decays by detecting kinks or displaced vertices in, for example, emulsion detectors, or by imaging Cherenkov rings that the tau generates in C6 F14 liquid [35]. Henceforth we concentrate our analysis strictly on primary muons from under the assumption that the contributions of muons from tau decay can be resolved.
V Predicted Neutrino Oscillation Event Rates
For a quantitative analysis of neutrino oscillation event rates in long-baseline experiments, we begin with the following set of oscillation parameters:
| (47) | |||||
| (48) | |||||
| (49) | |||||
| (50) | |||||
| (51) | |||||
| (52) |
The values of and govern the atmospheric neutrino oscillations. The values of and control the solar neutrino oscillations. We select the large-angle matter solution[36] because it is the most optimistic choice for obtaining any effects in long-baseline experiments from the subleading scale. The value of determines the size of the matter effects for the leading oscillations. The value of is determined from and by the sum rule
| (53) |
The subleading oscillation effects associated with the in Eq. (50) are usually small in comparison with the leading oscillation, so either of the other two solar solution possibilities (small angle matter or large-angle vacuum oscillations) would lead to results similar to the representative case above; we will remark below when the subleading oscillation effects are appreciable. The long-baseline oscillations are controlled by the three parameters and . The matter effects in the leading oscillation are critically dependent on .
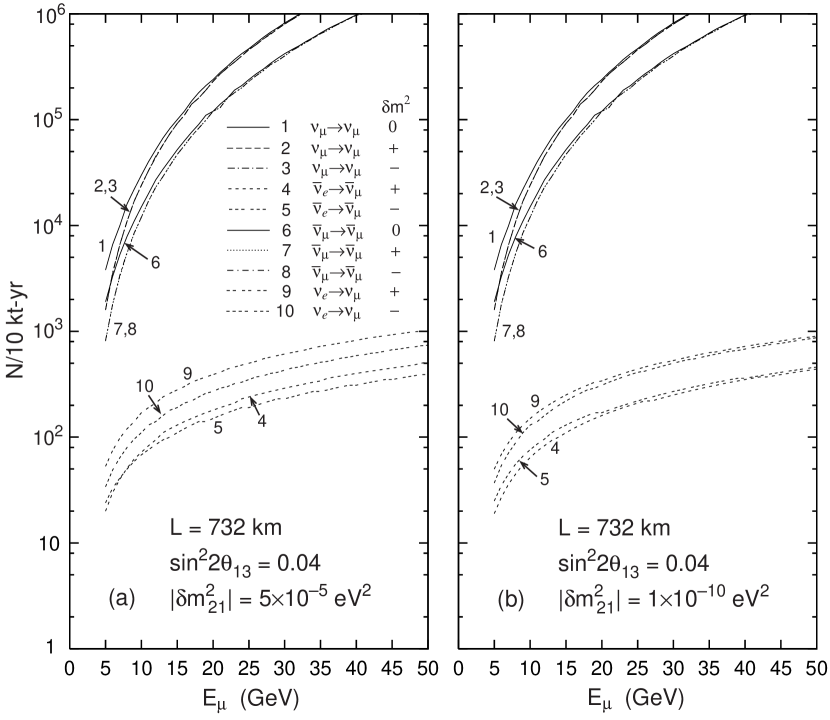
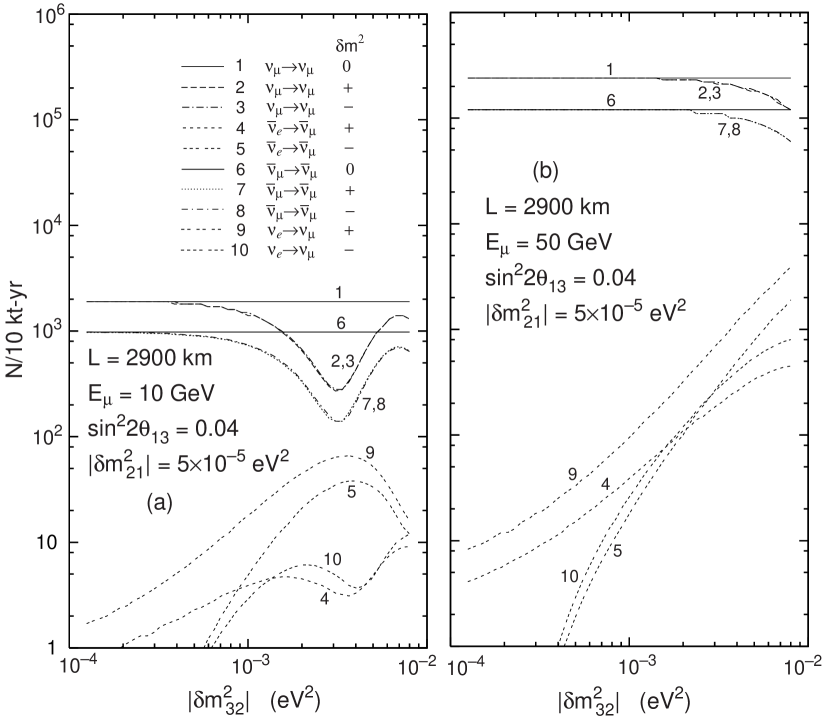
We calculate neutrino event rates, with and without oscillations, for a neutrino factory with stored muons/year and a 10 kiloton detector. For the neutrino flux, energy distributions and cross sections we use Eqs. (31)–(36). The oscillation probabilities are calculated by integrating Eq. (7) numerically from the source to the detector using a Runge–Kutta method, and averaging over the neutrino energy distribution. For the Earth’s density we use the results of the Preliminary Reference Earth Model [33]. In these initial exploratory results we neglect the stored muon beam momentum-spread and angular-divergence, which we later incorporate in Sec. VI. Fig. 1a shows the event rates at km versus stored muon (or antimuon) energy for the oscillation parameters in Eq. (50). We show in Fig. 1b the corresponding event rates with eV2 for the subleading oscillation scale, i.e., appropriate for vacuum long-wavelength solar oscillations. We note the following:
-
(i)
For the appearance channels and , the main difference in rates comes from the difference in the neutrino and antineutrino cross sections. Matter effects, which arise when the sign of is changed, are seen to be relatively small in Fig. 1b. This is to be expected since the characteristic wavelength for matter effects at these energies is of order the Earth’s diameter, which is much larger than 732 km.
-
(ii)
The effects of the subleading mass scale, , are evident by comparing the appearance channels in Fig. 1a to those in Fig. 1b. For the large-angle MSW solution, eV2, the interplay of the subleading scale with matter and the sign of affects the rates at the 20% level. We have found that this effect increases as , when the subleading leading oscillation, with its larger oscillation amplitude, can begin to compete with the leading oscillation, which has a small amplitude in this limit[37].
-
(iii)
At lower muon energies (10 GeV or less) the survival probabilities for the and channels decrease with decreasing energy, but do not reach their minimum values, on average, for GeV.
-
(iv)
The survival rates do not depend appreciably on the sign of , which means that matter effects are small in these channels at this distance, as is the case for the appearance channels.
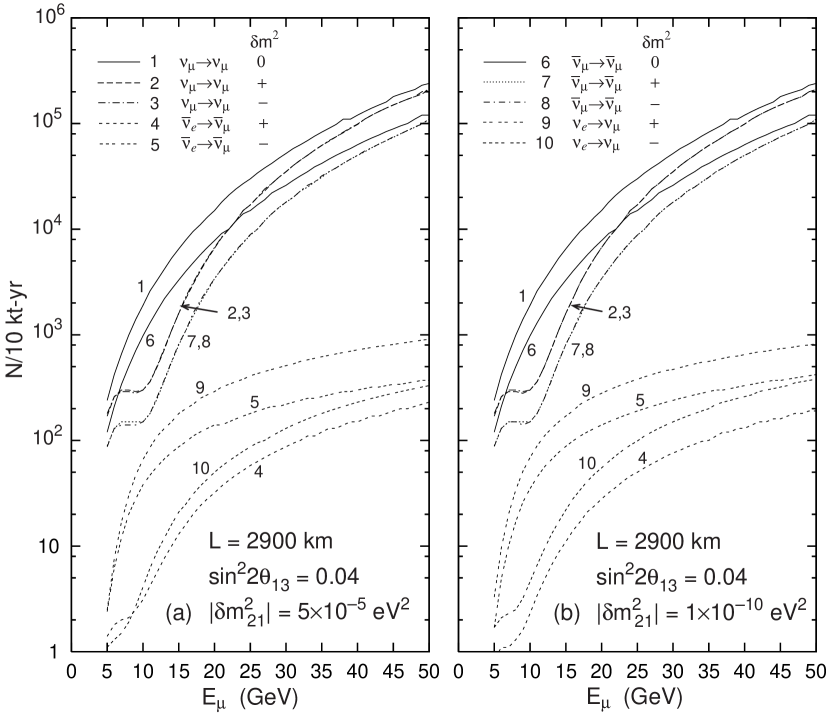
In Fig. 2 we show similar results for km, from which we conclude:
-
(i)
The largest event rate suppression in the survival channels occurs at energies GeV.
- (ii)
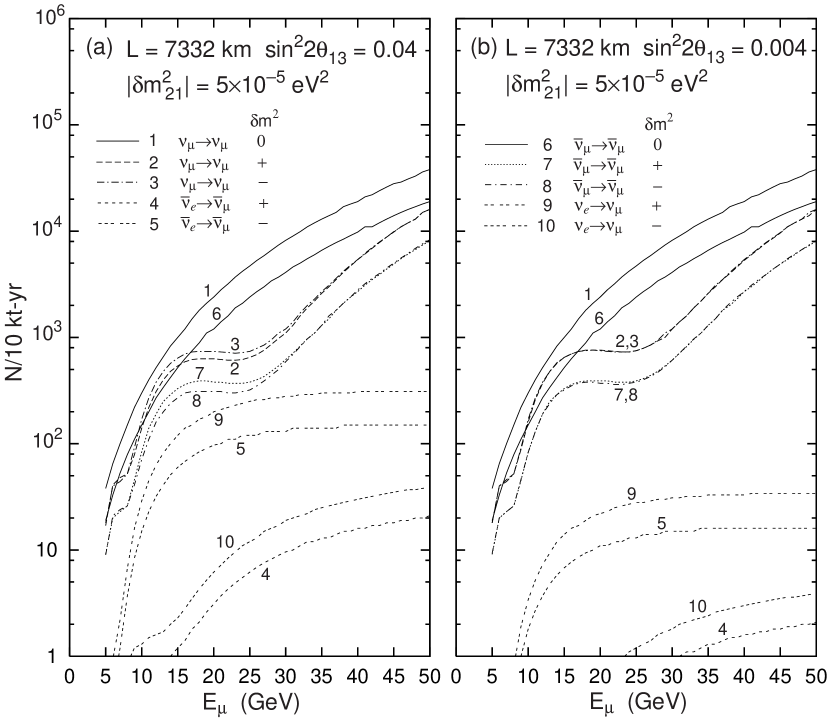
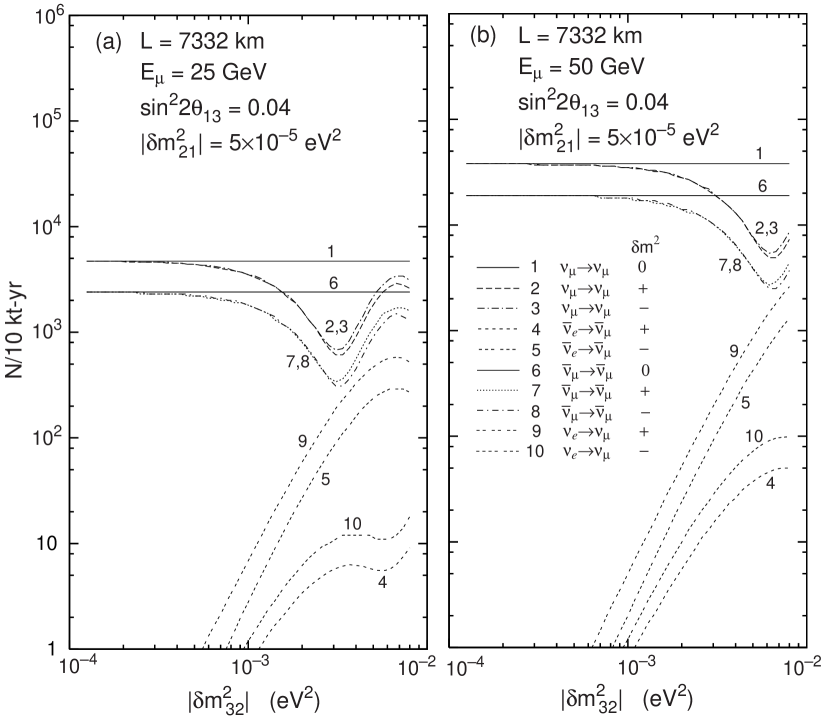
In Fig. 3 we show similar results for km, from which we conclude:
-
(i)
Matter effects have now grown quite large, as evidenced by the large variation in the appearance event rates in Fig. 3a when the sign of is changed. We have found that the results using the large-angle MSW and vacuum solar scales for the subleading oscillations are nearly identical at this distance.
-
(ii)
A minimum in the survival probability is clearly visible near GeV. Also, the survival rates are now sensitive to the sign of for GeV, indicating matter effects. Unfortunately, the number of events in one of the appearance channels (either or , depending on the sign of ) falls below 10 for these energies, even for . In general, the event rates at km are below those at km due to a lower flux.
- (iii)
-
(iv)
The number of events in the appearance channels is sufficiently large to allow a determination of the sign of , at least for the km and 7332 km distances.
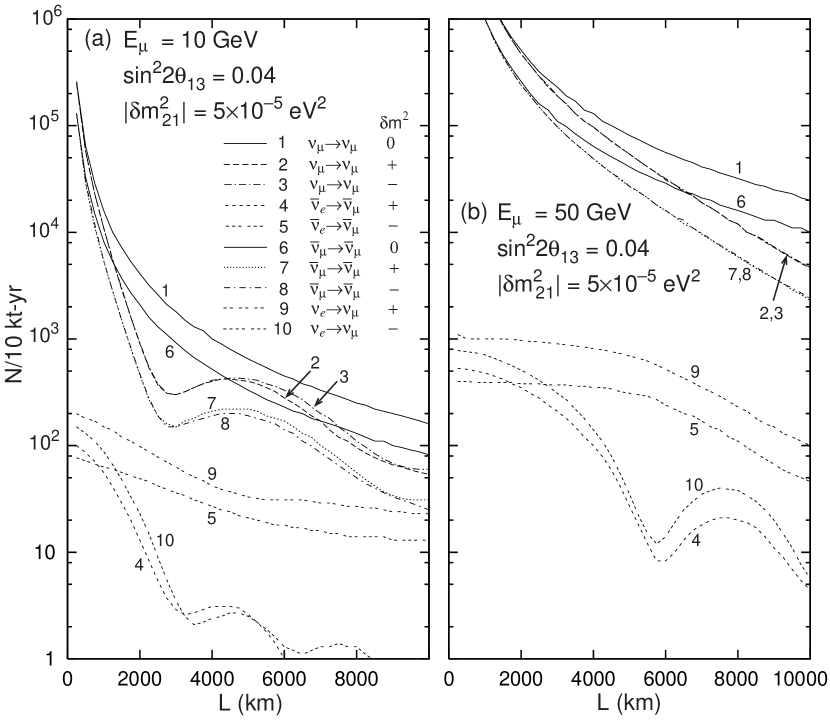
Next we show in Fig. 4a the dependence of the oscillations at a fixed muon energy of 10 GeV. Here we see that km is the first minimum in the survival probability and that km corresponds to a maximum in the survival probability; matter effects are sizable for km. In the appearance channels, matter effects turn on as increases, causing one of the appearance channels to be highly suppressed.
Similar results for GeV are shown in Fig. 4b. We see that the appearance event rates scale roughly with , as expected from the product of the behavior of the unoscillated rates (Eq. (37)) and the dependence of the oscillatory factor for small oscillation arguments (Eqs. 25–28). The dependence is relatively flat at low for the channel that is not suppressed by matter, as expected from the product of the behavior of the flux and the dependence of the oscillatory factor. The survival rates are much higher for GeV than for GeV, but they do not reach a minimum for km.
Figures 1–4 assume eV2, the favored value from atmospheric measurements from SuperK. Long-baseline experiments should be able to determine with high precision if the event rates associated with oscillations are appreciable. Figure 5 shows the sensitivity of the event rates to changes in for km and or GeV. At GeV the survival probability has a minimum near eV2, but the appearance rates are modest. At GeV the appearance rates are much higher, but the survival probability has a minimum only for higher . Therefore we see that at km, if is close to the value favored by SuperK, there is a trade-off between choosing a relatively low to optimize the survival probability measurements, or choosing a higher energy to optimize the appearance signal.
Figure 6 shows similar curves for km with and 50 GeV. At GeV the survival probability has a minimum near eV2, with appreciable appearance rates for nearby values of , and matter effects are evident for eV2. At GeV, the appearance rates are higher than for 25 GeV (especially in the matter-suppressed channel) and the disappearance probability is appreciable over a range of . However, matter effects in the survival probability are noticeable only for eV2.
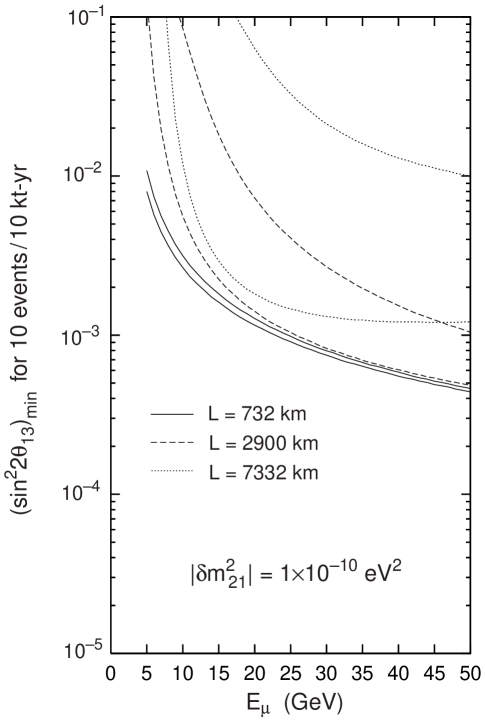
Figure 7 shows the minimum value of that gives 10 appearance events versus for , 2900, and 7332 km, when eV2 (the solar vacuum oscillation value). The lower (upper) curves are for matter-enhanced (matter-suppressed) oscillations with (); the corresponding curves for appearance can be empirically obtained by changing the sign of and multiplying by 2. We see that increased improves the ability to discover appearance channels, although there are limiting returns for going to very high . The sensitivity to the matter-suppressed channel is especially weak at longer distances (e.g. km in this case). The corresponding curves for the large-angle MSW solar solution (e.g. eV2) are much different for km, and somewhat different at km, due to contamination by the subleading oscillation, as expected from the discussion of Figs. 1 and 2. If large-angle solar oscillations are the correct solution to the solar anomaly, then km has the merit that the subleading oscillation does not affect the interpretation of appearance, as it does at and 2900 km.
As discussed in Sec. II, the leading oscillation approximation leads to a simple expressions for the oscillation argument of the probability (see Eqs. (27) and (29)). Then the appearance event rate can be approximated by
| (54) | |||||
| (55) |
where the angle brackets denote averages over neutrino energy, and . The average probability can be estimated by evaluating the probability at in the small limit,
| (56) |
where is given by Eq. (8) evaluated at . Equation (54) gives reasonably accurate results whenever is below 0.01 provided that contributions to the subleading oscillation are not important. Approximate antineutrino rates can be obtained by the substitution in Eq. (56) and by dividing the results of Eq. (54) by 2.
VI More Detailed Simulations
To obtain a more realistic calculation of the event rates at a neutrino factory we have simulated a neutrino beam formed by muons decaying along a 1 km long straight-section. In our simulations the muon beam has a momentum spread given by , and horizontal and vertical beam divergences given by where . The finite beam momentum spread and angular divergence modify the event rates at a distant site by a few percent. We have also included in our simulations a parametrization of the detector resolution functions for an iron-scintillator neutrino detector [6, 7]. We assume that muon energies can be measured by range with a precision given by . Shower energies are assumed to be measured with precisions given by if GeV and if GeV with, in both cases, a constant term of 0.07 added in quadrature.
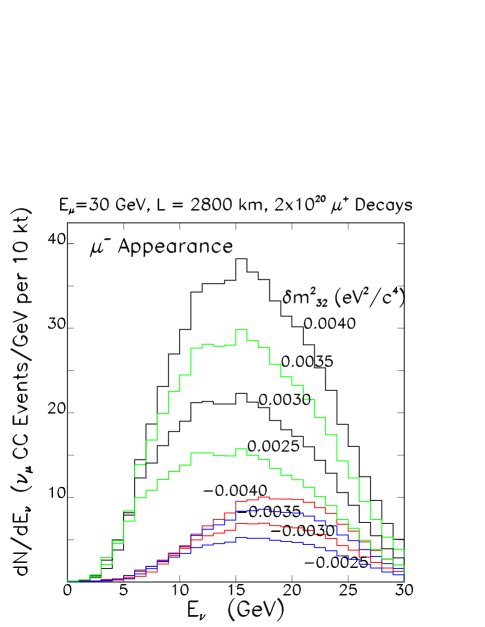
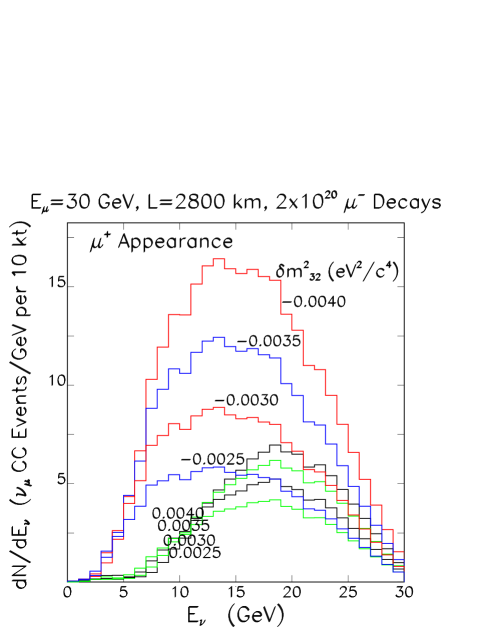
For each of the relevant oscillation channels, the predicted annual CC event samples (from muon decays) corresponding to the oscillation parameters of Eq. (50) are shown in Table III for both signs of . The tabulated rates are for a 10 kt detector at baselines of km, 2800 km, and 7332 km, with 10, 30 and 50 GeV. The statistical uncertainties on the calculated event rates from the Monte Carlo simulations are about 2.5%. Consider first the sensitivity of the oscillation signals to matter effects, and hence to the sign of . Note that most of the event rates are insensitive to matter effects. However, the CC rates are significantly modified by matter, and hence a measurement of events with wrong-sign muons can in principle determine the sign of . To illustrate this, consider the CC rates when L = 2800 km and GeV (30 GeV). If is positive, 894 (486) wrong-sign muon events are expected in a 10 kt-yr data sample. However, if is negative, the corresponding rates are 338 (130) events. Hence, if all the oscillation parameters are known except the sign of , the event rates can be used to determine the sign. The statistical significance of this sign determination improves slowly with increasing . In practice, the oscillation parameters will not be precisely known. However, the sign of can still be uniquely determined from the wrong-sign muon measurements if both rates (positive stored muons) and rates (negative stored muons) are determined. For the examples we are considering, if is positive the rates will be larger than the rates by a factor of a few. In contrast, if is negative the rates will be comparable to, or smaller than, the rates. There is additional information in the spectrum of CC events producing wrong-sign muons. The predicted measured energy distributions (including detector resolutions), for CC events containing wrong-sign muons are shown as a function of both the magnitude and sign of in Figs. 8 and 9 when, respectively, 30 GeV positive and negative muons are stored in the ring, and km. Both the shapes and normalizations of the distributions are sensitive to the sign and magnitude of . In particular if is negative (positive) the appearance events from oscillations will peak at higher (lower) energies than the appearance events from oscillations. We conclude that if both positive and negative muons can be stored at different times in the neutrino factory, then wrong-sign muon appearance measurements can distinguish the sign of and determine its magnitude.
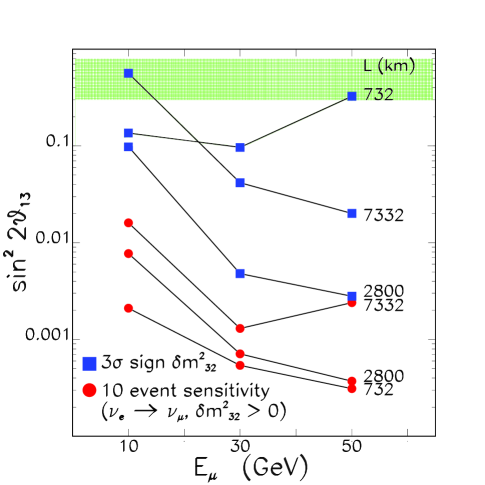
We next consider a less favorable region of parameter space in which the oscillation amplitude is reduced by a large factor. Table IV presents the event rates when is reduced by an order of magnitude ( or ) with the other oscillation parameters as in Eq. (50). Returning to our example ( km, GeV) we note that if is positive (negative) we expect 108 (25) wrong-sign CC events per 10 kt-yr when positive muons are stored, and 29 (30) events when negative muons are stored. Hence, in this case we are still above, but close to, the threshold below which a statistically significant determination of the sign of will only be possible with larger data samples. Based on Tables III and IV we can estimate the minimum values of (when all of the other parameters are as specified in Eq. (50)) for which (i) we expect a measurable wrong-sign muon signal (10 event sensitivity), and (ii) from the measured ratio of wrong-sign muon rates obtained when positive and negative muons are alternately stored we can determine the sign of (at 3 standard deviations). Figure 10 summarizes our estimates for these minimum versus and . Note that to measure a wrong-sign muon signal over the largest range, high and “short” are preferred. However, if is too short the unoscillated CC event rates get very large, and hence backgrounds become significant. If the background rates are at the level of – of the total CC rates [38], then km is probably preferred over 732 km. To be able to determine the sign of over the largest range, high is once again preferred. Since matter effects become small for short and event statistics become small for very large , there appears to be an optimal for determining the sign of . Of the 3 baselines we have considered, km is preferred. From these considerations we would conclude that for wrong-sign muon measurements km is a good choice for the baseline, and high energy stored muons ( GeV) are preferred, although we note that decreasing from 50 GeV to 30 GeV decreases the sensitive range by less than a factor of two.
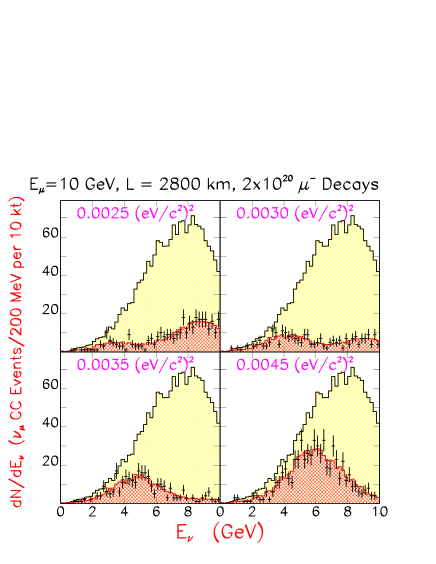
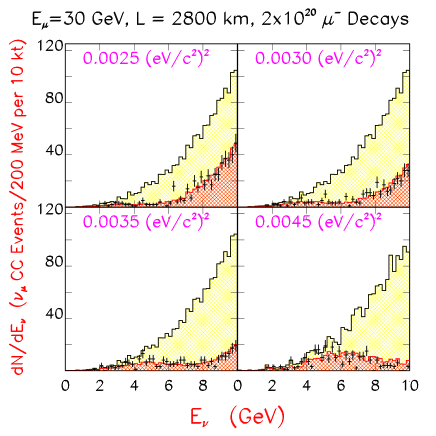
We next turn our attention to muon survival measurements. The rates shown in Table III are significantly less than the corresponding rates in the absence of oscillations. As an example, consider km with GeV and 30 GeV. The predicted measured energy distributions (including detector resolutions) for interacting muon neutrinos are shown for the two energies in Figs. 11 and 12 respectively versus with the other oscillation parameters given by Eq. (50). The shapes and normalizations for the predicted distributions are very different from the expected distribution that would be observed in the absence of oscillations. The shapes of the predicted CC interaction distributions are sensitive to the magnitude of . The dip in the predicted rate that corresponds to the first oscillation maximum (when ) can be clearly seen. At the higher the contribution from poorly measured higher energy CC interactions reduces the significance of the dip. To understand the statistical precision with which and can be extracted from a fit to the measured CC interaction distribution, we have generated Monte Carlo data sets with the appropriate statistics for various values of the oscillation parameters, and fit the resulting simulated distributions. As an example, Figs. 13 and 14 show fit results for GeV with km and GeV with km. The precision of the fits for various and are summarized in Table V for and . In order to extract the fitted information, we have had to limit the fits to energy ranges where the information is maximally available. It can be seen from Table V that the parameters are ill constrained for the shorter baseline of 732 km. For the 10 GeV ring, km and for the 30 or 50 GeV ring km seem to be the optimal baseline lengths for maximum precision in sin and .
VII Conclusions
Within the framework of three-flavor oscillations, we have explored the sensitivity of muon appearance and muon disappearance measurements at a neutrino factory in which there are muon decays per year in a beam-forming straight section that points at a 10 kt detector. Three stored muon energies (10, 30, and 50 GeV) and three baselines (732, 2800, and 7332 km) have been explicitly considered. Our results are summarized in Table VI.
If data can be taken alternately with positive and negative muons stored in the ring, a measurement of the wrong-sign muon appearance rates and spectra can uniquely determine the sign of provided the oscillation amplitude is sufficiently large (sin for km and GeV). To demonstrate this, we have considered determining the sign of by measuring the ratio of wrong-sign muon rates when alternately positive and negative muons are stored. Of the three baselines we have considered, km is preferred for this measurement since km is too short (matter effects too small) and km is too long (statistics too limited) to obtain good sensitivity to the sign of . We note that a global fit to both wrong-sign muon event rates and energy distributions with (including its sign) left as a free parameter would improve the sensitivity to the sign of , and may result in a different preferred baseline choice [39]. The sensitivity to wrong-sign muon appearance, characterized by the minimum sin for which a signal can be detected at the 10 events per year level, improves linearly with . For km and GeV the minimum sin. This can be improved to sin by either increasing to 50 GeV, or by increasing the detector mass by a factor of 1.8.
The sensitivity for the survival measurements can be optimized by choosing and so that is close to the first minimum in the survival probability. For km this corresponds to GeV. For eVc4 and sin the statistical precision of the resulting and sin measurements based on fitting the observed spectra are respectively 2.4% and 1.1%. However, optimization for the appearance channels suggests choosing a higher . For example, choosing GeV the precisions for the and sin measurements become 3.2% and 2.0%. With these levels of statistical precision, systematic effects (for example, the uncertainty on the neutrino flux) may dominate. For the region of three-flavor-mixing parameter space that we have explored, we conclude that km with GeV would enable the very precise determination of and from muon survival, the determination of from muon appearance, and the sign of from matter effects (e.g., by comparing with ).
The above analysis assumes that is conserved, i.e., . violation may be important whenever the effects of the subleading mass scale are appreciable, e.g., at short and intermediate distances [40]. A detailed analysis of the -violating case will be given elsewhere [39].
Finally, we note that if no appearance signal were observed, the implied very low value of sin might provide a window of opportunity for detecting oscillations driven by the smaller (solar neutrino deficit) scale , should it be the large-angle MSW solution. This requires further study.
Acknowledgements.
We thank S. Parke for discussions. This research was supported in part by the U.S. Department of Energy under Grants No. DE-FG02-94ER40817 and No. DE-FG02-95ER40896 and in part by the University of Wisconsin Research Committee with funds granted by the Wisconsin Alumni Research Foundation. Part of this work was performed at the Fermi National Accelerator Laboratory, which is operated by the Universities Research Association, under contract No. DE-AC02-76CH03000 with the U.S. Department of Energy.REFERENCES
- [1] Super-Kamiokande Collaboration, Y. Fukuda et al., Phys. Lett. B433, 9 (1998); Phys. Lett. B436, 33 (1998); Phys. Rev. Lett. 81, 1562 (1998); Phys. Rev. Lett. 82, 2644 (1999).
- [2] Kamiokande collaboration, K.S. Hirata et al., Phys. Lett. B280, 146 (1992); Y. Fukuda et al., Phys. Lett. B335, 237 (1994); IMB collaboration, R. Becker-Szendy et al., Nucl. Phys. Proc. Suppl. 38B, 331 (1995); Soudan-2 collaboration, W.W.M. Allison et al., Phys. Lett. B391, 491 (1997); MACRO collaboration, M. Ambrosio et al., Phys. Lett. B434, 451 (1998).
- [3] M.C. Gonzalez-Garcia, hep-ph/9910494; G.L. Fogli, E. Lisi, A. Marrone, and G. Scioscia, Phys. Rev. D59, 033001 (1999); V. Barger, T.J. Weiler and K. Whisnant, Phys. Lett. B440, 1 (1998); M.C. Gonzalez-Garcia, H. Nunokawa, O.L. Peres, and J.W.F. Valle, Nucl. Phys. B543, 3 (1998).
- [4] CHOOZ Collaboration, M. Apollonio et al., Phys. Lett. B420, 320 (1998).
- [5] K. Nishikawa et al. (KEK-PS E362 Collab.), “Proposal for a Long Baseline Neutrino Oscillation Experiment, using KEK-PS and Super-Kamiokande”, 1995, unpublished; INS-924, April 1992, submitted to J. Phys. Soc. Jap.; Y. Oyama, Proc. of the YITP Workshop on Flavor Physics, Kyoto, Japan, 1998, hep-ex/9803014.
- [6] MINOS Collaboration, “Neutrino Oscillation Physics at Fermilab: The NuMI-MINOS Project,” NuMI-L-375, May 1998.
- [7] D. A. Petyt,“A study of parameter measurement in a long-baseline neutrino oscillation experiment”, Thesis submitted to Univ. of Oxford, England, 1998.
- [8] S. Geer, “Neutrino beams from muon storage rings: characteristics and physics potential”, FERMILAB-PUB-97-389, 1997, presented at the Workshop on Physics at the First Muon Collider and Front-End of a Muon Collider, November, 1997.
- [9] S. Geer, Phys. Rev. D57, 6989 (1998).
- [10] C. Ankenbrandt et al. (Muon Collider Collaboration), Phys. Rev. ST Accel. Beams 2, 081001 (1999).
- [11] A. De Rujula, M.B. Gavela, and P. Hernandez, Nucl. Phys. B547, 21 (1999).
- [12] M. Campanelli, A. Bueno, and A. Rubbia, hep-ph/9905240.
-
[13]
R.B. Palmer et al. (Muon Collider Collababoration),
http://pubweb/bnl.gov/people/palmer/nu/params.ps - [14] V. Barger, S. Geer, and K. Whisnant, hep-ph/9906487, to be published in Phys. Rev. D.
- [15] C. Athanassopoulos et al. (LSND Collab.), Phys. Rev. Lett. 77, 3082 (1996); Phys. Rev. Lett. 81, 1774 (1998).
- [16] V. Barger and K. Whisnant, Phys. Lett. 209B, 365 (1988); J.G. Learned, S. Pakvasa, and T.J. Weiler, ibid. 207B, 79 (1988); K. Hidaka, M. Honda, and S. Midorikawa, Phys. Rev. Lett. 61, 1537 (1988).
- [17] B.T. Cleveland et al., Nucl. Phys. B (Proc. Suppl.) 38, 47 (1995); GALLEX collaboration, W. Hampel et al., Phys. Lett. B388, 384 (1996); SAGE collaboration, J.N. Abdurashitov et al., Phys. Rev. Lett. 77, 4708 (1996); Kamiokande collaboration, Y. Fukuda et al., Phys. Rev. Lett, 77, 1683 (1996); Super-Kamiokande collaboration, Y. Fukuda et al., Phys. Rev. Lett. 82, 2430 (1999); Phys. Rev. Lett. 82, 1810 (1999).
- [18] J.N. Bahcall, S. Basu, and M.H. Pinsonneault, Phys. Lett. B 433, 1 (1998), and references therein.
- [19] E. Church et al. (BooNE Collab.), “A letter of intent for an experiment to measure oscillations and at the Fermilab Booster”, May 16, 1997, unpublished.
- [20] Z. Maki, M. Nakagawa, and S. Sakata, Prog. Theor. Phys. 28, 870 (1962).
- [21] L. Wolfenstein, Phys. Rev. D17, 2369 (1978).
- [22] V. Barger, S. Pakvasa, R.J.N. Phillips, and K. Whisnant, Phys. Rev. D22, 2718 (1980).
- [23] P. Langacker, J.P. Leveille, and J. Sheiman, Phys. Rev. D 27, 1228 (1983).
- [24] S.P. Mikheyev and A. Smirnov, Yad. Fiz. 42, 1441 (1985) [Sov. J. Nucl. Phys. 42, 913 (1986)].
- [25] R. Bernstein and S. Parke, Phys. Rev. D44, 2069 (1991).
- [26] P. Lipari, hep-ph/9903481; E. Akhmedov, P. Lipari, and M. Lusignoli, Phys. Lett. B300, 128 (1993); P. Lipari and M. Lusignoli, Phys. Rev. D58, 073005 (1998); E. Akhmedov, A. Dighe, P. Lipari, and A.Yu. Smirnov, Nucl. Phys. B542, 3 (1999); E.K. Akhmedov, Nucl. Phys. B538, 25 (1998).
- [27] S.T. Petcov, Phys. Lett. B434, 321 (1998); M.V. Chizhov, M. Maris, and S.T. Petcov, hep-ph/9810501; M.V. Chizhov and S.T. Petcov, hep-ph/9903424; S.T. Petcov, hep-ph/9910335.
- [28] H.W. Zaglauer and K.H. Schwarzer, Z. Phys. C40, 273 (1988); Q. Liu, S. Mikheyev, and A.Yu. Smirnov, Phys. Lett. B440, 319 (1998); P.I. Krastev, Nuovo Cimento A 103, 361 (1990).
- [29] J. Pruet and G.M. Fuller, astro-ph/9904023.
- [30] J. Pantaleone, Phys. Rev. D49, 2152 (1994); Phys. Rev. Lett. 81, 5060 (1998).
- [31] J. Arafune, J. Sato, Phys. Rev. D55, 1653 (1997); J. Arafune, M. Koike and J. Sato, Phys. Rev. D56, 3093 (1997); M. Tanimoto, Prog. Theor. Phys. 97, 901 (1997); H. Minakata and H. Nunokawa, Phys. Lett. B413, 369 (1997); H. Minakata and H. Nunokawa, Phys. Rev. D57, 4403 (1998); M. Koike and J. Sato, hep-ph/9909469; M. Koike and J. Sato, hep-ph/9911258.
- [32] I. Mocioiu and R. Shrock, hep-ph/9910554; T. Ohlsson and H. Snellman, hep-ph/9910546; A. Romanino, hep-ph/9909425.
- [33] Parameters of the Preliminary Reference Earth Model are given by A. Dziewonski, Earth Structure, Global, in “The Encyclopedia of Solid Earth Geophysics”, ed. by D.E. James, (Van Nostrand Reinhold, New York, 1989) p. 331; also see R. Gandhi, C. Quigg, M. Hall Reno, and I. Sarcevic, Astroparticle Physics 5, 81 (1996).
- [34] V. Barger, K. Whisnant, R.J.N. Phillips, Phys. Rev. Lett. 45, 2084 (1980)
- [35] R. Forty, hep-ex/9910061.
- [36] M.C. Gonzalez-Garcia, P.C. de Holanda, C. Peña-Garay, and J.W.F. Valle, hep-ph/9906469; J.N. Bahcall, P. Krastev, and A.Yu. Smirnov, hep-ph/9905220; J.N. Bahcall, P. Krastev, and A.Yu. Smirnov, Phys. Rev. D58, 096016 (1998); R. Barbieri, L.J. Hall, D. Smith, A. Strumia, and N. Weiner, JHEP 9812, 017 (1998); N. Hata and P. Langacker, Phys. Rev. D56, 6107 (1997).
- [37] The effects of the subleading oscillation scale in atmospheric neutrino experiments are discussed in O.L.G. Peres and A.Yu. Smirnov, Phys. Lett. B456, 204 (1999), hep-ph/9902312.
- [38] J.J. Gomez Cadenas, F. Dydak, A. C. Villanueva, presentation at the neutrino factory workshop, Lyon, 1999.
- [39] V. Barger, S. Geer, R. Raja, and K. Whisnant, in preparation.
- [40] M. Freund, M. Lindner, S.T. Petcov, and A. Romanino, hep-ph/9912457; A. Cervera, A. Donini, M.B. Gavela, J.J. Gomez Cadenas, P. Hernandez, and S. Rigolin, hep-ph/0002108.
| Sources | ||||||||||||
|---|---|---|---|---|---|---|---|---|---|---|---|---|
| FNAL | BNL | CERN | KEK | |||||||||
| Targets | (km) | ) | (km) | ) | (km) | ) | (km) | ) | ||||
| MINOS | 732 | 1.67 | 3.3 | 1715 | 1.67 | 7.7 | 6596 | 2.01 | 31 | 8559 | 2.20 | 42 |
| BNL | 1289 | 1.67 | 5.8 | 5921 | 1.91 | 28 | 9607 | 2.31 | 49 | |||
| SLAC | 2913 | 1.67 | 13 | 4513 | 1.69 | 19 | 8590 | 2.20 | 42 | 7720 | 2.12 | 37 |
| Gran Sasso | 7332 | 2.09 | 35 | 6565 | 2.00 | 31 | 743 | 1.67 | 3.3 | 8844 | 2.23 | 44 |
| Kamioka | 9165 | 2.26 | 46 | 9667 | 2.31 | 49 | 8774 | 2.22 | 44 | 252 | 1.67 | 1.1 |
| produced | detected | ||
|---|---|---|---|
| signature | oscillation | lepton | muon |
| -survival | |||
| -appearance | |||
| -appearance | |||
| -appearance |
| sign of | (GeV) | (GeV) | |||||
| 10 | 30 | 50 | 10 | 30 | 50 | ||
| km | |||||||
| (no osc) | 14,300 | 382,000 | 1,780,000 | 29,000 | 772,000 | 3,560,000 | |
| 11,200 | 372,000 | 1,760,000 | 22,800 | 750,000 | 3,520,000 | ||
| 11,200 | 372,000 | 1,760,000 | 22,900 | 751,000 | 3,530,000 | ||
| (no osc) | 24,200 | 656,000 | 3,050,000 | 12,400 | 329,000 | 1,520,000 | |
| 158 | 404 | 1000 | 69.4 | 276 | 486 | ||
| 106 | 410 | 718 | 65.2 | 223 | 380 | ||
| km | |||||||
| (no osc) | 1140 | 27,500 | 123,000 | 2200 | 52,500 | 244,000 | |
| 168 | 18,800 | 107,000 | 274 | 36,000 | 212,000 | ||
| 164 | 18,900 | 107,000 | 274 | 36,200 | 212,000 | ||
| (no osc) | 1400 | 43,300 | 211,000 | 900 | 22,600 | 102,000 | |
| 54 | 486 | 894 | 4 | 88 | 224 | ||
| 3.4 | 130 | 338 | 36 | 214 | 356 | ||
| km | |||||||
| (no osc) | 152 | 3880 | 17,500 | 294 | 7660 | 35,600 | |
| 84 | 592 | 7220 | 130 | 1040 | 14,900 | ||
| 72 | 558 | 7340 | 160 | 1130 | 15,000 | ||
| (no osc) | 21.8 | 6680 | 30,500 | 120 | 3300 | 15,200 | |
| 21.6 | 274 | 300 | 0.66 | 9 | 19.8 | ||
| 1.14 | 18 | 38 | 12.8 | 132 | 145 | ||
| sign of | (GeV) | (GeV) | |||||
| 10 | 30 | 50 | 10 | 30 | 50 | ||
| km | |||||||
| (no osc) | 14,300 | 382,000 | 1,780,000 | 29,000 | 772,000 | 3,560,000 | |
| 11,200 | 372,000 | 1,760,000 | 22,800 | 750,000 | 3,520,000 | ||
| 11,200 | 372,000 | 1,760,000 | 22,900 | 751,000 | 3,530,000 | ||
| (no osc) | 24,200 | 656,000 | 3,050,000 | 12,400 | 329,000 | 1,520,000 | |
| 19.4 | 73.6 | 127 | 8.6 | 35.2 | 61.8 | ||
| 8.4 | 30.2 | 52.2 | 5.34 | 16.6 | 27.8 | ||
| km | |||||||
| (no osc) | 1140 | 27,500 | 123,000 | 2200 | 52,500 | 244,000 | |
| 168 | 18,800 | 107,000 | 276 | 35,900 | 212,000 | ||
| 166 | 18,900 | 107,000 | 274 | 36,200 | 212,000 | ||
| (no osc) | 1400 | 43,300 | 211,000 | 900 | 22,600 | 102,000 | |
| 5.2 | 56.4 | 108 | 0.82 | 11.6 | 29 | ||
| 0.64 | 10 | 24.6 | 4.4 | 19.2 | 29.6 | ||
| km | |||||||
| (no osc) | 152 | 3800 | 17,500 | 294 | 7660 | 35,600 | |
| 84 | 586 | 7140 | 152 | 1100 | 14,600 | ||
| 84 | 586 | 7220 | 158 | 1200 | 15,000 | ||
| (no osc) | 218 | 6680 | 30,500 | 120 | 3300 | 15,200 | |
| 2.58 | 30.2 | 32.8 | 0.066 | 0.89 | 1.98 | ||
| 0.112 | 1.77 | 3.8 | 1.52 | 14.6 | 144 | ||
| Fitted energy | sin | ||||
|---|---|---|---|---|---|
| (GeV) | (km) | Events fitted | range (GeV) | error | error |
| 10 | 732 | 847 | 0–4 | 7.6 | 6.7 |
| 10 | 2800 | 284 | 0–10 | 1.1 | 2.4 |
| 10 | 7332 | 126 | 0–12 | 13 | 6.3 |
| 30 | 732 | 3984 | 0–12 | 14 | 8.9 |
| 30 | 2800 | 623 | 0–12 | 2.0 | 3.2 |
| 30 | 7332 | 655 | 0–25 | 0.57 | 1.2 |
| 50 | 732 | 1573 | 0–12 | 17 | 12 |
| 50 | 2800 | 169 | 0–10 | 1.8 | 4.9 |
| 50 | 7332 | 834 | 0–28 | 0.64 | 1.4 |
| Survival | Appearance | |||||
| sin | sin | sin | ||||
| statistical | statistical | 10 Event | 3 sign | |||
| (km) | (GeV) | precision | precision | sensitivity | effects | |
| 732 | 10 | 7.6% | 6.7% | 0.002 | 0.1 | large |
| 732 | 30 | 14% | 8.9% | 0.0005 | 0.1 | large |
| 732 | 50 | 17% | 12% | 0.0003 | large | |
| 2800 | 10 | 1.1% | 2.4% | 0.008 | 0.1 | moderate |
| 2800 | 30 | 2.0% | 3.2% | 0.0007 | 0.005 | moderate |
| 2800 | 50 | 1.8% | 4.9% | 0.0004 | 0.003 | moderate |
| 7332 | 10 | 13% | 6.3% | 0.02 | 0.1 | negligible |
| 7332 | 30 | 0.57% | 1.2% | 0.001 | 0.04 | negligible |
| 7332 | 50 | 0.64% | 1.4% | 0.002 | 0.02 | negligible |